Gold Backing worldwidePart 1: The Origins of Gold as Money
Ancient Civilizations
Gold was used by Egyptians as early as 2600 BCE for jewelry, trade, and as a symbol of wealth.
In Mesopotamia, gold was valued as a unit of exchange in trade agreements.
Ancient Greeks and Romans minted gold coins, which spread across Europe and Asia.
Gold as Universal Acceptance
Because of its rarity, durability, and divisibility, gold became the universal standard of value across cultures. Unlike perishable goods or barter items, gold retained value and was easily transferable. This laid the foundation for gold to back economies centuries later.
Part 2: The Rise of the Gold Standard
19th Century Development
The classical gold standard emerged in the 19th century. Countries fixed their currencies to a certain amount of gold, ensuring stability in exchange rates. For example:
Britain officially adopted the gold standard in 1821.
Other major economies — Germany, France, the U.S. — followed by late 19th century.
How It Worked
Governments promised to exchange paper currency for a fixed quantity of gold.
This restrained governments from printing excessive money, keeping inflation low.
International trade was simplified because exchange rates were fixed by gold parity.
Benefits
Stability of currency.
Encouraged trade and investment.
Limited inflation due to money supply constraints.
Drawbacks
Restricted economic growth during crises.
Countries with trade deficits lost gold, forcing painful economic adjustments.
Part 3: Gold Backing in the 20th Century
World War I Disruptions
Most nations suspended the gold standard to finance military spending.
Post-war, many tried to return, but economic instability weakened confidence.
The Interwar Gold Exchange Standard
A modified version emerged in the 1920s, allowing reserve currencies (like the U.S. dollar and British pound) to be backed by gold.
This proved unstable and collapsed during the Great Depression.
Bretton Woods System (1944 – 1971)
After World War II, a new system was established at the Bretton Woods Conference.
The U.S. dollar became the anchor currency, convertible into gold at $35 per ounce.
Other currencies pegged themselves to the dollar.
This system created a gold-backed dollar world order where gold indirectly supported most global currencies.
Collapse of Gold Convertibility (1971)
In 1971, President Richard Nixon suspended gold convertibility (“Nixon Shock”).
Reasons: U.S. trade deficits, inflation, and inability to maintain gold-dollar balance.
This marked the beginning of fiat currency dominance.
Part 4: Gold’s Role in Modern Economies
Even though direct gold backing ended, gold remains vital:
1. Central Bank Reserves
Central banks worldwide hold gold as part of their foreign exchange reserves.
Provides diversification, stability, and acts as insurance against currency crises.
Major holders include the U.S., Germany, Italy, France, Russia, China, and India.
2. Store of Value & Inflation Hedge
Gold is a safe haven during economic or geopolitical crises.
Investors flock to gold when fiat currencies weaken.
3. Confidence in Currencies
Though fiat currencies are no longer backed by gold, the size of gold reserves adds credibility to a nation’s financial system.
4. Gold-Backed Financial Instruments
Exchange-traded funds (ETFs) backed by gold bullion.
Gold-backed digital currencies (such as tokenized assets on blockchain).
Part 5: Global Gold Reserves – Who Holds the Most?
According to World Gold Council data (2025 estimates):
United States: ~8,133 tonnes (largest holder, ~70% of reserves in gold).
Germany: ~3,350 tonnes.
Italy: ~2,450 tonnes.
France: ~2,435 tonnes.
Russia: ~2,300 tonnes (massively increased in past decade).
China: ~2,200 tonnes (increasing steadily to challenge U.S. dominance).
India: ~825 tonnes (also a large private gold ownership nation).
Smaller nations also hold gold as part of strategic reserves, although percentages vary.
Part 6: Regional Perspectives on Gold Backing
United States
No longer directly gold-backed, but U.S. gold reserves underpin the dollar’s strength.
Fort Knox remains symbolic of America’s monetary power.
Europe
The European Central Bank (ECB) and eurozone nations collectively hold significant gold.
Gold gives the euro credibility as a global reserve currency.
Russia
Increased gold reserves significantly to reduce dependence on the U.S. dollar amid sanctions.
Gold is a strategic geopolitical weapon.
China
Gradually building reserves to strengthen the yuan’s role in global trade.
Gold accumulation aligns with ambitions of yuan internationalization.
India
Holds large reserves at the central bank level and even larger amounts privately.
Gold plays a cultural, economic, and financial safety role.
Middle East
Gulf countries with oil wealth also diversify with gold reserves.
Some are exploring gold-backed digital currencies.
The Future of Gold Backing
Possible Scenarios
Status Quo – Fiat currencies dominate, gold remains a reserve hedge.
Partial Gold Return – Nations introduce partial gold-backing to increase trust.
Digital Gold Standard – Blockchain-based systems tied to gold reserves gain traction.
Multipolar Currency Order – Gold used more in BRICS or Asia-led alternatives to the dollar.
Likely Outcome
While a full gold standard is unlikely, gold’s role as a stabilizer and insurance policy will remain or even grow in uncertain times.
Conclusion
Gold backing has shaped global finance for centuries — from the classical gold standard to Bretton Woods and beyond. Although modern currencies are no longer directly convertible into gold, the metal continues to influence monetary policy, global reserves, and investor behavior. Central banks across the world still trust gold as the ultimate hedge against uncertainty.
In an age of rising geopolitical tensions, inflationary pressures, and digital finance, gold’s importance may even increase. Whether as part of central bank reserves, through gold-backed tokens, or as a foundation for regional trade systems, gold remains deeply woven into the fabric of the global monetary order.
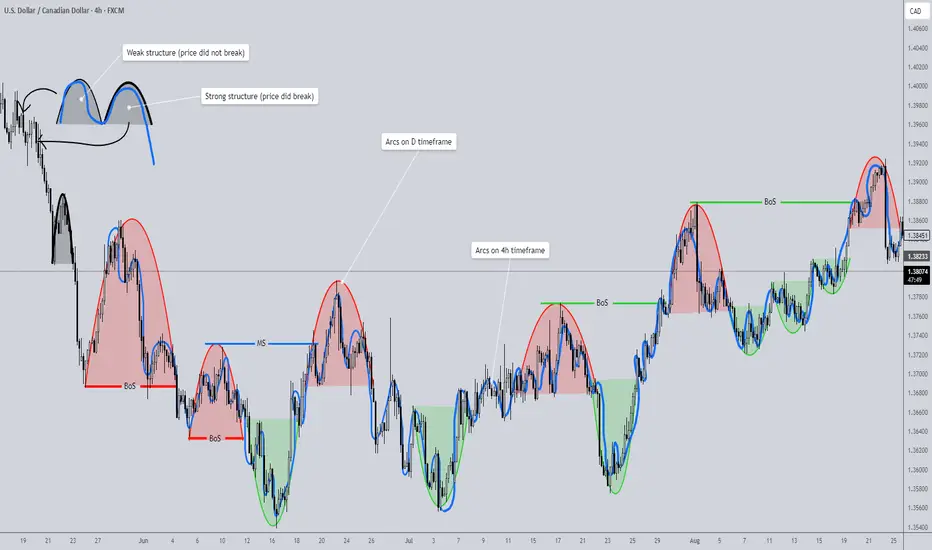
Chart Patterns

Strategies & Styles in Global TradingPart 1: Foundations of Global Trading Strategies
1.1 Strategic Thinking in Trading
Trading strategies aim to answer three critical questions:
What to trade? (stocks, forex, commodities, indices, crypto, bonds).
When to trade? (entry and exit timing based on analysis).
How much to risk? (position sizing and risk management).
Without a defined strategy, trading becomes speculation driven by emotions.
1.2 Key Influences on Strategy
Global strategies are shaped by:
Market type: Developed (US, EU, Japan) vs. Emerging (India, Brazil, South Africa).
Time horizon: Long-term investments vs. intraday moves.
Information source: Technical analysis, fundamental analysis, quantitative models, or macroeconomic data.
Technology: Algorithmic trading, AI-driven predictions, and blockchain-based platforms.
Part 2: Major Trading Styles
2.1 Day Trading
Definition: Buying and selling within the same day, closing all positions before market close.
Features: Relies on volatility, liquidity, and rapid decision-making.
Tools Used: Intraday charts (1-min, 5-min, 15-min), moving averages, volume profile, momentum indicators.
Global Example: US tech stocks like Tesla or Nvidia are favorite day-trading instruments due to volatility.
Pros: Quick profits, no overnight risk.
Cons: High stress, requires constant monitoring, heavy brokerage costs.
2.2 Swing Trading
Definition: Holding trades for several days or weeks to capture medium-term price swings.
Basis: Combines technical chart patterns with macro/fundamental cues.
Global Example: Trading EUR/USD currency pair during central bank policy cycles.
Pros: Less stressful than day trading, better reward-to-risk ratio.
Cons: Requires patience; risk of overnight news shocks.
2.3 Position Trading
Definition: Long-term strategy, holding positions for months or years.
Basis: Fundamental analysis (earnings, economic cycles, interest rates).
Global Example: Long-term bullish positions in gold as an inflation hedge.
Pros: Less frequent monitoring, aligns with macro trends.
Cons: Requires strong conviction and capital lock-in.
2.4 Scalping
Definition: Ultra-short-term trading strategy, aiming for small profits on many trades.
Basis: Order flow, bid-ask spreads, micro-movements.
Global Example: Forex scalpers trade EUR/USD, GBP/USD due to high liquidity.
Pros: Rapid compounding of profits, no overnight risk.
Cons: High transaction costs, requires lightning-fast execution.
2.5 Algorithmic & Quantitative Trading
Definition: Using computer models, AI, and algorithms to trade automatically.
Methods: Statistical arbitrage, mean reversion, machine learning models.
Global Example: Hedge funds like Renaissance Technologies use quant models to outperform markets.
Pros: Emotion-free, scalable, works 24/7 in multiple markets.
Cons: Requires advanced coding skills, backtesting, and infrastructure.
2.6 High-Frequency Trading (HFT)
Definition: Subset of algorithmic trading using microsecond execution speed.
Basis: Profiting from inefficiencies in order books, arbitrage, spreads.
Global Example: Chicago Mercantile Exchange (CME) futures and US equities.
Pros: Can generate huge volumes of small profits.
Cons: Expensive technology, regulatory scrutiny, highly competitive.
2.7 Event-Driven Trading
Definition: Trading based on news, earnings reports, central bank decisions, or geopolitical events.
Global Example: Buying oil futures after OPEC production cuts; trading GBP during Brexit votes.
Pros: High potential returns.
Cons: High volatility, unpredictable outcomes.
2.8 Arbitrage Strategies
Definition: Profiting from price discrepancies between markets.
Types:
Spatial arbitrage (same asset, different markets).
Triangular arbitrage (currency mismatches).
Merger arbitrage (M&A deals).
Global Example: Simultaneously buying and selling Bitcoin on different exchanges.
Pros: Low-risk if executed correctly.
Cons: Requires speed, capital, and advanced systems.
Part 3: Global Trading Strategies by Asset Class
3.1 Equity Trading Strategies
Value Investing: Buying undervalued stocks (Warren Buffett approach).
Growth Investing: Targeting high-growth sectors like AI or EVs.
Momentum Trading: Riding the wave of strong price trends.
Pairs Trading: Long one stock, short another in the same sector.
3.2 Forex Trading Strategies
Carry Trade: Borrowing in low-interest currency, investing in high-interest currency.
Breakout Trading: Entering positions after a currency breaks key levels.
Range Trading: Buying low, selling high in sideways markets.
News Trading: Trading during central bank announcements or data releases.
3.3 Commodity Trading Strategies
Trend Following: Using moving averages for oil, gold, wheat.
Seasonal Strategies: Trading based on harvests or demand cycles.
Hedging: Producers using futures to lock in prices.
Spread Trading: Buying one commodity and selling another related one (e.g., crude oil vs. heating oil).
3.4 Bond & Fixed Income Trading Strategies
Yield Curve Strategies: Positioning based on steepening or flattening yield curves.
Credit Spread Trading: Exploiting risk premiums between corporate and government bonds.
Duration Hedging: Managing sensitivity to interest rate changes.
3.5 Cryptocurrency Trading Strategies
HODLing: Long-term holding of Bitcoin, Ethereum.
DeFi Yield Farming: Earning interest from decentralized lending protocols.
Arbitrage: Spot vs. futures arbitrage.
Momentum & Volatility Plays: Crypto thrives on extreme price swings.
Part 4: Risk Management & Psychology in Strategies
4.1 Risk Management Tools
Stop-Loss & Take-Profit Orders.
Position Sizing (1–2% capital per trade rule).
Diversification across assets and geographies.
Hedging with options/futures.
4.2 Psychological Styles in Trading
Aggressive vs. Conservative traders.
Discretionary vs. Systematic approaches.
Risk-seeking vs. Risk-averse behaviors.
Trading psychology (discipline, patience, emotion control) often defines whether a strategy succeeds or fails.
Part 5: Regional Differences in Global Trading Styles
US Markets: Heavy focus on tech stocks, options trading, and HFT.
Europe: Strong in forex, bonds, and energy trading.
Asia (Japan, China, India): Retail-dominated, rising algo-trading adoption.
Middle East: Commodity-heavy (oil, petrochemicals).
Africa & Latin America: Emerging markets, currency and commodity-driven.
Part 6: The Future of Global Trading Strategies
AI & Machine Learning: Automated strategies learning from big data.
Blockchain & Tokenization: 24/7 trading, decentralized exchanges.
Sustainable Trading: ESG-based strategies, carbon credits.
Cross-Asset Strategies: Linking equities, commodities, crypto, and derivatives.
Conclusion
Global trading is not just about buying and selling—it is about choosing the right strategy and style that aligns with one’s goals, risk tolerance, and market conditions.
From short-term scalping to long-term investing, from algorithmic arbitrage to macro-driven positioning, traders worldwide adapt strategies to seize opportunities across stocks, currencies, commodities, bonds, and cryptocurrencies.
The winning formula is not a single "best" style—it’s about discipline, adaptability, risk management, and continuous learning. Markets evolve, and so must strategies.
Trading Instruments in global market 1. Equities (Stocks)
Definition
Equities, also called stocks or shares, represent ownership in a company. By buying a share, an investor becomes a partial owner of that company and is entitled to a portion of profits (dividends) and potential capital appreciation.
Key Characteristics
Ownership: A share means holding equity in a company.
Voting rights: Common stockholders can vote in company decisions.
Returns: Gains come from dividends and share price appreciation.
Liquidity: Highly liquid, especially in large stock exchanges like NYSE, NASDAQ, NSE, and LSE.
Types of Equities
Common Stock – Offers voting rights and dividends.
Preferred Stock – Fixed dividends but limited/no voting rights.
Blue-Chip Stocks – Shares of large, stable companies.
Growth Stocks – Companies with high potential for expansion.
Penny Stocks – Low-priced, high-risk speculative shares.
Global Relevance
Equities are among the most popular instruments globally because they allow both short-term trading and long-term wealth creation. For example:
The US stock market is worth over $50 trillion.
Emerging markets like India, Brazil, and China are attracting growing investor interest due to rapid economic growth.
2. Fixed-Income Securities (Bonds)
Definition
A bond is essentially a loan made by an investor to a borrower (government, corporation, or institution). The borrower promises to pay interest (coupon) and return the principal on maturity.
Key Characteristics
Low risk (relative to stocks), especially in government bonds.
Predictable returns in the form of interest.
Variety of maturities (short, medium, and long-term).
Types of Bonds
Government Bonds (Treasuries, Gilts, Sovereign Bonds) – Issued by national governments.
Corporate Bonds – Issued by companies to raise capital.
Municipal Bonds – Issued by cities or states.
High-Yield (Junk) Bonds – Riskier but offer higher returns.
Inflation-Indexed Bonds – Adjust payouts with inflation rates.
Global Relevance
The US Treasury market is the largest bond market in the world and a global benchmark for interest rates.
Countries issue bonds to finance deficits, making them a cornerstone of international trade and finance.
3. Currencies (Foreign Exchange or Forex)
Definition
Currencies are the most liquid instruments globally, traded in the foreign exchange (forex) market, which has a daily turnover of over $7.5 trillion (2025 est.).
Key Characteristics
24-hour trading (Monday–Friday).
High leverage availability for traders.
Paired trading (e.g., USD/INR, EUR/USD, GBP/JPY).
Heavily influenced by macroeconomic policies, central banks, and geopolitics.
Major Currency Pairs
Major Pairs: EUR/USD, GBP/USD, USD/JPY, USD/CHF.
Minor Pairs: EUR/GBP, AUD/JPY.
Exotic Pairs: USD/INR, USD/TRY.
Uses
Businesses hedge against currency fluctuations.
Central banks maintain stability.
Traders speculate on price movements.
4. Commodities
Definition
Commodities are physical goods that are traded on exchanges, often used as raw materials in production.
Types of Commodities
Metals – Gold, Silver, Copper, Platinum.
Energy – Crude Oil, Natural Gas, Coal.
Agricultural Products – Wheat, Coffee, Cotton, Soybeans.
Livestock – Cattle, Hogs.
Key Characteristics
Hedging tool against inflation (gold, oil).
Geopolitical sensitivity (oil prices surge in wars/conflicts).
Global trade-driven demand and supply.
Global Relevance
Oil is the most traded commodity, central to global energy.
Gold acts as a safe-haven asset during economic uncertainty.
Agricultural commodities impact food security and global trade.
5. Derivatives
Definition
Derivatives are contracts whose value is derived from an underlying asset (stocks, bonds, currencies, or commodities).
Types of Derivatives
Futures – Agreements to buy/sell at a future date at a set price.
Options – Rights (not obligations) to buy/sell at a specific price.
Swaps – Contracts to exchange cash flows (e.g., interest rate swaps).
Forwards – Customized contracts between two parties.
Key Characteristics
Used for hedging risk (e.g., airlines hedge fuel prices).
Allow speculation on future price movements.
Offer leverage, amplifying gains/losses.
Global Relevance
The derivatives market is massive—worth quadrillions in notional value.
Exchanges like CME, ICE, and NSE are major global hubs.
6. Exchange-Traded Funds (ETFs) & Mutual Funds
ETFs
Traded like stocks on exchanges.
Track indexes, sectors, or commodities (e.g., SPDR S&P 500 ETF).
Offer diversification at low cost.
Mutual Funds
Actively managed investment vehicles.
Pool money from investors to buy diversified securities.
Suitable for long-term investors.
Global Relevance
ETFs have become highly popular among retail investors.
India and Asia are seeing a surge in passive investing via ETFs.
7. Real Estate Investment Trusts (REITs)
Definition
REITs are companies that own, operate, or finance income-generating real estate (offices, malls, warehouses).
Benefits
Provide exposure to real estate without direct ownership.
Offer dividends from rental income.
Highly liquid compared to physical property.
Global Relevance
REITs are major in the US, Singapore, and Australia, while India has introduced them in recent years for commercial real estate.
8. Hedge Funds & Private Equity Instruments
Hedge Funds
Pool money from wealthy investors to take aggressive positions.
Use derivatives, leverage, and short-selling.
Private Equity (PE)
Invests directly in private companies or buyouts.
Long-term, illiquid, but high potential returns.
Global Relevance
Hedge funds influence markets with speculative bets.
PE drives business growth, restructuring, and IPOs.
9. Cryptocurrencies & Digital Assets
Definition
Cryptocurrencies are decentralized digital currencies using blockchain technology.
Examples
Bitcoin (BTC) – The most popular crypto.
Ethereum (ETH) – Smart contracts and decentralized apps.
Stablecoins (USDT, USDC) – Pegged to fiat currencies.
Central Bank Digital Currencies (CBDCs) – Being developed by governments.
Characteristics
Volatile and speculative.
24/7 global trading.
Used for payments, remittances, and decentralized finance (DeFi).
Global Relevance
Cryptos are gaining institutional acceptance.
Some countries (El Salvador) have adopted Bitcoin as legal tender.
CBDCs could reshape global payment systems.
10. Alternative Trading Instruments
Carbon Credits – Traded to offset emissions.
Weather Derivatives – Used by agriculture/energy companies to hedge risks.
Art & Collectibles – NFTs and physical art as investment assets.
VIX Futures – Trading volatility index as a fear gauge.
Conclusion
The global market is a vast ocean of trading instruments, each serving a distinct purpose. From the stability of bonds to the high-risk-high-reward world of derivatives and cryptocurrencies, these instruments cater to every kind of investor—risk-averse savers, speculative traders, hedging corporates, and long-term wealth builders.
Understanding these instruments is crucial because the modern financial world is deeply interconnected. A shift in interest rates affects bonds, currencies, equities, and commodities simultaneously. Similarly, geopolitical events ripple across forex, oil, and stock markets.
For traders and investors, the key lies in:
Selecting the right mix of instruments.
Managing risks using diversification and hedging.
Staying updated on global economic and geopolitical trends.
In essence, trading instruments are not just tools of profit—they are the lifeblood of the global financial system. Mastering them is mastering the art of navigating global markets.

Global Supply Chain Shifts & Trade RoutesPart 1: Understanding Supply Chains and Trade Routes
What is a Supply Chain?
A supply chain is the complete journey of a product, from sourcing raw materials to manufacturing, distribution, and finally reaching consumers. It includes:
Raw materials (e.g., lithium for batteries, crude oil for fuel).
Manufacturing & assembly (factories, plants, workshops).
Logistics & transport (shipping, trucking, railways, air cargo).
Warehousing & distribution (storage, retail, e-commerce hubs).
End consumers (you and me).
What are Trade Routes?
Trade routes are the physical pathways (land, sea, or air) that connect countries and regions for commerce. Historically, these routes were shaped by geography and politics—like the Silk Road or the Spice Route. Today, they are dominated by major shipping lanes, railways, and digital trade corridors.
Part 2: Historical Evolution of Global Trade Routes
Ancient Trade Networks
Silk Road connected China with Europe, spreading silk, spices, and culture.
Maritime Spice Routes linked India, Southeast Asia, and the Middle East.
Trans-Saharan Routes carried gold, salt, and slaves across Africa.
Colonial Era & Maritime Dominance
European powers built sea empires, controlling trade in spices, tea, and cotton.
The discovery of sea routes around Africa and to the Americas reshaped global trade.
Colonization integrated global economies but created exploitative patterns.
Industrial Revolution & Global Integration
Railways and steamships shortened trade times.
The Suez Canal (1869) and Panama Canal (1914) became game-changers.
New manufacturing hubs emerged, fueling trade growth.
20th Century & Globalization
After World War II, institutions like WTO, IMF, and World Bank promoted open trade.
Containerization in the 1950s revolutionized logistics.
Asia, particularly China, became the world’s factory.
Part 3: Modern Supply Chains – How They Work
Modern supply chains are highly globalized and interdependent. For example:
An iPhone involves design in the U.S., chip production in Taiwan, assembly in China, and raw materials from Africa.
A car may have parts from Germany, software from India, steel from Japan, and be assembled in Mexico.
Features of Modern Supply Chains
Just-In-Time (JIT) Systems – reduce inventory costs but create vulnerabilities.
Multi-Country Production – different stages spread worldwide.
Specialization – each region focuses on what it does best (e.g., Vietnam in textiles, Taiwan in semiconductors).
Speed & Efficiency – enabled by digital tracking, AI, and automation.
Part 4: Major Shifts in Global Supply Chains
Global supply chains are not static. Recent decades have seen shifts driven by multiple forces:
1. Geopolitical Realignments
US-China trade war led to tariffs, restrictions, and diversification.
Countries like Vietnam, India, and Mexico became alternative manufacturing hubs.
New blocs (e.g., BRICS+, ASEAN) are reshaping trade patterns.
2. Pandemic Disruptions
COVID-19 exposed vulnerabilities: shipping delays, factory shutdowns, semiconductor shortages.
“Resilience” became a buzzword, with firms adopting China+1 strategies.
3. Technological Advancements
Automation, AI, and robotics reduce reliance on cheap labor.
Digital supply chains improve tracking and forecasting.
3D printing could localize production.
4. Environmental Pressures
Climate change affects shipping (melting Arctic routes, droughts in Panama Canal).
Push for green supply chains with lower carbon footprints.
ESG regulations are changing corporate strategies.
5. Regionalization & Nearshoring
Companies are moving closer to consumer markets.
Example: U.S. firms shifting from China to Mexico (nearshoring).
Europe considering North Africa and Eastern Europe.
Part 5: Key Global Trade Routes Today
1. Maritime Routes (80% of world trade by volume)
Suez Canal (Egypt) – shortcut between Europe and Asia.
Panama Canal (Central America) – connects Atlantic and Pacific.
Strait of Malacca – vital for oil and goods between Asia & the Middle East.
Strait of Hormuz – critical chokepoint for global oil supply.
2. Land Routes
China’s Belt and Road Initiative (BRI) – massive rail, road, and port infrastructure across Eurasia.
Trans-Siberian Railway – links Europe to Asia.
North-South Transport Corridor (Russia-Iran-India) – an emerging alternative.
3. Air Routes
Used mainly for high-value goods (electronics, medicines, luxury products).
Major hubs: Dubai, Singapore, Hong Kong, Frankfurt, Chicago.
4. Digital Routes
Undersea fiber-optic cables connect internet trade.
Digital trade is growing faster than physical trade.
Conclusion
The world’s supply chains and trade routes are in the middle of a historic transformation. Globalization once pushed for efficiency, low costs, and interconnectedness. Now, resilience, security, sustainability, and regional balance are the new priorities.
The Silk Roads of the past have evolved into today’s digital highways and maritime super-routes. As countries compete for influence, companies adapt strategies, and technologies redefine possibilities, the global supply chain will remain both a driver of prosperity and a barometer of geopolitical shifts.
The coming decades will not eliminate globalization but reshape it—making trade networks more regional, sustainable, and technologically advanced. In this new era, supply chains will not only determine economic success but also shape the balance of global power.

Global Currency Movements (Dollar, Euro, Yen, Yuan)Part 1: The U.S. Dollar (USD) – The Global Kingpin
1.1 Historical Background
The U.S. dollar has been the undisputed global reserve currency since World War II. Before that, the British pound held the crown during the height of the British Empire. But after the Bretton Woods Agreement (1944), the dollar became the anchor of the global monetary system, pegged to gold at $35 per ounce. Even after the Nixon Shock (1971) ended the gold standard, the dollar retained its dominance because of America’s economic size, deep financial markets, and political power.
1.2 Why the Dollar is So Dominant
Reserve Currency Status: Over 58% of global foreign exchange reserves are in USD.
Petrodollar System: Oil and many other commodities are priced and traded in dollars.
Financial Markets: U.S. bond markets are the deepest and most liquid, attracting global investors.
Military and Political Power: The U.S. exerts influence through sanctions, trade deals, and global institutions.
1.3 Movements of the Dollar
The dollar index (DXY) tracks the USD against a basket of currencies (EUR, JPY, GBP, CAD, SEK, CHF). It rises during:
Tight U.S. monetary policy (higher interest rates attract foreign capital).
Global crises (investors flee to dollar as a safe-haven).
Weakness in other currencies (especially Euro and Yen).
It falls during:
Loose monetary policy (printing money, quantitative easing).
High U.S. deficits and debt concerns.
Strong growth abroad (capital flows shift to emerging markets).
1.4 Impact of Dollar Movements
Strong Dollar: Bad for U.S. exporters, good for U.S. consumers (cheaper imports). Hurts emerging markets with dollar-denominated debt.
Weak Dollar: Boosts U.S. exports, fuels inflation at home, but supports global liquidity.
Part 2: The Euro (EUR) – The Challenger
2.1 Birth of the Euro
The Euro was launched in 1999 as a bold project of European integration. Today, 20 of 27 EU nations use the Euro, making it the second-most traded currency after the dollar.
2.2 Strengths of the Euro
Large Economy: The Eurozone has a GDP close to the U.S.
Trade Power: Europe is a major exporter of machinery, luxury goods, and chemicals.
Reserves: Around 20% of global reserves are in euros.
2.3 Weaknesses of the Euro
Lack of Fiscal Unity: Different countries, different budgets, but one currency.
Debt Crises: The 2010–2012 Eurozone debt crisis (Greece, Italy, Spain) exposed structural flaws.
Political Tensions: Brexit and rising nationalism pose risks.
2.4 Euro Movements
The euro’s value against the dollar (EUR/USD) is the world’s most traded currency pair. It rises when:
The European Central Bank (ECB) raises rates.
Europe has strong trade surpluses.
Dollar weakens due to U.S. deficits.
It falls when:
Debt crises or recessions hit Europe.
Energy shocks raise import costs (Europe imports lots of oil & gas).
ECB follows looser monetary policy compared to the Fed.
2.5 Impact of Euro Movements
Strong Euro: Hurts European exports but reduces import costs.
Weak Euro: Boosts exports but fuels inflation (especially energy prices).
Part 3: The Japanese Yen (JPY) – The Safe Haven
3.1 Historical Role
Japan became a global economic powerhouse in the 1970s–80s. The yen was seen as a strong currency due to Japan’s trade surpluses, technological dominance, and manufacturing exports.
3.2 Why Yen is a Safe Haven
High Current Account Surplus: Japan consistently exports more than it imports.
Political Stability: Despite slow growth, Japan is politically stable.
Low Inflation: The yen has maintained purchasing power compared to many currencies.
3.3 Yen Movements
The yen is often linked to carry trades:
Japan keeps ultra-low interest rates.
Investors borrow cheaply in yen and invest in higher-yielding assets abroad.
When global risk sentiment worsens, investors unwind trades, repurchasing yen → yen strengthens.
So the yen tends to:
Strengthen in crises (safe-haven flows).
Weaken when global markets are bullish (carry trades flourish).
3.4 Impact of Yen Movements
Strong Yen: Hurts Japanese exporters like Toyota, Sony, and Panasonic. But lowers import costs (energy, raw materials).
Weak Yen: Helps exporters, boosts inflation, but reduces Japanese consumers’ purchasing power.
Part 4: The Chinese Yuan (CNY/RMB) – The Rising Power
4.1 Historical Transformation
Before the 2000s, the yuan was tightly controlled and not relevant globally. But as China opened up, became the world’s factory, and the second-largest economy, its currency gained importance.
In 2016, the IMF included the yuan in its SDR (Special Drawing Rights) basket, alongside the dollar, euro, yen, and pound—cementing its status as a global currency.
4.2 Controlled Currency
Unlike the dollar, euro, or yen, the yuan is not fully free-floating. The People’s Bank of China (PBOC) sets a daily reference rate and allows it to trade within a band.
4.3 Yuan Movements
The yuan rises when:
China’s trade surplus is strong (exports booming).
PBOC supports stability to attract global investors.
Global demand for Chinese bonds and equities grows.
It weakens when:
China faces capital outflows.
U.S. imposes tariffs or sanctions.
Domestic economy slows down (property crisis, low growth).
4.4 China’s Strategy
China actively promotes the yuan in trade (especially with Belt & Road partners). Many oil deals with Russia, Iran, and Middle Eastern countries are increasingly settled in yuan—challenging the petrodollar system.
4.5 Impact of Yuan Movements
Strong Yuan: Makes Chinese exports less competitive but strengthens China’s global financial credibility.
Weak Yuan: Helps exports but risks capital flight and global accusations of “currency manipulation.”
Part 5: Interplay Between Dollar, Euro, Yen, and Yuan
Currencies don’t move in isolation—they interact.
Dollar vs Euro: Often a mirror image. If dollar rises, euro falls (and vice versa).
Dollar vs Yen: Sensitive to Fed and Bank of Japan interest rate policies.
Dollar vs Yuan: Politically charged, linked to U.S.-China trade tensions.
Euro vs Yen/Yuan: Reflects Europe’s role in Asia trade.
These currencies dominate Forex trading:
EUR/USD → most traded.
USD/JPY → second most traded.
USD/CNY → increasingly important.
Conclusion
The U.S. Dollar, Euro, Yen, and Yuan are not just symbols on forex screens—they are reflections of global power, trade, and politics. The dollar remains king, the euro is a strong but fractured challenger, the yen is a safe haven, and the yuan is the ambitious rising star.
Currency movements will continue to shape the global economy—deciding who gains, who loses, and how wealth shifts across borders. For traders, policymakers, and everyday citizens, watching these four currencies is key to understanding the world’s financial heartbeat.

US Federal Reserve Policy & Global Interest RatesPart I: The Role of the Federal Reserve
1. Origin and Mandate
The Federal Reserve was created in 1913 to stabilize the U.S. financial system after frequent banking crises. Today, its core mandate, often referred to as the dual mandate, is:
To maintain price stability (control inflation).
To achieve maximum employment.
Unlike some central banks (e.g., ECB, which focuses mainly on inflation), the Fed balances growth and stability.
2. Policy Tools
The Fed has three primary tools:
Federal Funds Rate (FFR): The short-term interest rate at which banks lend to each other. Adjustments to the FFR ripple through the economy, affecting borrowing costs for mortgages, auto loans, and corporate credit.
Open Market Operations (OMO): Buying or selling government securities to manage liquidity in the financial system.
Reserve Requirements: Minimum reserves banks must hold (rarely changed now).
Since the 2008 financial crisis, new unconventional tools have been added:
Quantitative Easing (QE): Large-scale bond purchases to inject liquidity and lower long-term interest rates.
Forward Guidance: Communicating future policy intentions to shape market expectations.
Part II: How Fed Policy Shapes Global Interest Rates
1. The Dollar’s Dominance
The U.S. dollar is used in over 85% of global foreign exchange transactions and is the world’s leading reserve currency. This means when the Fed changes rates, it directly impacts the global cost of capital.
2. Capital Flows and Emerging Markets
When U.S. interest rates are low, investors look abroad for higher yields, often pouring money into emerging markets (India, Brazil, Indonesia, etc.). When the Fed raises rates, capital tends to flow back into the U.S., pressuring emerging market currencies and raising borrowing costs.
Example: The 2013 Taper Tantrum, when the Fed hinted at reducing QE, triggered massive outflows from emerging markets, weakening their currencies and forcing many to raise domestic interest rates to protect stability.
3. Global Bond Yields
U.S. Treasury bonds are the global benchmark for “risk-free” assets. If U.S. yields rise (due to Fed tightening), global bond yields also tend to rise as investors demand comparable returns. This impacts corporate debt, mortgages, and sovereign bonds worldwide.
4. Exchange Rates and Trade
Higher U.S. rates make the dollar stronger. This hurts exporters in countries like Japan, South Korea, and India (whose currencies weaken), but helps U.S. consumers by making imports cheaper.
Part III: Historical Case Studies
1. The Volcker Era (1979–1987)
Paul Volcker, then Fed Chairman, famously raised interest rates to nearly 20% to combat runaway inflation. This caused a U.S. recession but restored price stability. Globally, developing nations faced debt crises because their dollar-denominated loans became unpayable at higher rates.
2. Dot-Com Bubble and 2001 Recession
After the dot-com crash, the Fed cut rates sharply to support the economy. Low global interest rates encouraged borrowing and fueled asset bubbles in housing markets around the world.
3. 2008 Global Financial Crisis
The Fed slashed rates to near zero and launched QE. This flooded the world with cheap liquidity, boosting global markets but also encouraging excessive risk-taking in emerging economies.
4. 2013 Taper Tantrum
When the Fed signaled an end to QE, global markets panicked. Emerging market currencies crashed, and many central banks had to raise interest rates defensively.
5. COVID-19 Pandemic (2020–2022)
The Fed again cut rates to zero and launched massive QE, injecting trillions into the system. This stabilized markets but also fueled inflation globally.
6. Inflation and Rate Hikes (2022–2024)
As inflation surged to multi-decade highs, the Fed raised rates aggressively from near zero to over 5%. This had global consequences:
Borrowing costs rose worldwide.
Currencies like the Indian Rupee and Japanese Yen weakened.
Dollar-denominated debt in developing nations became more expensive.
Part IV: Global Interdependence of Interest Rates
1. Major Central Banks and Fed Influence
ECB (Eurozone): Often follows Fed moves but balances inflation with fragile growth in southern Europe.
BoJ (Japan): Maintains ultra-low rates due to deflationary pressures, but Fed hikes force it to intervene to protect the yen.
PBoC (China): Sets its own path but faces currency depreciation when the Fed tightens.
RBI (India): Often compelled to adjust policy to stabilize the rupee and control imported inflation when Fed acts.
2. Interest Rate Differentials
Investors exploit differences between U.S. and global rates through carry trades (borrowing in low-yielding currencies like yen, investing in higher-yielding assets). Fed policy shifts can reverse these flows quickly, destabilizing markets.
3. Debt Vulnerability
Many emerging nations borrow in U.S. dollars. When Fed hikes occur:
Dollar strengthens.
Debt servicing costs rise.
Sovereign default risks increase (e.g., Sri Lanka in 2022).
Part V: Current Global Dynamics (2024–2025 Context)
High U.S. Rates: As of 2025, Fed policy remains restrictive, keeping rates elevated to ensure inflation is under control.
Divergence Across Economies:
U.S. and Europe are tightening.
Japan is only slowly exiting negative interest rates.
Emerging markets are balancing between growth and inflation pressures.
Global Debt Stress: Record-high global debt (over $300 trillion) makes the world highly sensitive to Fed policy.
Dollar Liquidity Premium: With global uncertainty, investors continue to seek U.S. assets, reinforcing the Fed’s influence.
Part VI: Risks and Challenges
1. Inflation vs. Recession
The Fed’s challenge is to cool inflation without causing a deep recession. If it overtightens, global growth suffers.
2. Currency Wars
Countries may intervene in foreign exchange markets to protect competitiveness when the dollar strengthens.
3. Financial Stability
High rates can trigger bank collapses (as seen in Silicon Valley Bank 2023) and strain weaker economies.
4. Geopolitical Factors
Wars, trade tensions, and energy crises interact with Fed policy, complicating interest rate alignment globally.
Conclusion
The U.S. Federal Reserve’s policies are the anchor of the global financial system. Whether through rate hikes, cuts, or balance sheet operations, Fed decisions ripple across borders, influencing global interest rates, capital flows, exchange rates, and debt sustainability.
History shows that when the Fed tightens, global borrowing costs rise and emerging markets feel the pinch. When it loosens, liquidity floods the world, sometimes fueling bubbles.
As of 2025, the Fed’s balancing act between inflation control and economic stability continues to define the trajectory of global interest rates. For investors, policymakers, and businesses worldwide, keeping a close eye on the Fed is not optional—it is essential.

Wicky rangeSometimes the market just wants to test your patience, like this position of mine that got into trouble right after being triggered. It went into such a confusing range, with constant wicks, as if it was waiting for my entry just to hunt stops — and it’s been like this for almost 14 hours. But in the end, this is all part of the game. ✅

How to recognize the Fundamentals Support in a stock chart.Candlesticks are more than just a buy entry signal or a sell short entry signal. Candlesticks offer far more information such as where are the fundamentals of a company in relation to its stock price? The chart of AMZN shows the current level of fundamentals at this time which is within the outlined price level. AMZN is an excellent example of a company that is prospering during a time of rising tariffs and trade wars.
AMZN chart also show Buy Side "Support the Market" activity and quiet accumulation for much of this year. The steady rise of Accum/Dist is a pattern in the indicator that represents quiet accumulation over time.
Reminder: When Dark Pools are in accumulation mode they do not move price in huge price action. The candles will be small, uniform, and periodic. TWAP orders, Time Weighted at Average Price are used to set an automatic ping to buy when a stock falls below the fundamental level of a sideways trend. Fundamentals are always sideways trends.
If the stock moves beyond the high price set for the TWAP order, then the accumulation buying ping halts and waits.
Therefore, you can see the area where the majority of Dark Pool TWAP orders are buying and when the orders pause.
This is very useful information as Professional Independent Traders are monitoring the Dark Pool Buy Zone and will buy with the Dark Pools in anticipation that the liquidity draw is going to drive price upward suddenly as HFTs AI suddenly find the liquidity draw which occurs slowly over time, often several months.

International Payment Systems (SWIFT, CBDCs)Part I: The Evolution of International Payment Systems
1. The Early Days of Cross-Border Payments
Historically, cross-border payments were facilitated through:
Gold and Silver Settlements: Merchants exchanged precious metals, which were universally recognized as stores of value.
Bills of Exchange: Used in medieval trade, these paper instruments allowed merchants to settle accounts without moving physical assets.
Correspondent Banking: In the 19th and 20th centuries, banks built networks of correspondent relationships to settle payments across borders.
These methods were slow, costly, and prone to risks such as fraud, counterparty default, and political instability.
2. The Bretton Woods System and Beyond
After World War II, the Bretton Woods Agreement (1944) created the U.S. dollar–centric system, where the dollar was convertible into gold and became the dominant reserve currency. This system enhanced cross-border payments but still relied heavily on correspondent banks.
Following the collapse of Bretton Woods in 1971, fiat currencies began floating freely, further complicating international payments as exchange rate volatility increased.
3. The Rise of Electronic Payment Systems
The digital era of the late 20th century transformed payments:
CHIPS (Clearing House Interbank Payments System) in the U.S.
TARGET2 in Europe.
Fedwire for domestic U.S. transfers.
SWIFT, which emerged as the global financial messaging system connecting thousands of banks.
Part II: SWIFT – The Backbone of Global Financial Messaging
1. What is SWIFT?
Founded in 1973 and headquartered in Belgium, SWIFT (Society for Worldwide Interbank Financial Telecommunication) is not a payment system itself but a secure messaging network that enables banks and financial institutions worldwide to exchange standardized financial messages.
Key functions include:
Transmitting payment instructions (wire transfers, securities transactions, trade finance documents).
Enabling standardization through message formats (MT/MX messages).
Providing security with encrypted and authenticated communication channels.
2. How SWIFT Works
Participants: Over 11,000 institutions in 200+ countries.
Message Types: SWIFT MT (Message Type) and newer ISO 20022 MX formats.
Process:
A bank initiates a payment request via SWIFT.
The message is sent securely to the counterparty bank.
Actual fund settlement occurs separately through correspondent banking or clearing systems.
3. Why SWIFT Became Dominant
Global Reach: No other network connected as many banks worldwide.
Security: High encryption standards and authentication.
Neutrality: As a cooperative owned by member institutions, SWIFT is not tied to any single nation-state (though geopolitics complicates this claim).
Efficiency: Faster than telex, fax, or older systems.
4. SWIFT’s Economic and Political Significance
Handles millions of messages daily, representing trillions of dollars in transactions.
Acts as a gatekeeper of the international financial system.
Has been used as a tool of geopolitical leverage, with nations being excluded (e.g., Iran, Russia).
5. Limitations of SWIFT
Not instant: Settlement still depends on correspondent banking, which can take 2–5 days.
Expensive: Multiple intermediaries add costs (correspondent bank fees, FX spreads).
Opaque: Hard for individuals and small businesses to track payments in real time.
Geopolitical risk: Heavy influence from the U.S. and EU raises questions of neutrality.
Part III: Central Bank Digital Currencies (CBDCs) and the Future of Payments
1. What are CBDCs?
Central Bank Digital Currencies (CBDCs) are digital forms of sovereign money issued directly by central banks. Unlike cryptocurrencies (Bitcoin, Ethereum) or stablecoins (USDT, USDC), CBDCs are:
Legal tender, backed by the state.
Centralized, controlled by the central bank.
Stable in value, tied to fiat currencies.
CBDCs can be classified into:
Retail CBDCs: For use by the general public (e.g., digital yuan wallet).
Wholesale CBDCs: For interbank and institutional settlements.
2. Motivations for CBDC Development
Central banks globally are exploring CBDCs for reasons including:
Faster and cheaper payments (especially cross-border).
Financial inclusion for unbanked populations.
Reduced reliance on private intermediaries (Visa, Mastercard, SWIFT).
Geopolitical sovereignty (reducing dollar dependency).
Improved monetary policy tools (programmable money, negative rates).
3. CBDCs in Cross-Border Payments
CBDCs offer potential solutions to SWIFT’s limitations:
Instant settlement: Peer-to-peer transfers between central banks.
Lower cost: Eliminates correspondent banking layers.
Transparency: Real-time tracking of payments.
Programmability: Smart contracts for automated compliance.
4. Leading CBDC Projects Worldwide
China: Digital Yuan (e-CNY) already in pilot across multiple cities and tested for cross-border use.
Europe: The European Central Bank is developing a Digital Euro.
India: The Reserve Bank of India launched pilot programs for the Digital Rupee in 2022.
USA: The Federal Reserve is researching a Digital Dollar, though progress is slower.
Multi-CBDC Platforms: Projects like mBridge (BIS, China, UAE, Thailand, Hong Kong) aim to build interoperable cross-border CBDC networks.
Part IV: SWIFT vs. CBDCs – Collaboration or Competition?
1. Will CBDCs Replace SWIFT?
Possibility: If central banks interconnect CBDCs directly, the need for SWIFT messages may decline.
Reality: Transition will be slow; SWIFT’s vast network is difficult to replicate overnight.
2. SWIFT’s Response
SWIFT is experimenting with CBDC interoperability solutions, connecting multiple digital currencies through its network.
Focus on ISO 20022 standardization to ensure compatibility with CBDC systems.
Partnerships with central banks to ensure relevance in the digital era.
3. Coexistence Scenario
In the short to medium term, SWIFT and CBDCs may coexist:
SWIFT remains dominant for traditional bank-to-bank messaging.
CBDCs gain traction for specific corridors, especially in Asia and emerging markets.Part I: The Evolution of International Payment Systems
1. The Early Days of Cross-Border Payments
Historically, cross-border payments were facilitated through:
Gold and Silver Settlements: Merchants exchanged precious metals, which were universally recognized as stores of value.
Bills of Exchange: Used in medieval trade, these paper instruments allowed merchants to settle accounts without moving physical assets.
Correspondent Banking: In the 19th and 20th centuries, banks built networks of correspondent relationships to settle payments across borders.
These methods were slow, costly, and prone to risks such as fraud, counterparty default, and political instability.
2. The Bretton Woods System and Beyond
After World War II, the Bretton Woods Agreement (1944) created the U.S. dollar–centric system, where the dollar was convertible into gold and became the dominant reserve currency. This system enhanced cross-border payments but still relied heavily on correspondent banks.
Following the collapse of Bretton Woods in 1971, fiat currencies began floating freely, further complicating international payments as exchange rate volatility increased.
3. The Rise of Electronic Payment Systems
The digital era of the late 20th century transformed payments:
CHIPS (Clearing House Interbank Payments System) in the U.S.
TARGET2 in Europe.
Fedwire for domestic U.S. transfers.
SWIFT, which emerged as the global financial messaging system connecting thousands of banks.
Part II: SWIFT – The Backbone of Global Financial Messaging
1. What is SWIFT?
Founded in 1973 and headquartered in Belgium, SWIFT (Society for Worldwide Interbank Financial Telecommunication) is not a payment system itself but a secure messaging network that enables banks and financial institutions worldwide to exchange standardized financial messages.
Key functions include:
Transmitting payment instructions (wire transfers, securities transactions, trade finance documents).
Enabling standardization through message formats (MT/MX messages).
Providing security with encrypted and authenticated communication channels.
2. How SWIFT Works
Participants: Over 11,000 institutions in 200+ countries.
Message Types: SWIFT MT (Message Type) and newer ISO 20022 MX formats.
Process:
A bank initiates a payment request via SWIFT.
The message is sent securely to the counterparty bank.
Actual fund settlement occurs separately through correspondent banking or clearing systems.
3. Why SWIFT Became Dominant
Global Reach: No other network connected as many banks worldwide.
Security: High encryption standards and authentication.
Neutrality: As a cooperative owned by member institutions, SWIFT is not tied to any single nation-state (though geopolitics complicates this claim).
Efficiency: Faster than telex, fax, or older systems.
4. SWIFT’s Economic and Political Significance
Handles millions of messages daily, representing trillions of dollars in transactions.
Acts as a gatekeeper of the international financial system.
Has been used as a tool of geopolitical leverage, with nations being excluded (e.g., Iran, Russia).
5. Limitations of SWIFT
Not instant: Settlement still depends on correspondent banking, which can take 2–5 days.
Expensive: Multiple intermediaries add costs (correspondent bank fees, FX spreads).
Opaque: Hard for individuals and small businesses to track payments in real time.
Geopolitical risk: Heavy influence from the U.S. and EU raises questions of neutrality.
Part III: Central Bank Digital Currencies (CBDCs) and the Future of Payments
1. What are CBDCs?
Central Bank Digital Currencies (CBDCs) are digital forms of sovereign money issued directly by central banks. Unlike cryptocurrencies (Bitcoin, Ethereum) or stablecoins (USDT, USDC), CBDCs are:
Legal tender, backed by the state.
Centralized, controlled by the central bank.
Stable in value, tied to fiat currencies.
CBDCs can be classified into:
Retail CBDCs: For use by the general public (e.g., digital yuan wallet).
Wholesale CBDCs: For interbank and institutional settlements.
2. Motivations for CBDC Development
Central banks globally are exploring CBDCs for reasons including:
Faster and cheaper payments (especially cross-border).
Financial inclusion for unbanked populations.
Reduced reliance on private intermediaries (Visa, Mastercard, SWIFT).
Geopolitical sovereignty (reducing dollar dependency).
Improved monetary policy tools (programmable money, negative rates).
3. CBDCs in Cross-Border Payments
CBDCs offer potential solutions to SWIFT’s limitations:
Instant settlement: Peer-to-peer transfers between central banks.
Lower cost: Eliminates correspondent banking layers.
Transparency: Real-time tracking of payments.
Programmability: Smart contracts for automated compliance.
4. Leading CBDC Projects Worldwide
China: Digital Yuan (e-CNY) already in pilot across multiple cities and tested for cross-border use.
Europe: The European Central Bank is developing a Digital Euro.
India: The Reserve Bank of India launched pilot programs for the Digital Rupee in 2022.
USA: The Federal Reserve is researching a Digital Dollar, though progress is slower.
Multi-CBDC Platforms: Projects like mBridge (BIS, China, UAE, Thailand, Hong Kong) aim to build interoperable cross-border CBDC networks.
Part IV: SWIFT vs. CBDCs – Collaboration or Competition?
1. Will CBDCs Replace SWIFT?
Possibility: If central banks interconnect CBDCs directly, the need for SWIFT messages may decline.
Reality: Transition will be slow; SWIFT’s vast network is difficult to replicate overnight.
2. SWIFT’s Response
SWIFT is experimenting with CBDC interoperability solutions, connecting multiple digital currencies through its network.
Focus on ISO 20022 standardization to ensure compatibility with CBDC systems.
Partnerships with central banks to ensure relevance in the digital era.
3. Coexistence Scenario
In the short to medium term, SWIFT and CBDCs may coexist:
SWIFT remains dominant for traditional bank-to-bank messaging.
CBDCs gain traction for specific corridors, especially in Asia and emerging markets.
Part V: Risks, Challenges, and Opportunities
1. Risks of CBDCs
Privacy concerns: Central banks could track every transaction.
Cybersecurity threats: Centralized systems are high-value hacking targets.
Financial disintermediation: Banks may lose deposits if individuals prefer CBDCs.
Geopolitical fragmentation: Competing CBDC blocs (U.S.-led vs China-led) could split the financial system.
2. Risks of SWIFT
Sanctions weaponization undermines neutrality.
Inefficiency relative to new technologies.
Exposure to cyberattacks (e.g., Bangladesh Bank heist in 2016).
3. Opportunities
For SWIFT: Remain the global connector by facilitating CBDC interoperability.
For CBDCs: Create a more inclusive, efficient, and sovereign financial system.
For Businesses and Consumers: Faster remittances, lower costs, better transparency.
Conclusion
International payment systems are undergoing one of the most profound transformations since the Bretton Woods era. SWIFT, the dominant global financial messaging system for decades, remains crucial but faces challenges from new technologies and shifting geopolitics. Meanwhile, CBDCs represent both an opportunity and a threat—promising faster, cheaper, and more sovereign payment infrastructures but also raising risks of fragmentation, surveillance, and competition.
The likely future is not a complete replacement of SWIFT by CBDCs, but rather a hybrid system where SWIFT evolves to act as an interoperability layer while CBDCs gain prominence in specific cross-border corridors.
Ultimately, the future of international payments will depend not only on technological innovation but also on political will, global cooperation, and the balance of power among major economies. The contest between SWIFT and CBDCs is not just about efficiency—it is about who controls the financial arteries of the 21st-century global economy.
Shipping, Freight, and Logistics Trading (Baltic Index)1. Foundations of Global Shipping and Freight
1.1 The Role of Shipping in Global Trade
Shipping is the engine of globalization. Over 80% of international trade by volume is carried by sea. Ships transport crude oil, natural gas, coal, iron ore, grains, fertilizers, automobiles, and countless other goods.
Without shipping, modern trade would collapse. It provides:
Cost efficiency: Shipping is the cheapest way to transport large quantities over long distances.
Accessibility: Oceans cover 70% of the earth, linking producers and consumers across continents.
Flexibility: Different vessel types (tankers, bulk carriers, container ships, LNG carriers) handle specific cargo needs.
1.2 Freight: The Price of Shipping
In simple terms, freight is the cost of transporting cargo from one point to another. Freight rates vary depending on:
Type of cargo (dry bulk, liquid, containerized)
Distance and route (short haul vs. long haul)
Vessel size and availability
Market conditions (supply of ships vs. demand for goods)
Freight costs are crucial because they directly affect commodity prices, corporate profits, and inflation worldwide.
1.3 Logistics and Its Broader Scope
While shipping focuses on transport, logistics covers the entire chain: storage, warehousing, customs clearance, last-mile delivery, and supply chain management. Logistics companies such as Maersk, DHL, FedEx, and MSC coordinate multi-modal transport systems that integrate shipping, trucking, rail, and air.
2. The Baltic Exchange and Baltic Index
2.1 History of the Baltic Exchange
The Baltic Exchange is a London-based institution founded in the mid-18th century. Initially, it provided a marketplace for shipowners and merchants to negotiate contracts. Today, it is the world’s leading source of maritime market information, freight assessments, and shipping benchmarks.
2.2 What is the Baltic Dry Index (BDI)?
The BDI is a composite index that tracks the cost of transporting raw materials by sea, specifically dry bulk commodities such as:
Iron ore
Coal
Grains (wheat, corn, soybeans)
Bauxite, alumina, and other minerals
It is published daily by the Baltic Exchange and reflects the average of freight rates on major shipping routes worldwide.
2.3 How the BDI is Calculated
The index is derived from assessments of freight brokers who provide daily estimates of charter rates for different ship sizes. It combines data from four main dry bulk carrier classes:
Capesize (largest ships, mainly carrying iron ore & coal, 150,000+ DWT)
Panamax (medium size, often for coal & grain, 60,000–80,000 DWT)
Supramax (40,000–60,000 DWT, flexible routes & cargoes)
Handysize (smaller vessels, 10,000–40,000 DWT, short routes, regional trade)
The weighted average of these daily rates produces the BDI value.
2.4 Why is the BDI Important?
Economic Indicator: It is considered a leading indicator of global trade activity. Rising BDI suggests strong demand for raw materials and growth, while falling BDI indicates slowing trade.
Price Benchmark: Used by miners, steelmakers, traders, and shipping companies to negotiate contracts.
Financial Market Tool: Hedge funds, analysts, and investors watch the BDI to forecast commodity cycles and global GDP trends.
3. The Economics of Freight Markets
3.1 Supply Side: The Shipping Fleet
The supply of vessels is relatively inelastic in the short term. It takes 2–3 years to build new ships, so when demand spikes, freight rates can rise sharply. Conversely, during downturns, excess ships push rates lower.
3.2 Demand Side: Global Commodity Trade
Demand for shipping depends on global consumption of raw materials:
China’s steel production drives iron ore imports.
Power plants drive coal shipments.
Food security drives grain exports from the US, Brazil, and Ukraine.
3.3 Freight Rate Cycles
The shipping industry is notoriously cyclical:
Boom: High demand, limited supply → skyrocketing freight rates.
Bust: Overbuilding of ships, economic slowdown → rates collapse.
This volatility makes freight trading attractive but risky.
4. Trading and Investment Using the Baltic Index
4.1 Physical Shipping Contracts
Shipowners lease vessels to charterers (traders, miners, commodity houses) through:
Voyage Charter: Hire for a single trip.
Time Charter: Hire for a specific time period.
Bareboat Charter: Hire vessel without crew/equipment.
Freight rates are negotiated based on BDI benchmarks.
4.2 Freight Derivatives and Forward Freight Agreements (FFAs)
To manage volatility, traders use FFAs, financial contracts that lock in freight rates for future dates.
Example: A steelmaker importing iron ore may buy FFAs to hedge against rising shipping costs.
Speculators also trade FFAs purely for profit, betting on future freight movements.
4.3 ETFs and Shipping Stocks
Investors gain exposure to freight and shipping through:
Shipping company stocks (Maersk, Cosco, Hapag-Lloyd, Frontline)
Exchange-traded funds (ETFs) that track shipping indices
Commodities like iron ore, coal, and grains, which correlate with freight rates
4.4 Role of Banks and Hedge Funds
Financial institutions use the BDI for forecasting, asset allocation, and even as a proxy for inflation and GDP. Hedge funds trade freight derivatives to profit from global trade cycles.
5. Logistics and Supply Chain Dynamics
5.1 Container Shipping vs. Bulk Shipping
Container Shipping: Handles manufactured goods (electronics, clothing, cars). Measured in TEUs (Twenty-foot Equivalent Units). Freight benchmark = Shanghai Containerized Freight Index (SCFI).
Bulk Shipping: Handles raw commodities (ore, coal, grain). Benchmark = BDI.
5.2 Supply Chain Bottlenecks
Events like the COVID-19 pandemic and Suez Canal blockage (2021) highlighted vulnerabilities:
Congested ports delayed shipments.
Container shortages raised freight prices.
Geopolitical tensions (Russia-Ukraine war) disrupted grain and oil transport.
5.3 Role of Technology
Digital platforms, blockchain, and AI are transforming logistics:
Real-time cargo tracking
Smart contracts for freight payments
Automated port operations
6. Case Studies
6.1 The 2008 Shipping Boom and Bust
Pre-2008: China’s rapid industrial growth caused freight rates to skyrocket (BDI hit 11,793 points in May 2008).
Post-2008: Global financial crisis slashed demand; oversupply of ships led to a crash (BDI dropped below 700 points in late 2008).
6.2 COVID-19 Pandemic
Early 2020: Demand collapsed, ships idled, freight rates fell.
Mid-2020 onward: Recovery + container shortages led to record high container freight prices.
6.3 Russia-Ukraine War (2022)
Disrupted Black Sea grain exports.
Increased insurance costs for vessels in conflict zones.
Re-routed trade flows reshaped freight markets.
Conclusion
Shipping, freight, and logistics are the hidden arteries of global trade. The Baltic Dry Index (BDI) stands as a critical barometer of world economic health, linking shipping costs to broader market cycles. Traders, investors, and policymakers watch it closely to gauge demand for raw materials, predict inflation, and assess the global growth outlook.
While the industry faces volatility, geopolitical risks, and environmental pressures, it is also entering a period of transformation driven by decarbonization, digitalization, and new trade patterns.
For anyone interested in global markets—whether a trader, economist, or policy planner—the Baltic Index remains one of the most powerful yet underappreciated indicators of where the world economy is heading.
Global Market Foundations1. Historical Evolution of Global Markets
Early Trade Systems
The roots of global markets can be traced back thousands of years to barter-based exchanges and regional trade. Ancient civilizations like Mesopotamia, Egypt, China, and the Indus Valley engaged in trade using goods such as grain, spices, textiles, and metals. Over time, currencies in the form of coins and later paper money simplified transactions.
Silk Road and Maritime Trade
Between the 2nd century BCE and the 15th century CE, the Silk Road connected Asia, the Middle East, and Europe. This network facilitated not just goods but also culture, ideas, and technologies. Maritime trade routes across the Indian Ocean and Mediterranean further accelerated cross-border exchange.
Colonial Era and Mercantilism
The Age of Exploration (15th–18th centuries) brought about European colonization, global trade in spices, cotton, and precious metals, and unfortunately, also the slave trade. The mercantilist philosophy—where nations aimed to accumulate wealth through exports and restricted imports—dominated global markets.
Industrial Revolution
The Industrial Revolution in the 18th and 19th centuries transformed global markets with mass production, mechanization, and steam-powered transport. This era witnessed the rise of global corporations, banking systems, and stock exchanges.
20th Century and Globalization
The 20th century saw the establishment of critical global institutions like the International Monetary Fund (IMF), World Bank, and later the World Trade Organization (WTO). The Bretton Woods system established a framework for currency exchange and stability. Post-1990s, globalization intensified with liberalized trade policies, financial deregulation, and technological innovation.
2. Core Components of Global Markets
Goods and Services Trade
The most visible aspect of global markets is the exchange of goods and services. Countries specialize in what they produce efficiently and trade for what they lack. For example, Saudi Arabia exports oil, while South Korea exports electronics.
Financial Markets
Financial markets provide the infrastructure for raising capital, trading securities, and managing risk. They include:
Equity markets (stock exchanges like NYSE, NSE, LSE)
Bond markets (government and corporate debt instruments)
Derivatives markets (futures, options, swaps)
Foreign exchange (Forex) markets (largest by volume globally)
Capital Flows
Investment across borders, including Foreign Direct Investment (FDI) and portfolio investment, forms a crucial foundation of global markets. Companies establish subsidiaries abroad while investors allocate funds to international assets.
Labor Mobility
Though limited compared to capital, the migration of skilled and unskilled labor plays a role in global markets. For instance, remittances from migrant workers significantly support economies like the Philippines, Mexico, and India.
Digital and Technology-Driven Markets
Today, e-commerce platforms, fintech solutions, and digital currencies like Bitcoin represent new dimensions of global markets. Technology has reduced transaction costs and barriers to entry.
3. Institutions Supporting Global Markets
International Monetary Fund (IMF)
Provides short-term financial assistance to countries facing balance-of-payment crises and advises on economic reforms.
World Bank
Focuses on long-term development projects, poverty alleviation, and infrastructure funding.
World Trade Organization (WTO)
Regulates international trade by providing dispute resolution and enforcing agreements to ensure free and fair trade.
Central Banks
Institutions like the U.S. Federal Reserve, European Central Bank, and Reserve Bank of India influence monetary policy, interest rates, and liquidity that impact global capital flows.
Multinational Corporations (MNCs)
Companies like Apple, Toyota, and Nestlé drive cross-border trade, investment, and cultural integration. They represent both opportunities and challenges in terms of competition and regulation.
4. Principles and Theories Underpinning Global Markets
Comparative Advantage
Proposed by David Ricardo, this principle states that nations benefit by specializing in goods they can produce relatively efficiently and trading for others.
Supply and Demand
The universal law of supply and demand governs price discovery in all global markets—whether for oil, wheat, or currencies.
Market Efficiency
Efficient Market Hypothesis (EMH) suggests that asset prices reflect all available information, though real-world evidence shows markets can be irrational at times.
Risk and Return
Investors allocate capital globally based on risk-return trade-offs, diversification benefits, and hedging strategies.
5. Drivers of Global Markets
Globalization
Integration of economies through trade, investment, and culture increases interdependence.
Technology
From telegraph and container shipping to blockchain and AI, technology has always shaped the speed and efficiency of global markets.
Policy and Regulation
Trade agreements (NAFTA, EU, ASEAN), tariffs, and sanctions influence the flow of goods and capital.
Energy and Natural Resources
Oil, gas, and minerals remain critical drivers of global trade and geopolitics.
Geopolitics
Wars, sanctions, and alliances impact supply chains, commodity prices, and investor confidence.
6. Risks in Global Markets
Economic Risks
Recessions, inflation, unemployment.
Currency volatility and capital flight.
Political Risks
Instability, protectionism, and trade wars.
Financial Risks
Market bubbles, banking crises, and debt defaults.
Environmental Risks
Climate change, natural disasters, and sustainability challenges.
Technological Risks
Cybersecurity threats, digital fraud, and over-dependence on AI.
The Future of Global Markets
Sustainability and ESG Investing
Environmental, Social, and Governance (ESG) principles are increasingly shaping investment decisions.
Digital Transformation
Fintech, blockchain, AI-driven trading, and Central Bank Digital Currencies (CBDCs) will redefine financial markets.
Regionalization vs. Globalization
While globalization remains strong, supply chain disruptions are pushing nations toward regional alliances.
Inclusive Growth
The future of global markets will depend on addressing inequality, ensuring fair trade, and supporting developing economies.
Conclusion
The foundations of the global market are built on centuries of trade, innovation, and institutional development. They rest upon principles like comparative advantage, risk management, and technological adoption, but they also face challenges from geopolitics, economic volatility, and environmental concerns.
For businesses, investors, and nations, understanding these foundations is not just academic—it is practical. Decisions about trade policy, investment strategy, and resource allocation depend on recognizing the forces that shape global markets.
As the world enters an era defined by digital transformation, sustainability, and geopolitical shifts, the global market will continue to evolve. Its foundations, however, remain rooted in human interdependence—the shared desire to exchange value, ideas, and opportunities across borders.

US-China Trade War: Causes, Impacts, and Global ImplicationsHistorical Context of U.S.-China Economic Relations
Early Engagement
The United States normalized relations with China in 1979, following Deng Xiaoping’s reforms and China’s opening up to global markets.
Over the next three decades, U.S. companies moved manufacturing to China to take advantage of cheap labor and efficient supply chains.
China, in turn, gained access to advanced technologies, investment capital, and export markets.
Entry into the World Trade Organization (WTO)
In 2001, China’s entry into the WTO was a turning point. It marked its deeper integration into the global economy.
China rapidly grew into the “world’s factory,” and its exports surged.
However, the U.S. and other Western nations accused China of unfair practices: state subsidies, currency manipulation, forced technology transfers, and weak intellectual property protections.
The Growing Trade Imbalance
By the 2010s, the U.S. trade deficit with China exceeded $300 billion annually.
American policymakers began questioning whether trade with China was truly beneficial, especially as U.S. manufacturing jobs declined.
These tensions set the stage for a conflict that was as much about economics as it was about strategic rivalry.
The Outbreak of the Trade War (2018–2019)
Trump Administration’s Policies
In 2017, U.S. President Donald Trump labeled China as a “trade cheater,” accusing it of unfair practices.
By 2018, the U.S. imposed tariffs on steel, aluminum, and billions of dollars’ worth of Chinese goods.
China retaliated with tariffs on U.S. agricultural products, automobiles, and energy.
Escalation
By mid-2019, the U.S. had imposed tariffs on over $360 billion worth of Chinese imports, while China hit back with tariffs on $110 billion of U.S. goods.
The dispute extended beyond tariffs: restrictions were placed on Chinese technology firms like Huawei and ZTE.
Phase One Deal (2020)
After months of negotiations, the U.S. and China signed a “Phase One” trade deal in January 2020.
China pledged to purchase an additional $200 billion worth of U.S. goods and services over two years.
The deal addressed some issues like intellectual property and financial market access but left most tariffs in place.
Core Issues Driving the Trade War
Trade Imbalance
The U.S. imports far more from China than it exports, leading to a massive trade deficit.
While economists argue deficits are not inherently bad, politically they became a symbol of “unfairness.”
Intellectual Property (IP) Theft
American firms accused Chinese companies of copying technology and benefiting from weak IP protections.
Forced technology transfers—where U.S. firms had to share technology with Chinese partners as a condition for market entry—were a major point of contention.
State Subsidies and Industrial Policy
China’s state-driven model, including its “Made in China 2025” plan, aimed to dominate advanced industries like AI, robotics, and semiconductors.
The U.S. viewed this as a threat to its technological leadership.
National Security Concerns
The U.S. raised alarms over Chinese companies’ ties to the Communist Party, particularly in sectors like 5G, AI, and cybersecurity.
Huawei became a focal point, with Washington warning allies against using its equipment.
Geopolitical Rivalry
The trade war is also a battle for global leadership.
China’s rise threatens the U.S.-led order, prompting Washington to adopt a more confrontational stance.
Economic Impacts of the Trade War
On the United States
Consumers: Tariffs increased prices of everyday goods, from electronics to clothing, hurting U.S. households.
Farmers: China imposed tariffs on soybeans, pork, and other agricultural products, devastating American farmers who depended on Chinese markets.
Manufacturers: U.S. firms reliant on Chinese supply chains faced higher input costs.
GDP Impact: Estimates suggest the trade war reduced U.S. GDP growth by 0.3–0.5 percentage points annually.
On China
Export Decline: Chinese exports to the U.S. fell sharply, pushing firms to seek new markets.
Economic Slowdown: Growth dipped from above 6% to below 6%—the lowest in decades.
Technology Restrictions: Huawei and other tech giants faced disruptions in accessing U.S. chips and software.
Resilience: Despite the tariffs, China remained competitive due to diversified global markets and strong domestic consumption.
On the Global Economy
Supply Chains: The trade war disrupted global supply chains, prompting companies to diversify into countries like Vietnam, India, and Mexico.
Global Trade Growth: The WTO reported global trade growth slowed significantly in 2019 due to tensions.
Uncertainty: Businesses worldwide delayed investments amid fears of escalating tariffs and restrictions.
The Role of Technology and Decoupling
The trade war expanded into a tech war, especially in semiconductors, AI, and 5G.
Huawei Ban: The U.S. restricted Huawei from buying American components, pressuring allies to exclude Huawei from 5G networks.
Semiconductors: The U.S. tightened export controls on advanced chips, aiming to slow China’s technological rise.
Decoupling: Both nations began reducing dependency on each other, with companies shifting supply chains and governments investing in domestic industries.
This technological rivalry is often seen as the most critical and long-lasting element of the U.S.-China conflict.
Political Dimensions of the Trade War
Domestic Politics in the U.S.
The trade war became central to Trump’s political messaging, appealing to voters frustrated by globalization.
While tariffs hurt some sectors, they gained support among those seeking a tough stance on China.
Domestic Politics in China
China framed the trade war as foreign bullying, rallying nationalist sentiment.
The Communist Party emphasized self-reliance and doubled down on domestic technological innovation.
International Politics
Allies were caught in the middle:
Europe opposed Chinese trade practices but resisted U.S. pressure to take sides.
Developing nations saw opportunities as supply chains shifted.
COVID-19 and the Trade War
The pandemic, which began in China in late 2019, further complicated the trade war.
Supply Chain Shocks: COVID-19 highlighted global dependency on Chinese manufacturing for medical supplies, electronics, and more.
Geopolitical Blame: The U.S. accused China of mishandling the pandemic, worsening tensions.
Phase One Deal Collapse: China struggled to meet its purchase commitments due to the global recession.
In many ways, COVID-19 deepened the push toward decoupling and reshaping global trade patterns.
Global Implications of the US-China Trade War
Restructuring of Global Supply Chains
Companies are diversifying production away from China to reduce risks.
Southeast Asia, India, and Latin America are emerging as alternative hubs.
Impact on Global Institutions
The WTO struggled to mediate, highlighting weaknesses in the global trade system.
Calls for reforming trade rules to address issues like subsidies and digital trade gained momentum.
Pressure on Other Countries
Nations are forced to align with either the U.S. or China on issues like 5G, data security, and AI.
Middle powers like the EU, Japan, and Australia face tough choices in balancing relations.
Global Economic Slowdown
The IMF repeatedly warned that trade tensions could shave trillions off global GDP.
Slower global trade affects everything from commodity prices to investment flows.
Long-Term Outlook: Is the Trade War the New Normal?
The U.S.-China trade war represents more than a dispute over tariffs. It reflects a structural shift in global power dynamics.
Competition vs. Cooperation: While both countries remain economically interdependent, trust has eroded.
Persistent Rivalry: The Biden administration has largely continued Trump-era tariffs, indicating bipartisan consensus on confronting China.
Technology Cold War: The battle for dominance in semiconductors, AI, and 5G is set to intensify.
Partial Decoupling: Complete separation is unlikely, but critical sectors like technology, defense, and energy may increasingly operate in parallel ecosystems.
Conclusion
The U.S.-China trade war is one of the defining geopolitical and economic conflicts of the 21st century. What began as a tariff battle has evolved into a comprehensive strategic rivalry, encompassing trade, technology, national security, and global influence.
Both nations have paid economic costs, but the deeper impact lies in the reshaping of the global economy. Supply chains are being reorganized, trade institutions are under pressure, and countries around the world are recalibrating their positions between two superpowers.
Whether the future brings renewed cooperation or deepening confrontation depends on political will, economic necessity, and the evolving balance of power. What is clear, however, is that the trade war has fundamentally altered the trajectory of globalization and set the stage for decades of U.S.-China competition.
Opportunities and Risks in Global MarketsSection 1: Opportunities in Global Markets
1.1 Expansion of International Trade
The lowering of trade barriers and rise of free-trade agreements have created enormous opportunities for companies to reach international consumers. Businesses can:
Diversify revenue sources beyond their domestic markets.
Scale production with access to global demand.
Benefit from competitive advantages like cheaper labor or raw materials in different regions.
For example, Asian electronics manufacturers sell across North America and Europe, while African agricultural producers tap into Middle Eastern and Asian demand.
1.2 Access to Capital Markets
Globalization has enabled firms to tap into international capital markets for funding. Companies can raise money through cross-border IPOs, bond issuances, and venture capital flows. Investors, in turn, gain exposure to high-growth markets like India, Africa, and Southeast Asia.
This cross-border capital flow:
Improves liquidity.
Reduces financing costs.
Helps small and medium enterprises (SMEs) scale faster.
1.3 Technological Innovation and Digital Markets
Technology is perhaps the biggest driver of modern opportunities:
E-commerce platforms like Amazon, Alibaba, and Flipkart have made global consumer bases accessible.
Fintech solutions such as digital payments, blockchain, and decentralized finance (DeFi) have transformed financial inclusion.
Artificial Intelligence (AI) and data analytics allow companies to forecast demand, optimize supply chains, and personalize customer experiences.
Digital markets also open up remote work opportunities, enabling firms to access global talent at lower costs.
1.4 Emerging Market Growth
Emerging economies such as India, Vietnam, Nigeria, and Brazil present massive opportunities due to:
Rising middle-class populations.
Expanding digital infrastructure.
Government reforms promoting business and investment.
These markets often offer higher returns compared to saturated developed economies, though with higher volatility.
1.5 Supply Chain Diversification
Globalization allows firms to diversify production bases. Instead of relying on a single country (e.g., China), companies are adopting a “China + 1” strategy by investing in Vietnam, India, or Mexico. This reduces risks while taking advantage of cost efficiency and new markets.
1.6 Sustainable and Green Finance
The transition to clean energy and sustainability has created a trillion-dollar opportunity. Investors and companies are increasingly focused on:
Renewable energy projects (solar, wind, hydrogen).
Carbon trading markets.
Sustainable investment funds (ESG-focused).
The global push toward net-zero emissions offers growth in sectors like electric vehicles, energy storage, and recycling technologies.
1.7 Cultural Exchange and Global Branding
Brands that succeed globally (Apple, Coca-Cola, Nike, Samsung) benefit from cultural globalization. A global presence not only increases revenues but also strengthens brand equity. Local firms can also “go global” by leveraging cultural exports (e.g., K-pop, Bollywood, anime).
Section 2: Risks in Global Markets
2.1 Economic Risks
Recession and Slowdowns: Global interconnectedness means downturns in one major economy ripple across the world (e.g., the 2008 financial crisis, COVID-19 pandemic).
Currency Volatility: Exchange rate fluctuations can erode profits in cross-border transactions. For instance, a strong U.S. dollar hurts emerging markets with dollar-denominated debt.
Inflation Pressures: Global commodity price spikes (oil, food) affect inflation, reducing purchasing power.
2.2 Geopolitical Risks
Geopolitics plays a decisive role in shaping market risks:
Trade wars (U.S.-China tariffs) disrupt global supply chains.
Sanctions on countries like Russia or Iran limit market access.
Military conflicts destabilize entire regions, raising commodity prices (e.g., oil during Middle East crises).
Nationalism and protectionism are reversing decades of globalization, creating uncertainty for investors.
2.3 Regulatory and Legal Risks
Differences in tax laws, intellectual property rights, and compliance frameworks create legal complexities.
Sudden regulatory changes—like India banning certain apps, or the EU imposing strict data privacy laws (GDPR)—can disrupt global operations.
2.4 Financial Market Volatility
Global markets are vulnerable to shocks from:
Speculative bubbles in stocks, bonds, or cryptocurrencies.
Interest rate hikes by central banks (like the U.S. Federal Reserve), which trigger global capital outflows from emerging markets.
Banking crises, which undermine investor confidence.
2.5 Technological Risks
While technology creates opportunities, it also brings risks:
Cybersecurity threats: Global firms are increasingly targets of hacking, ransomware, and data breaches.
Digital monopolies: A few tech giants dominate markets, creating anti-competitive concerns.
Automation risks: Job displacement caused by robotics and AI could destabilize labor markets.
2.6 Environmental and Climate Risks
Climate change disrupts agricultural production, supply chains, and insurance markets.
Extreme weather events damage infrastructure and raise commodity prices.
Firms face carbon taxation and regulatory costs in transitioning toward sustainability.
2.7 Social and Cultural Risks
Cultural misalignment: Global firms sometimes fail to adapt products to local preferences (e.g., Walmart’s exit from Germany).
Inequality: Globalization can widen the gap between rich and poor, fueling social unrest.
Demographics: Aging populations in developed economies (Japan, Europe) create labor shortages and higher social costs.
Section 3: Balancing Opportunities and Risks
To succeed in global markets, businesses and investors must adopt strategies that maximize opportunities while managing risks.
3.1 Risk Management Strategies
Hedging: Using derivatives to protect against currency and commodity risks.
Diversification: Investing in multiple markets and asset classes to spread risk.
Scenario Planning: Preparing for political, economic, and technological disruptions.
Local Partnerships: Collaborating with local firms to navigate regulations and cultural differences.
3.2 Role of Governments and Institutions
Global governance bodies like WTO, IMF, and World Bank ensure smoother trade and financial stability.
Central banks influence global capital flows through monetary policies.
Regional trade blocs (EU, ASEAN, NAFTA) create stability and cooperation.
3.3 Technological Adaptation
Firms must invest in cybersecurity to safeguard against digital risks.
Adoption of AI and automation should balance efficiency with social responsibility.
Data compliance is essential in markets with strict privacy laws.
3.4 Sustainability as a Competitive Edge
Firms that embrace ESG (Environmental, Social, Governance) principles not only mitigate regulatory risks but also attract investors. Green finance, circular economy practices, and carbon neutrality commitments enhance long-term profitability.
Section 4: Future Outlook
The global market of the next decade will be shaped by megatrends:
Shift of economic power to Asia and Africa – China, India, and Africa will drive consumption growth.
Digital economy dominance – AI, blockchain, metaverse, and fintech will redefine global commerce.
Climate transition economy – Renewable energy, carbon markets, and sustainable finance will become mainstream.
Geopolitical fragmentation – Competing power blocs may create parallel financial and trade systems.
Hybrid supply chains – “Friend-shoring” and regionalization will coexist with globalization.
The winners will be firms and investors who are adaptive, diversified, and innovative.
Conclusion
The global market is a double-edged sword—full of unprecedented opportunities but also fraught with significant risks. Opportunities arise from trade liberalization, digital transformation, emerging markets, and sustainability, while risks emerge from volatility, geopolitical conflicts, regulatory challenges, and climate change.
Ultimately, success in the global marketplace depends on the ability to balance opportunity with risk management. Companies, investors, and governments must act with foresight, agility, and resilience to navigate this ever-changing landscape.
In a hyper-connected world, those who can adapt to technological, economic, and geopolitical shifts will thrive, while those who remain rigid may struggle. Global markets are not just about chasing profits; they are about building sustainable, resilient systems that create long-term value.

ESG Investing & Green FinancePart I: Understanding ESG Investing
1. What is ESG?
ESG stands for Environmental, Social, and Governance. It is a framework used by investors to evaluate companies not just on financial performance, but also on how they manage sustainability, ethics, and accountability.
Environmental (E): Measures a company’s impact on the planet—carbon emissions, energy use, waste management, renewable energy adoption, water conservation, pollution control, etc.
Social (S): Assesses how a company treats people—its employees, customers, suppliers, and communities. Issues like labor rights, workplace diversity, data privacy, and community engagement fall here.
Governance (G): Evaluates how a company is managed—board diversity, executive pay, shareholder rights, transparency, anti-corruption policies, etc.
2. Origins of ESG Investing
The roots of ESG investing can be traced back to:
1960s–1970s: Socially Responsible Investing (SRI) emerged. Religious groups and ethical investors avoided companies linked to alcohol, tobacco, gambling, and weapons.
1980s–1990s: Activist investors started pressuring firms on issues like apartheid in South Africa. Many divested from companies operating there.
2000s: Climate change awareness grew, leading to greater focus on corporate environmental performance.
2015 onwards: The Paris Agreement, UN Sustainable Development Goals (SDGs), and growing public concern about climate change propelled ESG to mainstream finance.
3. ESG Investing vs. Traditional Investing
Aspect Traditional Investing ESG Investing
Focus Profit, ROI, growth Profit + sustainability + ethics
Metrics EPS, P/E ratio, ROE ESG scores + financial metrics
Time Horizon Short-to-medium term Long-term resilience
Risk Market risk, credit risk Market + climate + reputational risks
Part II: Key Drivers of ESG Investing
Climate Change and Sustainability Concerns
Rising global temperatures, extreme weather, and natural disasters highlight the risks of ignoring climate change.
Companies that fail to adapt may face legal, regulatory, and reputational risks.
Investor Demand
Millennials and Gen Z, who are more socially conscious, prefer investing in sustainable companies.
ESG-focused mutual funds and ETFs have seen record inflows.
Regulatory Pressure
Governments are mandating climate disclosures. For example, the EU’s Sustainable Finance Disclosure Regulation (SFDR) requires funds to disclose ESG risks.
Corporate Performance Data
Studies show that ESG-aligned companies often outperform peers in the long run due to lower risks, better brand image, and operational efficiency.
Part III: ESG Metrics and Ratings
1. ESG Rating Agencies
Several organizations provide ESG scores to companies, including:
MSCI ESG Ratings
Sustainalytics
Refinitiv
Bloomberg ESG Scores
Each agency uses different criteria, making ESG ratings inconsistent at times. For example, Tesla scores high on environment due to EV leadership, but lower on governance issues.
2. Key Metrics
Carbon emissions (CO2e per unit revenue)
Percentage of renewable energy use
Diversity of board and management
Employee turnover and satisfaction
Transparency in financial reporting
Part IV: Green Finance
1. What is Green Finance?
Green finance refers to financial activities, investments, and instruments specifically designed to support environmentally sustainable projects. Unlike ESG, which is broad, green finance is narrower and directly focused on environmental impact.
Examples include:
Green Bonds (funds raised for renewable energy, clean transport, or sustainable water projects).
Climate Funds (investments in climate change mitigation/adaptation).
Sustainable Loans (corporate loans linked to sustainability targets).
2. Evolution of Green Finance
2007: The European Investment Bank issued the first green bond.
2015: The Paris Climate Agreement boosted funding for green projects.
Today: Green finance is a $2 trillion+ market, with rapid growth in Asia, Europe, and North America.
3. Green Finance vs. ESG Investing
Aspect Green Finance ESG Investing
Scope Narrow (environmental projects only) Broad (environment, social, governance)
Instruments Green bonds, loans, climate funds ESG funds, ETFs, stocks
Purpose Financing climate-friendly initiatives Screening and investing in sustainable companies
Part V: Examples and Case Studies
1. Tesla Inc. (Environment & Social Impact)
Pros: Market leader in EVs, promotes clean energy, reduces carbon dependency.
Cons: Criticism on governance (CEO dominance, workplace safety, and labor issues).
2. Unilever (ESG Leader)
Pioneered Sustainable Living Brands initiative.
Invested heavily in eco-friendly packaging, supply chain ethics, and community programs.
3. Apple Inc.
Committed to becoming carbon neutral by 2030.
Invests in renewable energy for data centers and supply chain sustainability.
4. Green Bonds by Governments
India: Issued sovereign green bonds to finance solar and wind energy.
China: One of the largest issuers of green bonds globally.
EU: Launched “NextGenerationEU” recovery fund with a strong green finance focus.
Part VI: Benefits of ESG & Green Finance
Risk Mitigation – Companies with strong ESG practices face fewer legal and reputational risks.
Long-Term Value Creation – Sustainable companies build resilience against climate and market shocks.
Better Investor Returns – ESG funds often outperform benchmarks over long horizons.
Positive Brand Image – Firms adopting ESG gain consumer trust and loyalty.
Access to Capital – Green finance instruments often come with lower borrowing costs.
Conclusion
ESG investing and green finance are not just trends—they are reshaping global financial markets. By embedding environmental, social, and governance considerations into investment decisions, stakeholders can drive capital towards sustainable and ethical businesses.
While challenges like greenwashing and lack of standardization remain, the direction is clear: the future of finance will be green, responsible, and impact-driven.
Investors, policymakers, and companies who embrace this shift early are likely to reap long-term benefits—not just in profits, but in contributing to a more sustainable planet.

Volume Profile Explained with Application BTC Forecast09/09/2025Price isn’t held up by your tweets — it’s held up by volume. And volume says lower.
By walking through the profile step by step, I explain how:
The thick high-volume nodes act as magnets for price.
The thin low-volume zones provide little support and often get filled quickly.
Bitcoin’s current setup suggests price is more likely to retrace lower to retest the areas where most of the trading volume occurred.
If you’ve ever wondered how to connect the dots between the volume profile and the order book, or why market structure points down when everyone else says up

Global Soft Commodity Trading1. What Are Soft Commodities?
Soft commodities are agricultural products that are cultivated, harvested, and consumed globally. They are often seasonal, perishable, and dependent on climatic conditions. The main categories include:
Grains & Oilseeds
Wheat
Corn (maize)
Soybeans
Barley
Rice
Tropical Products
Coffee (Arabica, Robusta)
Cocoa
Sugar
Fibers
Cotton
Wool
Livestock & Others
Orange juice
Lumber
Dairy (in some markets)
These commodities are not only traded for consumption but also serve as raw materials for industries (e.g., cotton for textiles, soybeans for animal feed, sugar for ethanol production).
2. Historical Evolution of Soft Commodity Trading
Soft commodity trading is as old as civilization itself. The rise of agriculture allowed communities to specialize and trade surplus harvests for other goods. Some key historical milestones include:
Ancient Civilizations: Wheat and barley were traded in Mesopotamia, rice in Asia, and cotton in India and Egypt.
Medieval Period: The spice trade connected Asia to Europe, paving the way for global trading routes.
Colonial Era: European colonial powers exploited tropical regions for sugar, cotton, cocoa, and coffee plantations, fueling global demand.
Industrial Revolution: The textile boom drove massive cotton demand, while sugar and cocoa became staples in Western diets.
20th Century: Modern futures exchanges like the Chicago Board of Trade (CBOT) formalized grain trading, creating standardized contracts.
21st Century: Technology, globalization, and financialization have turned soft commodities into highly liquid and globally traded assets.
3. Key Global Soft Commodities and Their Markets
3.1 Coffee
Second most traded commodity after crude oil (by value).
Grown mainly in Brazil, Vietnam, Colombia, and Ethiopia.
Traded on ICE Futures U.S. (Intercontinental Exchange).
Prices are highly sensitive to weather, pests, and demand from developed countries.
3.2 Cocoa
Primary ingredient in chocolate.
Grown mainly in West Africa (Ivory Coast, Ghana), with smaller producers in Indonesia and Latin America.
Highly volatile due to labor conditions, political instability, and climate.
3.3 Cotton
Integral to the textile industry.
Major producers: India, China, USA, Pakistan.
Traded on ICE Cotton No.2 futures.
Sensitive to weather, pests, and industrial demand.
3.4 Sugar
Dual use: food consumption & biofuel (ethanol).
Brazil is the largest producer and exporter.
Weather patterns (El Niño/La Niña) impact global supply.
3.5 Grains (Wheat, Corn, Rice, Soybeans)
Staple foods for billions worldwide.
U.S., Russia, Ukraine, China, and India dominate production.
Corn is also used for livestock feed and biofuels.
Soybeans are critical for animal protein and vegetable oils.
4. Global Trading Hubs for Soft Commodities
Chicago Board of Trade (CBOT) – grains and oilseeds.
Intercontinental Exchange (ICE) – coffee, cocoa, cotton, sugar.
New York Mercantile Exchange (NYMEX) – certain agricultural futures.
Euronext (Paris) – milling wheat.
Multi Commodity Exchange (MCX) – India – cotton, sugar, and agricultural futures.
Dalian Commodity Exchange (DCE) – China – soybeans and related products.
These exchanges provide futures contracts that allow producers, traders, and investors to hedge risks and speculate on price movements.
5. Participants in Soft Commodity Trading
5.1 Producers
Farmers, cooperatives, and agricultural companies.
Seek to hedge against falling prices by selling futures contracts.
5.2 Consumers
Food companies, textile firms, and beverage manufacturers.
Hedge against rising input costs.
5.3 Traders
Middlemen who connect producers with consumers.
Examples: Cargill, Louis Dreyfus, Archer Daniels Midland (ADM), Bunge.
5.4 Speculators
Hedge funds, institutional investors, and retail traders.
Provide liquidity but increase volatility.
5.5 Governments
Regulate exports, impose subsidies, or control food inflation.
6. Trading Mechanisms
Soft commodities can be traded in several ways:
6.1 Spot Market
Immediate delivery at current prices.
Common for physical buyers like millers, roasters, or exporters.
6.2 Futures Contracts
Standardized contracts traded on exchanges.
Allow hedging and speculation. Example: CBOT Wheat Futures.
6.3 Options on Futures
Provide the right, not obligation, to buy/sell futures.
Used to manage risks.
6.4 Over-the-Counter (OTC) Contracts
Customized private agreements between parties.
6.5 ETFs & Indices
Investors can gain exposure without physical delivery.
Examples: Teucrium Wheat ETF, iPath Coffee ETN.
7. Factors Influencing Soft Commodity Prices
Weather & Climate
Droughts, floods, hurricanes, and frost can devastate harvests.
El Niño & La Niña cycles strongly impact global production.
Geopolitics
Wars (e.g., Russia-Ukraine conflict impacting wheat exports).
Trade policies, tariffs, and export bans.
Currency Movements
Commodities are priced in USD, so fluctuations in dollar value affect global prices.
Global Demand & Consumption Trends
Rising middle class in Asia → higher demand for coffee, chocolate, meat, and processed foods.
Health trends and biofuel demand shape consumption patterns.
Technology & Productivity
GMOs, irrigation, and fertilizers increase yields.
Mechanization reduces costs but can lead to oversupply.
Speculation & Financialization
Hedge funds and ETFs increase price swings.
8. Risks in Soft Commodity Trading
Price Volatility: Sudden weather events or political decisions can cause sharp movements.
Perishability: Storage costs and risks are higher than for hard commodities.
Market Manipulation: Concentrated players can distort prices.
Geopolitical Instability: African cocoa-producing nations often face coups or civil unrest.
Climate Change: Long-term risk as shifting patterns affect traditional growing regions.
9. Opportunities in Soft Commodity Trading
Portfolio Diversification: Provides a hedge against inflation.
High Liquidity: Futures markets are highly liquid, offering trading opportunities.
Emerging Market Demand: Rising populations in Asia and Africa drive demand growth.
Technological Advancements: AI, blockchain, and satellite monitoring improve forecasting and transparency.
Sustainable Investing: ESG-focused funds look at ethical sourcing of coffee, cocoa, and cotton.
10. Case Studies
10.1 Coffee Price Shock (2014)
Brazil’s drought severely reduced coffee output, leading to a 70% surge in Arabica prices. Traders who anticipated the weather-driven shortage made huge profits.
10.2 Cocoa Market (2020–2022)
Political instability in Ivory Coast and Ghana disrupted supply chains, while rising demand in Asia pushed prices higher.
10.3 Russia-Ukraine War (2022–2023)
Ukraine, a top wheat exporter, was blocked from shipping through Black Sea ports, causing a global food crisis. Futures spiked, and developing nations faced shortages.
Conclusion
Global soft commodity trading is a vital, dynamic, and complex part of the international economy. It touches everything from the morning coffee in your cup to the bread on your table and the cotton in your clothes. Unlike hard commodities, soft commodities are more unpredictable, influenced by weather, politics, and human consumption habits.
For investors and traders, soft commodities present both opportunities for profit and risks of volatility. For policymakers, they represent a tool of food security and geopolitical leverage. For producers, they are a lifeline tied to livelihoods and survival.
As climate change, technology, and shifting consumption patterns reshape the world, soft commodities will remain at the heart of global trade, shaping the balance between supply, demand, and sustainability.
Global Market Participants1. Classification of Global Market Participants
Global market participants can broadly be divided into the following categories:
Sovereign and Supranational Institutions
Central Banks
Governments and Sovereign Wealth Funds
Multilateral Organizations (IMF, World Bank, WTO)
Institutional Investors
Pension Funds
Insurance Companies
Mutual Funds and ETFs
Hedge Funds
Private Equity and Venture Capital
Market Intermediaries
Investment Banks
Brokerage Firms
Clearing Houses and Exchanges
Corporate Participants
Multinational Corporations (MNCs)
Exporters and Importers
Commodity Producers
Retail Participants
Individual Investors
High-Net-Worth Individuals (HNIs)
Retail Traders
Other Specialized Players
Algorithmic and High-Frequency Traders
Credit Rating Agencies
Regulatory Authorities
2. Sovereign and Supranational Institutions
2.1 Central Banks
Central banks such as the U.S. Federal Reserve, the European Central Bank (ECB), and the Reserve Bank of India are among the most powerful market participants. Their main functions include:
Monetary Policy: Adjusting interest rates and controlling money supply.
Foreign Exchange Interventions: Stabilizing or influencing currency exchange rates.
Market Stability: Acting as lenders of last resort during financial crises.
Example: When the Federal Reserve raises interest rates, global investors reallocate capital toward U.S. assets, strengthening the dollar and affecting equity and bond markets worldwide.
2.2 Governments and Sovereign Wealth Funds
Governments participate in markets through:
Issuing government bonds to fund fiscal deficits.
Establishing sovereign wealth funds (SWFs) to invest surplus revenues, often from natural resources like oil.
Engaging in trade agreements that influence global commerce.
Examples:
Norway’s Government Pension Fund Global is one of the world’s largest SWFs.
Japan issues large amounts of government debt, making its bond market a global benchmark.
2.3 Multilateral Organizations
Institutions like the IMF, World Bank, and WTO play stabilizing roles:
IMF provides emergency funding to countries facing balance-of-payment crises.
World Bank funds infrastructure projects that stimulate global trade.
WTO regulates international trade to ensure fair practices.
3. Institutional Investors
3.1 Pension Funds
Pension funds manage retirement savings for millions of workers. They are long-term investors and major players in equity, bond, and real estate markets.
Example: The California Public Employees’ Retirement System (CalPERS) manages over $400 billion.
Impact: Pension funds provide stability since their investment horizon spans decades.
3.2 Insurance Companies
Insurance companies collect premiums and invest them to generate returns before claims are paid out. They are significant participants in bond and fixed-income markets because of their need for stable cash flows.
3.3 Mutual Funds and ETFs
Mutual funds pool money from investors to buy diversified portfolios.
ETFs (Exchange-Traded Funds) have become popular for their low fees and ability to track indices.
Their collective influence is massive, often moving markets based on inflows and redemptions.
3.4 Hedge Funds
Hedge funds use aggressive strategies (short-selling, leverage, derivatives) to achieve high returns. They are often criticized for market volatility but also praised for market efficiency.
3.5 Private Equity and Venture Capital
Private Equity (PE): Acquires and restructures established companies.
Venture Capital (VC): Invests in early-stage startups, fueling innovation.
These funds play a crucial role in business expansion and technological progress.
4. Market Intermediaries
4.1 Investment Banks
Investment banks such as Goldman Sachs, Morgan Stanley, and JPMorgan act as intermediaries between corporations and capital markets. Their roles include:
Underwriting IPOs and bond issues.
Advising on mergers and acquisitions (M&A).
Facilitating large trades for institutional clients.
4.2 Brokerage Firms
Brokerages connect retail and institutional investors to markets. They earn through commissions, spreads, or subscription models.
4.3 Clearing Houses and Exchanges
Stock exchanges (NYSE, NASDAQ, LSE) provide platforms for trading securities.
Clearing houses ensure smooth settlement and reduce counterparty risk.
5. Corporate Participants
5.1 Multinational Corporations (MNCs)
MNCs such as Apple, Toyota, and Reliance Industries are active participants in currency, equity, and bond markets. They hedge risks using derivatives and issue corporate bonds to raise capital.
5.2 Exporters and Importers
Global trade participants engage in hedging to protect against currency fluctuations. For example, an Indian exporter to the U.S. may hedge against USD/INR volatility.
5.3 Commodity Producers
Oil companies, mining firms, and agricultural producers are vital to commodity markets. They hedge using futures contracts to protect against price swings.
6. Retail Participants
6.1 Individual Investors
Retail investors trade in stocks, bonds, mutual funds, and cryptocurrencies. With the rise of fintech platforms, their participation has grown exponentially.
6.2 High-Net-Worth Individuals (HNIs)
HNIs use private banking services for wealth management, often investing in alternative assets like real estate, art, and private equity.
6.3 Retail Traders
Short-term traders focus on daily or intraday movements. With online platforms, they contribute significantly to trading volumes, especially in equities and forex.
7. Specialized Players
7.1 Algorithmic and High-Frequency Traders
These participants use complex algorithms to execute trades within microseconds. While they enhance liquidity, they also raise concerns about “flash crashes.”
7.2 Credit Rating Agencies
Agencies like S&P, Moody’s, and Fitch evaluate creditworthiness. Their ratings influence borrowing costs for governments and corporations.
7.3 Regulatory Authorities
Regulators such as SEBI (India), SEC (U.S.), and ESMA (EU) oversee markets to protect investors, maintain fairness, and reduce systemic risks.
8. Interactions Among Participants
Markets function as ecosystems where participants are interdependent:
Retail investors provide liquidity.
Institutional investors drive long-term capital flows.
Central banks set the tone with monetary policy.
Corporates raise funds and provide underlying assets.
Example: During COVID-19, central banks provided liquidity, governments issued bonds, institutional investors allocated capital, and retail investors entered markets in record numbers.
9. Challenges for Global Market Participants
Geopolitical Risks – Wars, sanctions, and trade conflicts disrupt markets.
Technological Disruptions – AI trading, blockchain, and cybersecurity risks.
Regulatory Changes – Increased scrutiny on hedge funds and cryptocurrencies.
Environmental, Social, and Governance (ESG) – Pressure to adopt sustainable investment practices.
Market Volatility – Rising due to global interconnection and speed of information.
10. Opportunities in Global Markets
Emerging Markets: Offer higher growth potential despite risks.
Digital Assets: Cryptocurrencies, tokenized securities, and DeFi.
Sustainable Finance: Green bonds and ESG-focused investments.
Cross-Border Investments: Enhanced by globalization and technology.
Conclusion
Global market participants form a complex web where each plays a unique role in shaping financial markets. From central banks and sovereign funds to retail investors and algorithmic traders, their collective actions determine the flow of capital, the allocation of resources, and the stability of economies.
In an era of globalization, digitization, and sustainability, market participants must adapt to changing conditions while maintaining the delicate balance between risk and opportunity. Understanding their functions and interactions is essential for grasping the mechanics of global finance and preparing for the future of markets.
Role of Central Banks in Global Markets1. Historical Evolution of Central Banks
1.1 Early Origins
The first central banks emerged in the 17th century, such as the Swedish Riksbank (1668) and the Bank of England (1694), to stabilize currencies and finance governments.
Initially, their role was limited to issuing banknotes and managing public debt.
1.2 Gold Standard Era
During the 19th and early 20th centuries, central banks were tasked with maintaining currency values under the gold standard.
Stability of international trade depended on these institutions’ ability to maintain fixed exchange rates.
1.3 Post-War Bretton Woods System
After World War II, the Bretton Woods agreement (1944) tied major currencies to the U.S. dollar, with the dollar convertible to gold.
Central banks became guardians of exchange rate stability.
1.4 Modern Role (Post-1971)
With the collapse of Bretton Woods in 1971, currencies floated freely.
Central banks shifted focus to inflation targeting, financial stability, and macroeconomic management.
Today, their influence extends beyond national borders into global capital flows and markets.
2. Core Functions of Central Banks in Global Markets
2.1 Monetary Policy
Central banks set interest rates and regulate money supply to achieve price stability and economic growth. Their policies influence:
Global capital flows: Higher U.S. interest rates often attract funds from emerging markets.
Exchange rates: Monetary tightening usually strengthens domestic currency.
Investment decisions: Global investors closely follow central bank policies to allocate capital.
2.2 Lender of Last Resort
During crises, central banks provide emergency liquidity to banks and financial institutions.
Example: During the 2008 Global Financial Crisis, the U.S. Fed and ECB provided trillions in liquidity through swap lines, stabilizing global markets.
2.3 Financial Stability Oversight
Central banks regulate banks and oversee payment systems to prevent systemic risks.
They monitor asset bubbles, excessive lending, and foreign capital volatility.
2.4 Exchange Rate Management
Emerging market central banks (e.g., RBI, PBoC) often intervene in forex markets to prevent excessive volatility.
Exchange rate policy impacts global trade competitiveness.
2.5 Reserve Management
Central banks hold foreign exchange reserves, including U.S. dollars, euros, gold, and bonds, to support their currencies.
Their demand for U.S. Treasuries or euro-denominated assets influences global bond yields.
3. Tools of Central Banks
3.1 Interest Rate Policy
Policy rates (Fed Funds Rate, ECB refinancing rate, RBI repo rate) influence borrowing costs worldwide.
Rate hikes in advanced economies often trigger capital outflows from emerging markets.
3.2 Open Market Operations (OMO)
Buying or selling government securities to manage liquidity.
Large-scale OMO, known as Quantitative Easing (QE), became prominent post-2008.
3.3 Reserve Requirements
Mandating banks to hold a percentage of deposits as reserves.
Impacts credit availability in domestic and global markets.
3.4 Forward Guidance
Central banks provide communication on future policy intentions to influence market expectations.
Example: The Fed’s signals about interest rates guide global equity and bond markets.
3.5 Currency Interventions
Buying or selling foreign currency to stabilize exchange rates.
Example: The Swiss National Bank intervenes to prevent excessive franc appreciation.
4. Influence of Major Central Banks on Global Markets
4.1 U.S. Federal Reserve (Fed)
The most influential central bank due to the U.S. dollar’s role as the global reserve currency.
Fed decisions on rates and QE directly affect:
Global bond yields
Commodity prices (oil, gold)
Emerging market capital flows
4.2 European Central Bank (ECB)
Oversees the euro, the second most traded currency.
ECB policies influence European bond markets, trade flows, and global investor sentiment.
4.3 Bank of Japan (BoJ)
Known for ultra-low interest rates and Yield Curve Control (YCC).
Impacts global carry trades, where investors borrow in yen and invest in higher-yielding markets.
4.4 People’s Bank of China (PBoC)
Manages the yuan and China’s monetary policy.
Its decisions affect global supply chains, commodity demand, and emerging markets.
4.5 Reserve Bank of India (RBI)
Plays a vital role in stabilizing one of the largest emerging economies.
RBI interventions impact Asian capital markets and forex stability.
5. Central Banks During Crises
5.1 Global Financial Crisis (2008)
The Fed cut rates to near zero and launched QE.
ECB and BoJ followed with liquidity measures.
Central banks coordinated globally, stabilizing markets.
5.2 Eurozone Debt Crisis (2010-12)
ECB’s “Whatever it takes” pledge by Mario Draghi restored investor confidence.
Prevented collapse of European bond markets.
5.3 COVID-19 Pandemic (2020)
Central banks injected unprecedented liquidity.
Rates were cut to historic lows.
Asset purchase programs kept markets afloat despite global lockdowns.
6. Challenges Faced by Central Banks
6.1 Balancing Inflation and Growth
Rising inflation post-pandemic forced central banks to hike rates aggressively.
Risk of recession vs. inflation control is a constant trade-off.
6.2 Global Spillovers
A Fed rate hike strengthens the dollar, hurting emerging markets through capital flight and debt pressures.
6.3 Political Pressures
Governments often pressure central banks to support growth, risking their independence.
6.4 Digital Currencies & Technology
Rise of cryptocurrencies and Central Bank Digital Currencies (CBDCs) is changing the financial landscape.
Central banks must balance innovation with regulation.
6.5 Geopolitical Tensions
Sanctions and de-dollarization efforts challenge the U.S. Fed’s dominance.
Energy shocks and wars complicate policy decisions.
7. Future of Central Banks in Global Markets
7.1 Greater Coordination
Global challenges like climate change, pandemics, and financial contagion may require more coordinated action among central banks.
7.2 Digital Transformation
Adoption of CBDCs could redefine cross-border payments, reducing reliance on the dollar.
7.3 Green Finance Role
Central banks may support climate-friendly investments by adjusting reserve requirements or collateral frameworks.
7.4 Rebalancing Power
Emerging market central banks like PBoC and RBI will gain more influence as their economies grow.
Conclusion
Central banks are no longer confined to their domestic economies—they are global market architects. Their monetary policies, interventions, and crisis-management tools shape the movement of capital, trade, and currencies worldwide.
From the Fed’s dominance in global finance to the ECB’s stabilizing role in Europe, and from the BoJ’s ultra-loose policies to the PBoC’s yuan management, these institutions collectively form the backbone of global financial stability.
However, their journey is fraught with challenges—rising inflation, geopolitical risks, digital disruption, and climate imperatives. The future role of central banks will demand not just economic stewardship but also global cooperation, adaptability, and resilience.
In essence, central banks remain the invisible hand guiding global markets, making them indispensable players in the world economy.
WTO, IMF, and World Bank in Global Trading1. Historical Background of Global Trade Institutions
1.1 The Bretton Woods Conference (1944)
In the aftermath of World War II, world leaders recognized the need for a stable international economic order.
The Bretton Woods Conference, held in New Hampshire, USA, in 1944, gave birth to two major institutions: the IMF and the World Bank.
Their purpose was to rebuild war-torn economies, stabilize currencies, and finance reconstruction.
1.2 The General Agreement on Tariffs and Trade (GATT) and WTO
In 1947, the General Agreement on Tariffs and Trade (GATT) was established to reduce tariffs and encourage trade liberalization.
GATT evolved over decades and was eventually replaced by the World Trade Organization (WTO) in 1995, which took on broader responsibilities in managing international trade rules.
Thus, the global economic framework today rests on three pillars: WTO (trade rules), IMF (financial stability), and World Bank (development financing).
2. World Trade Organization (WTO)
2.1 What is the WTO?
The WTO is the only global organization dealing with the rules of trade between nations. With over 160 member countries, it regulates trade agreements, monitors compliance, and settles disputes.
2.2 Core Objectives
Trade Liberalization – Reduce tariffs, quotas, and other barriers.
Predictability – Ensure stable trade policies through binding commitments.
Non-Discrimination – “Most-Favored Nation” (MFN) treatment, ensuring countries don’t discriminate among trade partners.
Fair Competition – Prevent unfair practices like dumping or subsidies.
Development – Provide special provisions for developing and least-developed countries.
2.3 WTO Functions in Global Trade
Negotiation Forum: Members negotiate trade deals (e.g., Doha Round).
Implementation and Monitoring: Ensures countries comply with trade agreements.
Dispute Settlement: Provides a legal framework to resolve trade conflicts.
Capacity Building: Assists developing nations with trade knowledge.
2.4 Impact of WTO on Global Trade
Dramatic reduction in average tariffs (from >30% in 1947 to <5% today).
Expansion of world trade, allowing developing countries like China, India, and Brazil to emerge as major players.
Legal dispute resolution prevents trade wars and supports stability.
2.5 Criticisms of WTO
Seen as favoring developed nations with stronger bargaining power.
Negotiation rounds often stall due to conflicting interests.
Critics argue WTO undermines national sovereignty by enforcing global rules.
3. International Monetary Fund (IMF)
3.1 What is the IMF?
The IMF is a global financial institution headquartered in Washington, D.C., with 190+ member countries. It ensures the stability of the international monetary system—exchange rates, payments, and cross-border capital flows.
3.2 Objectives of IMF
Exchange Rate Stability – Prevent currency crises and competitive devaluations.
Balance of Payments Assistance – Provide short-term loans to countries in crisis.
Policy Surveillance – Monitor global economic trends and provide policy advice.
Capacity Development – Offer training to strengthen economic institutions.
3.3 Functions in Global Trade
Financing Trade Deficits: Countries with shortages of foreign currency can borrow from IMF to finance imports.
Crisis Management: Provides emergency support during global shocks (e.g., Asian Financial Crisis 1997, Eurozone crisis, COVID-19 pandemic).
Exchange Rate Stability: Prevents destabilizing fluctuations that could disrupt trade.
Confidence Building: By backing countries with funds, IMF assures trading partners of stability.
3.4 IMF Tools
Lending Programs: Stand-By Arrangements, Extended Fund Facility, and Rapid Financing Instrument.
Special Drawing Rights (SDRs): International reserve asset to boost global liquidity.
Surveillance Reports: The World Economic Outlook and Global Financial Stability Report.
3.5 Impact of IMF on Global Trade
Prevents collapse of trade flows by ensuring liquidity.
Encourages trade-oriented reforms in developing countries.
Enhances investor confidence by stabilizing economies.
3.6 Criticisms of IMF
Conditionality: Loans often come with austerity measures, criticized for worsening poverty.
Western Dominance: Voting rights favor developed nations, especially the U.S. and Europe.
One-Size-Fits-All Policies: Structural adjustment programs have been criticized for imposing uniform economic models.
4. World Bank
4.1 What is the World Bank?
The World Bank Group (WBG) is a collection of five institutions, the most prominent being the International Bank for Reconstruction and Development (IBRD) and the International Development Association (IDA). Its primary mission is poverty reduction and long-term development.
4.2 Objectives
Reconstruction & Development – Initially focused on post-war rebuilding, now on infrastructure and growth.
Poverty Reduction – Promote inclusive and sustainable development.
Financing Trade Infrastructure – Ports, roads, digital connectivity, and energy supply that enable trade.
Knowledge Sharing – Research and technical expertise.
4.3 Functions in Global Trade
Financing Development Projects: Infrastructure, education, health, energy.
Trade Facilitation: Improves logistics, reduces transaction costs.
Capacity Building: Helps developing nations integrate into global trade.
Risk Mitigation: Provides guarantees to encourage private investment.
4.4 Impact of World Bank on Trade
Building infrastructure that directly supports trade flows (e.g., transport corridors, ports).
Reducing bottlenecks and making exports competitive.
Encouraging private investment and entrepreneurship in developing markets.
4.5 Criticisms of World Bank
Projects sometimes cause displacement or environmental harm.
Critics argue the Bank pushes neoliberal reforms (privatization, deregulation).
Dependence on debt financing can burden poor countries.
5. Interrelationship Between WTO, IMF, and World Bank
These three institutions are often referred to as the “Bretton Woods Twins + WTO” or the pillars of global economic governance.
WTO → Creates the rules of trade.
IMF → Provides monetary stability for trade.
World Bank → Finances development to enable trade participation.
5.1 Coordination
WTO, IMF, and World Bank hold joint meetings to harmonize policies.
During crises (e.g., 2008 financial crash, COVID-19), they collaborated on stimulus and debt relief.
5.2 Complementary Roles
IMF stabilizes economies so they can continue trade.
World Bank builds the infrastructure that enables countries to trade.
WTO provides the legal framework that governs trade relations.
6. Case Studies
6.1 Asian Financial Crisis (1997)
IMF provided emergency loans to South Korea, Thailand, and Indonesia.
WTO prevented protectionist measures that could have worsened the crisis.
World Bank financed structural reforms in affected economies.
6.2 Global Financial Crisis (2008)
IMF expanded lending and increased SDR allocations.
World Bank financed countercyclical projects in developing countries.
WTO helped prevent a rise in tariffs and trade wars.
6.3 COVID-19 Pandemic (2020–2021)
IMF mobilized trillions in emergency support.
World Bank financed health programs, vaccine distribution, and digital infrastructure.
WTO monitored export restrictions on medical supplies and promoted trade facilitation.
7. Criticism of Global Economic Governance
Despite their contributions, these institutions face criticism:
Power Imbalance: Rich nations have more influence.
Conditionality and Sovereignty: Loans often reduce national autonomy.
Unequal Benefits: Global trade benefits are not equally distributed.
Environmental Concerns: Development projects sometimes harm ecosystems.
8. The Future of WTO, IMF, and World Bank in Global Trade
8.1 Challenges Ahead
Rise of protectionism and trade wars (e.g., U.S.–China tensions).
Global inequality and debt crises in developing countries.
Climate change and sustainable development needs.
Digital trade and financial technology disrupting traditional models.
8.2 Possible Reforms
WTO: Reform dispute settlement system and include digital trade rules.
IMF: Greater representation for emerging economies, flexible conditionality.
World Bank: Stronger focus on climate resilience and sustainable infrastructure.
8.3 Long-Term Role
Together, these institutions will remain crucial in shaping the global trade system—balancing stability, growth, and inclusivity.
Conclusion
Global trade is the lifeblood of the interconnected world economy, but it requires strong institutions to ensure fairness, stability, and sustainability. The WTO provides the rules, the IMF ensures monetary stability, and the World Bank finances development that enables participation in trade.
Though criticized for inequities and structural biases, these institutions have prevented major global trade breakdowns, facilitated economic growth, and enabled developing nations to integrate into the global economy.
In the future, reforms are needed to make them more inclusive, transparent, and responsive to new challenges such as digital trade, climate change, and inequality. Yet, their centrality in global trading remains undisputed—without them, the world economy would be far more unstable, fragmented, and vulnerable to crisis.
Global Corporate Bond Trading1. What Are Corporate Bonds?
A corporate bond is a debt security issued by a corporation to raise money for various purposes such as expansion, acquisitions, refinancing, or working capital.
Issuer: The company borrowing money.
Investor: The buyer of the bond, lending money in exchange for fixed interest payments (coupons).
Maturity: The date when the company repays the bondholder’s principal.
Coupon: The fixed or floating interest paid to the bondholder.
Unlike equities (shares), bonds do not give ownership in the company. They represent a loan, with priority repayment rights if the company faces bankruptcy.
2. Evolution of the Corporate Bond Market
Early History
The first corporate bonds date back to the 19th century, with U.S. railroads raising funds through bonds.
By the 20th century, corporate bonds became a primary source of long-term financing for industrial and service companies.
Global Expansion
After World War II, the U.S. and European companies used corporate bonds heavily to rebuild industries.
In the late 20th century, Japan and emerging markets entered the global bond market.
21st Century Trends
Today, the corporate bond market is highly international. Companies issue bonds in multiple currencies to attract global investors.
Globalization, electronic trading, and credit derivatives (like credit default swaps, CDS) have transformed bond trading into a dynamic, interconnected market.
3. Types of Corporate Bonds
Corporate bonds vary widely. Some key categories are:
Investment-Grade Bonds
Issued by financially strong companies.
Rated BBB-/Baa3 or higher by credit rating agencies.
Lower risk, lower yield.
High-Yield (Junk) Bonds
Issued by riskier companies with lower credit ratings.
Higher yields to compensate investors.
Popular in leveraged buyouts, private equity financing.
Convertible Bonds
Can be converted into equity shares at a set price.
Offer lower coupons due to the equity upside potential.
Callable & Putable Bonds
Callable: Issuer can redeem before maturity.
Putable: Investor can demand early repayment.
Floating-Rate Notes (FRNs)
Coupons linked to benchmarks (LIBOR, SOFR, Euribor).
Protects investors from interest rate risk.
Green, Social, and Sustainability Bonds
Proceeds used for environmentally or socially responsible projects.
Gaining popularity with ESG (Environmental, Social, Governance) investors.
4. The Global Corporate Bond Market Structure
The global corporate bond market is over-the-counter (OTC), meaning most trades are negotiated privately rather than on exchanges.
Primary Market: Where companies issue new bonds (IPOs for debt).
Secondary Market: Where investors buy and sell existing bonds.
Key Centers
U.S.: Largest corporate bond market (over $12 trillion outstanding).
Europe: Active Eurobond market, allowing international issuances in multiple currencies.
Asia: Rapidly growing (China, Japan, India).
Emerging Markets: Corporates from Latin America, Africa, Middle East raising funds globally.
5. Key Participants in Global Corporate Bond Trading
Issuers: Corporations from all industries.
Investors:
Pension funds, insurance companies, sovereign wealth funds.
Banks, hedge funds, mutual funds, retail investors.
Intermediaries:
Investment banks (underwriters, dealers).
Bond traders and brokers.
Regulators:
SEC (U.S.), ESMA (EU), FCA (UK), SEBI (India).
They enforce transparency, fair trading, and investor protection.
Rating Agencies:
Moody’s, S&P, Fitch provide credit ratings.
Crucial in determining yields and investor appetite.
6. Trading Mechanisms
a. Primary Issuance Process
Company hires investment banks as underwriters.
Prospectus prepared and credit rating obtained.
Bonds are priced and distributed to institutional investors.
Listing may occur in global bond markets (Luxembourg, London, Singapore).
b. Secondary Market Trading
Mostly OTC via dealers.
Electronic platforms (MarketAxess, Tradeweb, Bloomberg) growing.
Price discovery less transparent than stocks, but improving with regulation.
c. Settlement
Clearing systems like Euroclear, Clearstream, DTC handle settlements.
Typically T+2 (two business days).
7. Pricing & Valuation
Bond prices depend on:
Interest Rates: Rising rates lower bond prices, and vice versa.
Credit Spreads: Extra yield over government bonds reflecting risk.
Liquidity: Easily tradable bonds fetch higher prices.
Currency Risk: Bonds issued in foreign currencies carry FX exposure.
Market Sentiment: Risk-on vs risk-off cycles influence spreads.
8. Risks in Global Corporate Bond Trading
Credit Risk: Issuer may default.
Interest Rate Risk: Bond values fall when rates rise.
Liquidity Risk: Some bonds hard to trade in secondary markets.
Currency Risk: For bonds issued in foreign currencies.
Event Risk: M&A, lawsuits, regulatory changes affecting issuers.
Systemic Risk: Global crises (e.g., 2008, 2020 COVID) trigger sell-offs.
9. Opportunities and Benefits
Diversification: Corporate bonds add balance to portfolios alongside equities.
Stable Income: Predictable coupon payments.
Capital Preservation: Safer than stocks (especially investment-grade).
Global Access: Investors can gain exposure to different economies and industries.
ESG Investing: Growth of green and sustainable bonds.
10. Global Corporate Bond Market Statistics (as of mid-2020s)
Global corporate bond market exceeds $40 trillion outstanding.
U.S. corporate bonds: ~60% of the global market.
Europe: ~25%, with the Eurobond market dominating.
Asia-Pacific: Fastest-growing, led by China’s state-owned enterprises.
Emerging markets: Increasingly active, especially in USD-denominated bonds.
Conclusion
Global corporate bond trading is the lifeblood of modern capital markets. It connects companies seeking financing with investors searching for income and diversification. The market has evolved from railroad bonds in the 19th century to trillion-dollar electronic platforms today.
For issuers, corporate bonds are a flexible, efficient way to raise capital globally. For investors, they offer income, relative safety, and exposure to global economies. However, the market carries risks—from credit defaults to interest rate shocks—that require careful management.
As technology, regulation, and ESG trends reshape the landscape, global corporate bond trading will continue to play a central role in global finance—bridging corporations and capital on an ever-expanding scale.
Global Government Bond Trading1. Fundamentals of Government Bonds
1.1 What Are Government Bonds?
A government bond is a debt security issued by a country’s treasury or finance ministry to raise money. When an investor buys a government bond, they are lending money to the government in exchange for periodic coupon payments (interest) and repayment of the principal at maturity.
Coupon Bonds: Pay regular interest plus principal at maturity.
Zero-Coupon Bonds: Sold at a discount, repay face value at maturity.
Inflation-Linked Bonds: Adjust coupon/principal with inflation rates.
Savings Bonds / Retail Bonds: Targeted at individual investors.
1.2 Key Features of Government Bonds
Issuer: Sovereign state.
Maturity: Short-term (T-bills), medium-term (notes), long-term (bonds).
Yield: Return investors expect, inversely related to bond price.
Credit Risk: Higher in emerging economies; lower in developed ones.
Liquidity: Developed market bonds (like U.S. Treasuries) are highly liquid, emerging markets less so.
1.3 Importance in Global Finance
Provide a risk-free benchmark rate (e.g., U.S. Treasury yields influence global lending rates).
Used as collateral in repo markets.
Serve as safe-haven assets during crises.
Act as tools for monetary policy (quantitative easing, open market operations).
2. Structure of the Global Government Bond Market
2.1 Primary Market
This is where governments issue new bonds via auctions or syndications. Investors bid for these securities, and the government raises capital.
Auction System: Used by the U.S., UK, Japan. Competitive and non-competitive bidding.
Syndicated Issuance: Banks underwrite and distribute bonds, common in Europe.
2.2 Secondary Market
Bonds are traded between investors after issuance. This provides liquidity and continuous price discovery.
Over-the-Counter (OTC): Majority of global bond trading occurs OTC via dealers.
Electronic Trading Platforms: Growing importance (e.g., Tradeweb, MarketAxess).
2.3 Major Bond Markets
U.S. Treasuries: World’s largest, deepest, and most liquid government bond market.
Eurozone Bonds: German Bunds are benchmark safe assets, Italian and Spanish bonds carry higher yields.
Japanese Government Bonds (JGBs): Very large market but often low yields.
UK Gilts: Highly liquid, influenced by Bank of England policy.
Emerging Market Bonds: Offer higher yields but with currency and default risks (Brazil, India, South Africa).
3. Key Participants in Global Government Bond Trading
3.1 Central Banks
Major holders and buyers of government debt.
Conduct monetary policy through bond purchases (QE) or sales.
Hold government bonds as foreign reserves.
3.2 Institutional Investors
Pension funds, insurance companies, and mutual funds allocate heavily to sovereign debt for predictable returns.
3.3 Hedge Funds & Proprietary Traders
Trade bonds to profit from interest rate changes, arbitrage opportunities, or global macro strategies.
3.4 Foreign Governments & Sovereign Wealth Funds
Invest in foreign government bonds for diversification and reserve management.
3.5 Retail Investors
Participate via government savings bonds, ETFs, and mutual funds.
4. Trading Mechanisms
4.1 Cash Market Trading
Direct purchase/sale of government bonds in the secondary market.
Prices fluctuate with interest rates, inflation expectations, and credit risk.
4.2 Derivatives Market
Futures, options, and swaps based on government bonds or yields.
Example: U.S. Treasury futures (CME), Bund futures (Eurex).
4.3 Repo Market
Repurchase agreements use government bonds as collateral.
Essential for liquidity in the global financial system.
4.4 Electronic Platforms & Algorithmic Trading
Rapid growth in e-trading platforms.
Algorithmic and high-frequency trading now account for a significant share.
5. Factors Affecting Government Bond Prices and Yields
5.1 Interest Rates
Bond prices move inversely with interest rates. Central bank policy shifts directly impact yields.
5.2 Inflation
High inflation reduces real returns, pushing yields higher. Inflation-indexed bonds mitigate this risk.
5.3 Economic Growth
Stronger growth can lead to higher yields due to expectations of rate hikes.
5.4 Fiscal Deficits & Debt Levels
Higher government borrowing can push yields upward due to increased supply and perceived risk.
5.5 Currency Movements
Foreign investors consider exchange rate risks; weaker local currency may deter bond purchases.
5.6 Geopolitical Risk
Wars, sanctions, and political instability drive safe-haven flows into bonds of stable nations.
6. Global Government Bond Trading Strategies
6.1 Buy and Hold
Conservative investors, like pension funds, hold bonds to maturity for stable income.
6.2 Yield Curve Strategies
Steepener: Betting long-term rates rise faster than short-term.
Flattener: Opposite bet.
Butterfly Trades: Exploiting mid-term vs short/long-term curve differences.
6.3 Relative Value / Arbitrage
Traders exploit mispricing between different government bonds.
Example: Spread between U.S. Treasuries and German Bunds.
6.4 Global Macro Plays
Hedge funds trade bonds based on global interest rate cycles, inflation, and geopolitical events.
6.5 Carry Trade in Bonds
Borrowing in low-yield currencies and investing in higher-yield government bonds elsewhere.
7. Risks in Government Bond Trading
7.1 Interest Rate Risk
Sharp changes in central bank policy can cause bond price volatility.
7.2 Inflation Risk
Unexpected inflation erodes real returns.
7.3 Credit Risk
Even sovereigns can default (examples: Argentina, Greece).
7.4 Liquidity Risk
Smaller bond markets may not provide adequate trading liquidity.
7.5 Currency Risk
Foreign bond investors face exchange rate fluctuations.
7.6 Geopolitical Risk
Trade wars, sanctions, and political instability can disrupt markets.
8. Role of Government Bond Markets in Global Economy
Benchmark Rates: Government bond yields influence corporate borrowing costs.
Safe-Haven Assets: During crises, investors flock to bonds like U.S. Treasuries.
Monetary Transmission: Central bank policies work through bond markets.
Fiscal Policy Financing: Governments rely on bonds for infrastructure and welfare spending.
Global Capital Flows: Sovereign bonds drive cross-border capital allocation.
9. Case Studies in Global Bond Markets
9.1 U.S. Treasury Market
Largest and most liquid in the world (~$25 trillion outstanding).
Yields serve as a global reference for risk pricing.
Highly responsive to Federal Reserve policies.
9.2 European Sovereign Debt Crisis (2010–2012)
Greek, Portuguese, Spanish, and Italian bonds saw yield spikes.
Investors demanded higher compensation for perceived default risk.
ECB intervention (OMT, QE) stabilized the markets.
9.3 Japanese Government Bonds (JGBs)
Extremely low or negative yields for decades due to deflationary pressures.
Bank of Japan’s Yield Curve Control (YCC) dominates the market.
9.4 Emerging Market Bonds
Offer higher yields but riskier (Argentina default, Turkey’s currency crisis).
Depend heavily on foreign investor confidence.
10. Future of Global Government Bond Trading
10.1 Digital Transformation
Rise of electronic trading platforms.
Algorithmic and AI-based trading strategies.
10.2 Green & ESG-Linked Sovereign Bonds
Growing issuance of “green bonds” by governments to fund climate projects.
10.3 Impact of Global Debt Levels
Post-pandemic debt burdens remain high.
Long-term sustainability of government borrowing under scrutiny.
10.4 Geopolitical Realignment
U.S.–China rivalry may reshape global bond investment patterns.
“De-dollarization” efforts could impact U.S. Treasury dominance.
10.5 Central Bank Balance Sheets
Unwinding QE will affect bond market liquidity.
“Higher for longer” interest rate regimes may redefine yield structures.
Conclusion
Global government bond trading is the foundation of modern financial markets. It balances risk and safety, yield and liquidity, domestic policy and international capital flows. From U.S. Treasuries as the world’s risk-free benchmark to the volatile sovereign bonds of emerging markets, this market reflects the health of economies, the credibility of fiscal policy, and the confidence of investors.
In times of crisis, investors flock to safe government bonds. In times of growth, they may chase higher yields elsewhere. But regardless of market cycles, government bond trading remains central to how money moves across borders, how interest rates are set, and how nations finance themselves.
As the world transitions into an era of high debt, climate financing, digital trading, and shifting geopolitics, global government bond markets will only grow in importance. Understanding their mechanics is crucial for traders, investors, policymakers, and anyone seeking to grasp the pulse of global finance.

Swap Trading in Foreign MarketsHistorical Background of Swaps
The concept of swaps emerged in the late 1970s and early 1980s. Their development was tied to globalization, deregulation of capital markets, and the increasing volatility of interest rates and exchange rates.
1970s Energy Crisis and Volatility: Rising oil prices and inflation led to volatility in both interest rates and currencies. Companies engaged in cross-border trade needed instruments to hedge risks.
1981 Milestone: The first widely recognized currency swap was executed between the World Bank and IBM. This transaction allowed IBM to access Swiss francs and German marks at lower costs, while the World Bank obtained U.S. dollars without issuing dollar-denominated debt directly.
1980s–1990s: Swaps grew in popularity, particularly interest rate swaps, as corporations and banks used them to restructure liabilities.
2000s and Beyond: The growth of global derivatives markets, along with sophisticated technology and clearing systems, pushed swaps into the mainstream. Today, the Bank for International Settlements (BIS) estimates that the notional amount of outstanding swaps runs into hundreds of trillions of dollars, making it one of the largest segments of the derivatives market.
What is a Swap?
A swap is a derivative contract in which two parties agree to exchange sequences of cash flows for a set period. The cash flows are typically tied to interest rates, currencies, or commodities.
Key features of swaps:
Over-the-Counter (OTC) Nature: Traditionally, swaps are negotiated privately between parties, not traded on exchanges (though post-2008 reforms introduced central clearing for some swaps).
Customizable Terms: Swaps can be structured to meet the specific needs of the parties involved.
No Initial Exchange of Principal (in most cases): Unlike loans, swaps typically involve only the exchange of cash flows, not principal.
Maturity Ranges: Swaps can range from short-term (less than a year) to very long-term (over 30 years).
Types of Swaps in Foreign Markets
1. Interest Rate Swaps (IRS)
An interest rate swap is an agreement where two parties exchange interest payments, typically one fixed rate for one floating rate, on a notional principal amount.
Example: Company A pays fixed 5% interest while receiving LIBOR + 0.5% from Company B.
Usage in foreign markets: Multinational corporations often issue bonds in foreign currencies and then use IRS to manage interest rate exposure.
2. Currency Swaps
A currency swap involves exchanging principal and interest payments in one currency for principal and interest in another currency.
Example: A U.S. company needing euros can swap U.S. dollar payments with a European firm needing dollars.
Significance: Currency swaps are crucial in international finance because they allow companies to obtain foreign currency funding without directly entering the bond markets.
3. Cross-Currency Interest Rate Swaps (CCIRS)
A hybrid form where both currency and interest rate exposures are swapped. It’s common for institutions engaged in global trade and investment.
4. Commodity Swaps
Although less directly linked to currencies, commodity swaps affect global markets. For example, an oil-importing country may hedge price fluctuations by engaging in swaps with oil exporters.
5. Credit Default Swaps (CDS)
These protect against default on debt obligations. While not currency-based, CDS became highly visible during the 2008 Global Financial Crisis and remain a significant global derivative.
Mechanics of Swap Trading
Negotiation and Agreement: Two parties agree on the notional amount, payment dates, interest rate benchmarks, and currencies involved.
Cash Flow Exchanges: On each payment date, cash flows are exchanged as per the agreement.
Settlement: Settlements may be netted (only differences exchanged) or gross (full payments made in respective currencies).
Duration and Termination: Swaps usually last several years but can be terminated early through mutual agreement or by entering into an offsetting swap.
Applications of Swaps in Foreign Markets
1. Hedging
Companies hedge against foreign currency fluctuations when repaying overseas loans.
Importers/exporters lock in favorable exchange rates to protect profit margins.
2. Speculation
Traders take positions on expected changes in interest rates or currency values.
Hedge funds often speculate using cross-currency swaps.
3. Arbitrage
Exploiting differences between interest rates or currency values in different markets.
4. Liquidity Management
Central banks use swaps to provide liquidity in foreign currencies during crises (e.g., Fed swap lines during 2008 and COVID-19 crises).
Global Examples of Swap Usage
U.S. and Europe: Major banks like JPMorgan, Deutsche Bank, and Barclays dominate swap markets.
Asia: Corporations in India, China, and Japan use swaps to manage cross-border investments and trade.
Emerging Markets: Swaps help governments manage external debt denominated in foreign currencies.
Risks in Swap Trading
Credit Risk (Counterparty Risk): If one party defaults, the other may face significant losses.
Market Risk: Movements in interest rates or exchange rates may turn against a party’s position.
Liquidity Risk: Difficulty in unwinding a swap position before maturity.
Operational Risk: Errors in valuation, settlement, or reporting.
Systemic Risk: As swaps are massive in scale, failures in this market can have global implications (e.g., Lehman Brothers’ collapse).
Regulatory Framework
After the 2008 Global Financial Crisis, regulators imposed stricter rules on swaps:
Dodd-Frank Act (U.S.): Mandated central clearing and trade reporting of certain swaps.
EMIR (EU): Similar framework requiring transparency and clearing obligations.
BIS and IOSCO Guidelines: Global bodies ensuring harmonization of rules.
Central clearing via institutions like the London Clearing House (LCH) reduces counterparty risk and increases transparency.
Benefits of Swaps in Foreign Markets
Cost Efficiency: Companies can borrow in favorable markets and swap to required currencies.
Flexibility: Highly customizable structures for specific needs.
Risk Management: Effective hedging against currency and interest rate risks.
Access to Capital: Enables smaller firms and emerging economies to access global funding.
Challenges and Criticisms
Complexity: Difficult for smaller firms to understand and manage.
Systemic Risk: Can amplify crises if misused.
Transparency Issues: OTC nature makes it harder to monitor exposures.
Dependence on Benchmarks: LIBOR scandals highlighted manipulation risks.
The Future of Swap Trading
Transition from LIBOR to SOFR and Other Risk-Free Rates (RFRs): This shift will reshape interest rate swaps globally.
Digital Transformation: Blockchain and smart contracts may increase transparency and reduce operational risks.
Growth in Emerging Markets: Rising global trade will expand demand for currency and cross-currency swaps.
Climate Finance: Green swaps may emerge to align with sustainability goals.
Conclusion
Swap trading in foreign markets is not just a financial innovation; it is the backbone of modern global finance. Whether it is a multinational corporation hedging currency exposure, a government managing external debt, or a central bank stabilizing markets, swaps provide the flexibility, efficiency, and liquidity needed in today’s interconnected world.
While they offer immense benefits, the risks and systemic challenges cannot be ignored. Strong regulation, transparency, and technological evolution will shape the next phase of swap trading. For traders, corporations, and policymakers alike, understanding swaps is essential to navigating the complexities of global finance.
Market Structure is Actually EASY- Hear me outUnderstanding Market Structure Through Arcs
Market structure always seems simple when explained on YouTube. But open up a chart, and suddenly it feels puzzling, inconsistent, even frustrating. Imagine this: you’re analyzing the structure of a forex pair, confidently tracking highs and lows. Everything makes sense. Then you switch to a different pair—or even just a different date on the same chart—and suddenly it feels like your skill vanished. Yesterday you “understood” market structure, but today you don’t. So, what’s happening?
The truth is, when this confusion sets in, it’s usually because you’re looking for the wrong signs. Traders often get caught up searching for zigzags, breaks of structure (BoS), market shifts, supply and demand zones, or liquidity sweeps. But the key to truly understanding market structure comes down to one core skill: identifying strong and weak structures.
Redefining Market Structure
Market structure is not simply a zigzag. It’s not just supply and demand. Market structure is a collection of structures that, when viewed together, naturally form zigzags, supply/demand areas, and BoS/market shift levels.
And here’s the important part: not all structures are created equal. But don’t worry—you don’t need to memorize dozens of “types.” There are only two: strong structures and weak structures.
How to Identify Structures
This is where things get surprisingly simple. To identify structure, look for arcs. Yes—the charting tool no one ever uses. An arc represents price dipping and then returning to its prior high or low.
• If price closes beyond the previous high/low, the structure is strong.
• If price fails to break the previous high/low and closes within it, the structure is weak.
That’s it. Look at the chart example provided—you’ll see how clear this becomes once you train your eye. The Red/Green arcs represent arcs that were identified on the D timeframe (HTF). The blue squiggly line represents a collection of arcs identified on the 4h timeframe (LTF).
Multi-Timeframe Power
Here’s where arcs become even more powerful. A structure on one timeframe (say, the 4H) is essentially a supply/demand zone. Drop down to a lower timeframe (4H → 1H), and that same structure becomes a full swing move. This allows you to navigate multiple timeframes seamlessly—simply by plotting structures on the higher timeframe.
The Arc as the Foundation
Once you learn to spot arcs, everything clicks into place. An arc is supply and demand. It is liquidity boundaries. It defines strong/weak highs and lows. It creates the zigzag. In short: structure identification is the only skill you need to master market structure—and it’s surprisingly quick to learn.
Additional Notes
• A valid arc requires at least three candles. Anything less is not structure.
• Two candles may represent a reaction to supply/demand or a liquidity sweep, but they don’t form a structure.
• Why? Because structure requires balance—a brief pause where price enters, slows, stabilizes, and then reverses. That balancing process cannot be captured in one or two candles.
My Advice
For now, set aside the broader concept of “market structure” and focus only on arcs.
1. Practice identifying arcs in live price action—don’t worry about backtesting yet.
2. Mark them on your chart, and classify them as strong or weak.
3. Once you’re comfortable spotting them, move into backtesting. Watch arcs unfold in motion.
4. With enough practice, you’ll be able to recognize them instantly and without hesitation.
That’s when you return to market structure as a whole. With the skill of arc recognition in place, you’ll finally see how everything ties together—and your understanding will be unshakable.
Previous Post; Complete Market Structure: Order Flow and Multiple Timeframes
Although I felt that this was a great take on market structure, the indicator provided falls short in a sense that market it relies on alternating internal shifts, when in market structure shifts can happen consecutively instead of strictly alternating. I have developed a different tool that will help identify structural levels without missing a single arc. It is called Supply/Demand Zones (Synthetic SMA Candles). I will provide a link below. It identifies arcs and classifies them as supply/demand zones. It also provides alerts which can be helpful if you are the type of trader that likes to trade passively without being glued to the charts.
Arc Identifying Indicator (Supply/Demand)