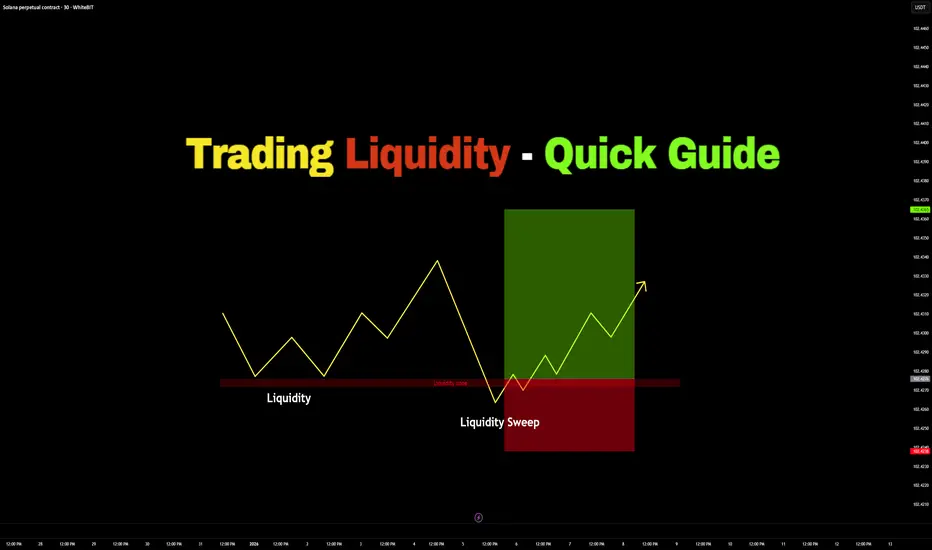
Trading Liquidity – Quick Guide in 5 StepsWelcome back everyone to another guide, today we will speed run "Trading Liquidity" in a quick 5 step guide. Be sure to like, follow and join the community!
1) Identify Liquidity:
- Equal highs or cluster of highs (Buy-side Liquidity)
- Equal lows or cluster of lows (Sell-side Liquidity)
- Obvious highs & lows
2) Identify Liquidity Direction (Price moves towards liquidity first):
- Equal highs > Price is likely to sweep above
- Equal lows > Price is likely to sweep below
3) Wait for Liquidity Sweeps
- Price takes out lows
- Stops get triggered
- Look for rejection or close back inside
Do NOT enter before the sweep or before the confirmation.
4) Enter Trade:
Enter after confirmation, away from liquidity
- Stop loss: Longs > Below Swept Lows
- Stop loss: Shorts > Above Swept Highs
5) Take Profits:
- Take Profit: Nearest opposing liquidity
- Take Profit: Previous high/low
- Take Profit: Range boundaries
RESULTS:
Liquidity sweep > confirmation > clean move
Thank you all so much for reading! Hopefully this is a useful guide in the future or present! If you would like me to make any simplified guides, articles or tutorials, let me know in the comment section down below - or even contact me through trading view.
Thank you!
Chart Patterns
Gold doesn’t hate you. Gold just loves… your liquidity.If you’ve ever felt like XAUUSD has a personal grudge against you — price spikes the moment you enter, sweeps your SL perfectly, then runs strongly in your predicted direction right after you exit — take a breath. Pause for a second.
The gold market doesn’t move based on emotions.
It moves based on liquidity — the fuel behind every major move .
1. Retail traders trade price. Institutions trade orderflow.
You look at the chart to find a perfect entry.
Institutions look at the chart to find where the most SL and pending orders are stacked.
To them, it’s not a “resistance zone” — it’s a liquidity pool.
When retail SL gets triggered, it turns into market orders.
And those market orders become the free matching engine for big players to enter without excessive slippage.
You think you’re protecting your risk with SL.
The market thinks you’re placing free orders for them to fill their positions.
2. Gold loves clean levels because SL sits at clean levels.
Liquidity sweep zones usually share the same traits:
- Recent highs/lows everyone can see
- Support/resistance that looks clean and easy to draw
- Attractive round numbers like 2,700 – 2,650 – 2,600…
These areas are liquidity magnets, not breakout signals.
3. “Sweep then run” is a process, not an exception.
A major gold move typically has 2 phases:
- Liquidity grab (SL sweep, pending activation)
- Expansion (the real trend begins)
Most traders lose because they confuse phase 1 with phase 2.
Retail sees a spike → fear trend break.
Institutions see a spike → mission accomplished, liquidity collected, positions filled.
4. The market doesn’t need you to be wrong — it only needs you forced out.
Gold doesn’t need to prove your analysis was bad.
It just needs enough volatility to make you:
- Hit SL
- Or close manually out of panic
Either way, the market gets the liquidity you left behind.
5. Trading maturity = not turning yourself into liquidity.
You don’t need to remove SL. You just need to:
- Place SL where the structure is truly invalidated, not where liquidity is obvious
- Enter after liquidity is swept, not before
- Keep margin to reposition during pullbacks
- Understand: being right isn’t enough — you must be right at the right time.

Gold Rewards Timing, Not Activity🟡 Gold Rewards Timing, Not Activity ⏳✨
Gold is not a market that rewards constant action.
It rewards waiting, observation, and precise timing.
Many traders believe that trading more means earning more. In Gold, this mindset often leads to overtrading, emotional decisions, and unnecessary losses.
⏱️ 1. Gold Moves in Phases, Not Constant Trends
Gold spends a large amount of time in:
consolidation 🔄
slow accumulation 🧩
controlled ranges 📦
During these phases, price appears “boring,” but the market is actually preparing.
Trading aggressively in these conditions usually means trading noise, not opportunity.
🧠 2. Activity Feeds Emotions, Timing Controls Risk
High activity leads to:
impatience 😤
forced entries 🎯
emotional exits ❌
Good timing, on the other hand, comes from:
understanding context 🧭
waiting for price to show intent 📊
acting only when conditions align ✅
Gold punishes impatience faster than most markets.
🏦 3. Institutions Trade Less, But Trade Better
Large players do not chase every candle.
They wait for:
liquidity to build 💧
weak hands to exit 🧹
price to reach meaningful zones 📍
When timing is right, Gold often moves fast and decisively — leaving overactive traders behind.
⚡ 4. Big Gold Moves Come After Quiet Periods
Some of the strongest Gold expansions begin after:
low volatility 😴
reduced participation 📉
trader boredom 💤
This is why patience is not passive — it is strategic.
🧩 Key Insight
In Gold, doing less at the right time often outperforms doing more at the wrong time.
🎯 Final Takeaway
❌ More trades ≠ more profits
✅ Better timing = cleaner execution
🟡 Gold rewards discipline, context, and patience
Master timing, and activity will take care of itself.

The Liquidity Map: How Smart Money Actually Moves
Price Doesn't Move Randomly — It Hunts Liquidity
Every time you place a stop loss, you're adding to a liquidity pool.
Every time price "randomly" spikes to hit your stop before reversing, it wasn't random at all.
Understanding liquidity is understanding why price moves the way it does — and AI is getting very good at mapping these invisible pools.
---
What Is Liquidity?
Simple Definition:
Liquidity is the ability to buy or sell without significantly moving the price.
In Practice:
Liquidity exists where orders are clustered:
Stop losses (become market orders when triggered)
Limit orders (resting buy/sell orders)
Pending orders (orders waiting to execute)
The Key Insight:
Large players need liquidity to fill their positions. They can't just buy 10,000 contracts at market — they need someone to sell to them.
Where do they find sellers? Where stop losses are clustered.
---
Types of Liquidity Zones
1. Buy-Side Liquidity (BSL)
Located ABOVE price action:
Stop losses from short positions
Buy stop orders from breakout traders
Triggered when price moves up
2. Sell-Side Liquidity (SSL)
Located BELOW price action:
Stop losses from long positions
Sell stop orders from breakdown traders
Triggered when price moves down
3. Equal Highs/Lows
Multiple touches at the same level:
Creates obvious stop placement
Attracts more orders over time
High-probability liquidity targets
4. Swing Points
Previous highs and lows:
Natural stop loss placement zones
Visible to all market participants
Frequently targeted before reversals
---
Why Price "Hunts" Liquidity
The Mechanism:
Retail traders place stops at obvious levels
These stops accumulate into liquidity pools
Large players need this liquidity to fill positions
Price is drawn to these pools
Stops trigger, providing liquidity
Large players fill their orders
Price reverses
This Isn't Conspiracy — It's Market Structure
Large orders need counterparties. If a fund wants to buy 50,000 shares, they need 50,000 shares worth of sellers. Stop losses, when triggered, become market sell orders — perfect liquidity for buyers.
---
How AI Maps Liquidity Zones
Method 1: Swing Point Detection
AI identifies:
Recent swing highs (potential BSL)
Recent swing lows (potential SSL)
Multiple touches at same level (stronger zones)
Method 2: Order Flow Analysis
Where available, AI analyzes:
Resting limit orders in the book
Historical order placement patterns
Volume profile at price levels
Method 3: Pattern Recognition
AI identifies formations that create liquidity:
Equal highs/lows (obvious stops)
Trendline touches (stops below/above)
Range boundaries (stops outside range)
Method 4: Historical Stop Placement
Machine learning on:
Where stops typically cluster relative to patterns
How far from entry traders usually place stops
Common ATR multiples for stop distance
---
Liquidity Concepts in Practice
Concept 1: Liquidity Sweep
Price moves to take out a liquidity zone, then reverses.
Identification:
Price breaks above/below a key level
Quick rejection (wick or immediate reversal)
Often accompanied by volume spike
Trading Application:
Wait for the sweep before entering in the opposite direction.
---
Concept 2: Liquidity Void (Fair Value Gap)
Areas where price moved so fast that no trading occurred.
Identification:
Gap between candle bodies
No overlap in price action
Often created during news or high momentum
Trading Application:
Price often returns to fill these voids before continuing.
---
Concept 3: Liquidity Grab
Intentional move to trigger stops before the real move.
Identification:
Sharp move into obvious stop zone
Immediate reversal
Often occurs before significant moves
Trading Application:
Don't place stops at obvious levels. Wait for grabs before entering.
---
Building a Liquidity-Aware Strategy
Step 1: Identify Key Levels
Mark on your chart:
Recent swing highs (BSL zones)
Recent swing lows (SSL zones)
Equal highs/lows
Obvious trendline touches
Step 2: Anticipate Liquidity Hunts
Before entering, ask:
Where is the nearest liquidity pool?
Is price likely to sweep that level first?
Should I wait for the sweep?
Step 3: Place Stops Intelligently
Instead of obvious levels:
Beyond the liquidity zone (not at it)
Use ATR-based stops that adapt to volatility
Consider time-based exits instead of price-based
Step 4: Use Liquidity as Entry Trigger
Enter AFTER liquidity is taken:
Wait for sweep of key level
Confirm with reversal candle or structure
Enter with stop beyond the sweep
---
Common Liquidity Mistakes
Placing Stops at Round Numbers — $100, $50, $10 — everyone sees these. So does the algorithm hunting stops.
Stops Just Below Support — If you can see the support, so can everyone else. Stops cluster just below.
Ignoring the Sweep — Entering at support without waiting for the liquidity grab often means getting stopped out on the sweep.
Fighting Liquidity Flow — If price is clearly hunting liquidity in one direction, don't stand in front of it.
---
AI-Enhanced Liquidity Trading
What AI Can Do:
Map All Liquidity Zones — Scan multiple timeframes and instruments simultaneously
Rank Zone Importance — Weight zones by age, touches, and volume
Predict Sweep Probability — Based on current momentum and zone proximity
Alert on Sweeps — Real-time notification when liquidity is taken
Optimize Stop Placement — Calculate stops that avoid obvious liquidity pools
---
Liquidity Zone Checklist
Before entering any trade:
Where is the nearest BSL (above price)?
Where is the nearest SSL (below price)?
Has recent liquidity been swept?
Is my stop at an obvious level?
Am I entering before or after the liquidity grab?
---
Key Takeaways
Liquidity zones are where stop losses and pending orders cluster
Price is drawn to liquidity — large players need it to fill positions
AI can map and rank liquidity zones across multiple timeframes
Smart traders wait for liquidity sweeps before entering
Stop placement should avoid obvious liquidity pools
---
Your Turn
Have you noticed price "hunting" your stops before reversing?
How do you currently think about liquidity in your trading?
Share your experiences below 👇

Options Blueprint Series [Advanced]: Structuring Long VolatilityWhy Long Volatility Matters in Euro FX Right Now
Euro FX futures offer a clean and highly liquid way to observe how macro forces, relative growth expectations, and monetary policy differentials express themselves through price. While directional narratives often dominate discussion, options markets frequently reveal a different story — one centered on volatility pricing rather than directional certainty.
This Options Blueprint focuses on Euro FX futures (6E) and Micro EUR/USD futures (M6E) during a period when implied volatility is historically compressed, while price structure suggests an elevated probability of expansion. The purpose of this case study is not to anticipate direction, but to explore how options structures can be engineered to respond to range resolution risk when price compression and technical conflict coexist.
This article is strictly educational and illustrative, designed to demonstrate principles of volatility analysis, options structure design, and risk management.
Volatility Context: Reading Implied Volatility with CVOL
Implied volatility reflects the market’s collective expectation of future price variability. When implied volatility is elevated, options tend to price in larger potential moves. When it is compressed, options reflect an assumption of relative calm.
In this case, the CVOL index for Euro FX futures is observed at relatively low levels compared to its behavior earlier in the year. While CVOL is not predictive, it provides valuable context: the market is currently assigning a lower probability to large price swings than it has at other times.
Periods of compressed implied volatility are noteworthy because price expansion often follows periods of contraction, particularly when price structure begins to show signs of instability. This does not guarantee movement, but it shifts the analytical focus toward strategies that can benefit from expansion rather than stagnation.
Technical Landscape: A Market at an Inflection Point
From a structural perspective, Euro FX futures present a rare but important configuration: conflicting continuation and reversal patterns.
A bullish flag has developed following an impulsive advance, suggesting the potential for trend continuation.
Simultaneously, a double top formation has emerged, introducing the possibility of a downside resolution.
When viewed in isolation, each pattern offers a directional narrative. When viewed together, they create directional ambiguity but expansion risk clarity. In other words, the market may not be signaling where it intends to go — but it is signaling that remaining stagnant may be increasingly difficult.
This type of structural conflict is often where volatility-focused strategies become more relevant than directional trades.
Mapping Price Targets to Market Structure
Technical patterns are most useful when they provide reference points, not predictions. In this case, both patterns generate projected levels that act as structural guideposts.
The bullish flag projects an upside objective near 1.2116, which also aligns with a clearly defined UFO resistance zone.
The double top projects a downside objective near 1.1618, aligning with a well-defined UFO support zone.
These levels form a structural range boundary. Price acceptance beyond either boundary would represent meaningful resolution of the current compression phase. For options traders, these projected zones are valuable because they provide logical strike selection reference points when designing volatility structures.
Strategy Foundation: The Role of a Long Straddle
A traditional long straddle involves purchasing both a call and a put at the same strike, typically near the current price. This structure is directionally neutral and benefits from large price movements in either direction.
The strength of a long straddle lies in its convexity. Its primary weakness lies in time decay, particularly when implied volatility is low and price remains range-bound.
In compressed volatility environments, a pure long straddle can be inefficient if price takes time to resolve. This is where structure refinement becomes essential.
Strategy Evolution: Structuring an Asymmetric Long Volatility Approach
Instead of relying on a textbook long straddle, this Options Blueprint explores an asymmetric volatility structure designed to reflect the underlying technical landscape.
The structure begins with a long at-the-money straddle, capturing core volatility exposure:
Long 1.175 Call
Long 1.175 Put
To refine the payoff and reduce exposure to time decay, options are sold at technically
meaningful projected targets:
Short 1.21 Call
Short 1.16 Put
This transforms the strategy into a defined-risk, asymmetric volatility structure.
Key educational concepts illustrated by this construction:
The long options capture expansion risk near the current price.
The short options align with projected structural boundaries.
The payoff becomes skewed, favoring upside expansion while still allowing for limited downside participation.
Theta exposure is reduced compared to a pure long straddle.
The goal is not optimization, but intentional payoff shaping based on structure.
Risk Profile Analysis: Understanding the Payoff Diagram
The resulting risk profile highlights several important principles.
Maximum risk occurs if price remains trapped between the short strikes into expiration.
Upside expansion toward the upper projected level produces the most favorable outcome.
Downside expansion produces a smaller, but still positive, outcome.
Both risk and reward are defined, removing uncertainty around extreme scenarios.
This structure favors movement over stagnation, reflecting the belief that expansion risk outweighs the likelihood of prolonged consolidation — without requiring directional conviction.
Contract Specifications
Euro FX futures are available in both standard and micro formats.
o 6E (Euro FX Futures)
Larger notional exposure
Suitable for accounts with higher margin tolerance
o M6E (Micro EUR/USD Futures)
One-tenth the size of the standard contract
Greater flexibility for position sizing
Often useful for testing or scaling strategies
Both contracts reference the same underlying market structure, allowing the same analytical framework to be applied across different risk profiles.
Margin requirements vary and are subject to change, making position sizing and risk definition essential considerations when selecting between standard and micro contracts.
Euro FX futures (6E) have a tick size of 0.000050 per Euro increment = $6.25 tick value and currently require roughly ~$2,700 in margin per contract, while Micro EUR/USD Futures (M6E) use a 0.0001 tick size per euro = $1.25 tick value and margin closer to ~$270.
Risk Management Considerations
Options strategies are not defined solely by payoff diagrams — they are defined by how risk is managed over time.
Key considerations include:
Sizing positions so that the maximum loss is acceptable within the broader portfolio context.
Understanding how time decay accelerates as expiration approaches.
Recognizing that volatility expansion does not occur on a fixed schedule.
Accepting predefined loss zones as part of the structure rather than reacting emotionally.
Risk management is not about avoiding losses; it is about controlling exposure to uncertainty.
Key Takeaways from This Options Blueprint
Implied volatility provides context, not direction.
Conflicting chart patterns often increase expansion risk.
Options structures can be shaped to reflect technical asymmetry.
Modifying classic strategies can improve alignment with market conditions.
Defined risk and intentional design matter more than prediction.
This case study demonstrates how volatility, structure, and risk management intersect — without requiring directional forecasts.
Data Consideration
When charting futures, the data provided could be delayed. Traders working with the ticker symbols discussed in this idea may prefer to use CME Group real-time data plan on TradingView: www.tradingview.com - This consideration is particularly important for shorter-term traders, whereas it may be less critical for those focused on longer-term trading strategies.
General Disclaimer
The trade ideas presented herein are solely for illustrative purposes forming a part of a case study intended to demonstrate key principles in risk management within the context of the specific market scenarios discussed. These ideas are not to be interpreted as investment recommendations or financial advice. They do not endorse or promote any specific trading strategies, financial products, or services. The information provided is based on data believed to be reliable; however, its accuracy or completeness cannot be guaranteed. Trading in financial markets involves risks, including the potential loss of principal. Each individual should conduct their own research and consult with professional financial advisors before making any investment decisions. The author or publisher of this content bears no responsibility for any actions taken based on the information provided or for any resultant financial or other losses.

The Language of Price | Lesson 15 – Chart Patterns TheoryLesson Focus: Chart Pattern Types (Theory)
This educational chart explains what chart patterns are and how they are used as visual tools to understand market structure and historical price behavior.
Chart patterns do not predict or cause price movement.
They visually represent past interactions between buyers and sellers , helping us observe how market participation has previously behaved at certain price areas.
📌 WHAT IS A CHART PATTERN?
A chart pattern is a recurring price structure that forms as a result of:
• buying and selling pressure
• price compression or expansion
• repeated market reactions at specific price zones
Chart patterns are descriptive, not predictive.
They are used to study historical market behavior , not to provide trading instructions.
📊 TYPES OF CHART PATTERNS USED IN THIS EDUCATION
Double Top
A price structure where the market fails twice to continue higher, often reflecting increased selling pressure near a resistance area.
Double Bottom
A structure where price finds support twice at a similar level, showing repeated buying interest in the same price zone.
Rising Wedge
A contracting structure where price moves upward with decreasing momentum, illustrating gradual loss of bullish pressure.
Falling Wedge
A downward contracting structure that reflects weakening selling pressure over time.
Ascending Triangle
A pattern formed by rising lows and a horizontal resistance, showing increasing demand at higher price levels.
Descending Triangle
A pattern with falling highs and horizontal support, representing persistent selling pressure against a fixed price area.
Symmetrical Triangle
A balanced price compression where buying and selling pressure converge, indicating market indecision and reduced volatility.
Ascending Channel
A structured upward price movement within parallel boundaries, reflecting controlled bullish participation.
Descending Channel
A structured downward movement within parallel boundaries, showing controlled bearish participation.
Horizontal Channel
A range-bound structure where price moves sideways, representing temporary equilibrium between buyers and sellers.
🧩 KEY EDUCATIONAL CONCEPT
Candlesticks and chart patterns do not move price.
They reflect historical decisions made by market participants.
Market structure becomes clearer when we focus on:
• price interaction zones
• pressure buildup and release
• collective participant behavior
rather than treating patterns as standalone decision tools.
📘 SERIES NOTE
This lesson introduces the theoretical foundation of chart patterns.
Practical examples will follow in the next lessons.
If you find this educational series useful, you may follow the profile to continue exploring market structure concepts step by step.
ETHICAL & EDUCATIONAL NOTICE
This content is presented solely for educational and analytical purposes , based on historical price data.
It does not promote or encourage any specific trading method, financial instrument, gambling, leverage, margin usage, short selling, or interest-based activity .
Readers are encouraged to align any financial activity with their own ethical, legal, and religious principles .
⚠️ DISCLAIMER
This material is strictly educational and informational .
It does not constitute financial advice, investment recommendations, or trading instructions.
The author does not provide personalized guidance.
Any decisions made based on this content are the sole responsibility of the individual.

The Language of Price | Lesson 14 –Candlesticks + S&R Practice 3Educational Context
This lesson is a practical continuation of the previous ranging market theory.
It demonstrates how Candlesticks and Support & Resistance interact inside a balanced (range-bound) market using real-chart illustrations.
↔️ Price oscillates between boundaries
⬆️ Upper boundary → Resistance
⬇️ Lower boundary → Support
The objective is to improve structural reading and price behavior awareness , not prediction.
Scenario 1 – Fresh Resistance Reaction
⬆️ Resistance
• Fresh formed
🕯️ Candlesticks
• Inverse long wick
• Inside candle
• Momentum
🧠 Illustrated Interpretation
↳ Price pushes up ⬆️ into resistance
↳ Upper rejection appears 🛑
↳ Inside candle reflects hesitation
↳ Momentum slows near the range ceiling
📌 Range structure remains intact
Scenario 2 – Fresh Support With Strong Reaction
⬇️ Support
• Fresh formed
• Huge move away
🕯️ Candlesticks
• Change color
• Inverse long wick
🧠 Illustrated Interpretation
↳ Price drops into support ⬇️
↳ Strong rejection triggers displacement
↳ Color change signals shift in pressure
↳ Market responds decisively from the range low
📌 Support validated structurally
Scenario 3 – Resistance With Two Rejections
⬆️ Resistance
• 2 rejections
• Fresh formed
• Swing high
• Huge move away
🕯️ Candlesticks
• Shrinking candles
• 2 inverse long wicks
• Change color
• Momentum
🧠 Illustrated Interpretation
↳ Price fails twice at resistance 🔁
↳ Shrinking candles show reduced buying
↳ Rejections confirm supply dominance
↳ Momentum aligns with range rejection
📌 Resistance becomes structurally respected
Scenario 4 – Support With Two Rejections
⬇️ Support
• 2 rejections
• Fresh formed
• Swing low
• Huge move away
🕯️ Candlesticks
• Shrinking candles
• 2 inverse long wicks
• Long wick
🧠 Illustrated Interpretation
↳ Multiple failures to break support ⛔
↳ Wicks show absorption of selling
↳ Price reacts strongly away from the zone
↳ Range floor remains protected
📌 Balance maintained inside the range
Scenario 5 – Resistance With Three Rejections
⬆️ Resistance
• 3 rejections
• Fresh formed
• Swing high
• Huge move away
🕯️ Candlesticks
• Long wick
• Inside candle
🧠 Illustrated Interpretation
↳ Repeated rejection at the same level 🔒
↳ Long wicks show persistent selling pressure
↳ Inside candle highlights consolidation at supply
↳ No breakout confirmation present
📌 Range ceiling clearly defined
Scenario 6 – Support With Three Rejections
⬇️ Support
• 3 rejections
• Fresh formed
• Swing low
• Huge move away
🕯️ Candlesticks
• Long wick
• Momentum
🧠 Illustrated Interpretation
↳ Price repeatedly rejected below support ⛔⬇️
↳ Strong reactions confirm demand presence
↳ Momentum supports continuation inside the range
📌 Support acts as a stable balance zone
Key Educational Insight
🧩 Candlesticks → describe reaction
📐 Support & Resistance → define boundaries
➡️ In ranging markets, context matters more than direction .
ETHICAL & EDUCATIONAL NOTICE
This content is presented solely for educational and analytical purposes , based on historical price data.
It does not promote or encourage any specific trading method, financial instrument, gambling, leverage, margin usage, short selling, or interest-based activity .
Readers are encouraged to align any financial activity with their own ethical, legal, and religious principles .
⚠️ DISCLAIMER
This material is strictly educational and informational .
It does not constitute financial advice, investment recommendations, or trading instructions.
The author does not provide personalized guidance.
Any decisions made based on this content are the sole responsibility of the individual.

WHAT AMOUNT OF YOUR CAPITAL SHOULD YOU RISK PER TRADEAlmost every chart has the projection tool
How do you use it?
I only explained how to properlly user to maximize your WINs and reduce your loses.
Enkoy and #tradesmartly

EURUSD x DXY | Simple but Powerful EURUSD x DXY | Simple but Powerful
EURUSD confirms trend reversal
(Dowtrend break → structure shift → retest AOI)
DXY confirms trend weakness
(Uptrend break → higher low broken → AOI retest)
📌 Correlation is clear:
Weak DXY = Strength on EURUSD
🔎 Bias from Daily,
⏱ Entries only on lower timeframes with confirmation.
Simple structure. Smart patience. 💪📊
Same scenario repeating…
Do you see it too? 👀
DXY frame 1D
EURUSD frame 1D

the Fed faces another slew of challenges in the year aheadThe Federal Reserve heads into 2026 facing a slew of political and policy challenges, headlined by a new chair and an economy fed by both tailwinds and headwinds that will make policymakers’ choices all the more important.
Coming off three consecutive interest rate cuts, the central bank is expected to follow a more tepid path for the year ahead in which additional cuts could be hard to come by considering expectations for solid growth and ongoing inflation pressures.
One thing does seem certain: After a year of extraordinary upheaval surrounding the Fed, 2026 looks to offer more of the same.
“I do think there’ll be a big spotlight. There’ll be lots of intrigue,” said Kathy Bostjancic, chief economist at Nationwide. “There’s still a lot of uncertainty that keeps the Fed in the spotlight, and probably in the hot seat too.”
The previous year saw the Fed come under that spotlight in ways that it never had before.
As he started his second term at the White House, President Donald Trump repeatedly threatened to fire Fed Chair Jerome Powell for not being quicker to push for interest rate cuts. Around mid-year, the Fed came under fire again, this time for cost overruns at a renovation project it had undertaken at its Washington headquarters.
In between, Trump tried to remove Governor Lisa Cook over allegations — as yet unproven and not even brought as formal charges — that she committed mortgage fraud. That all came against a backdrop of who would succeed Powell as chair when his term expires in May, with as many as 11 candidates considered during an interview process led by Treasury Secretary Scott Bessent.
If all that sounds exhausting, consider that 2026 begins with a Supreme Court hearing scheduled for Jan. 21 to decide whether Trump has the authority to remove Cook. A week later, the Federal Open Market Committee holds its interest rate vote. At some point during the month, Trump is expected to unveil his choice for Fed chair. And Powell, cagey on the issue so far, also will have to disclose whether he plans on serving out his term on the Board of Governors that runs until January 2028.
There also have been multiple dissents at recent rate votes, and new regional presidents set to come on board at the FOMC have a hawkish bent, meaning they’re likely to resist additional cuts.
“It’s still a tough spot for the Fed,” Bostjancic said.
Focus on policy
Still, when it comes to policy, most on Wall Street expect the Fed to put the noise in the background and continue down the road of lowering its benchmark interest rate just a bit more until it gets closer to a neutral level around 3%. Neutral is considered a spot that neither boosts nor holds back economic activity, and the funds rate is just half a percentage point above where most on the FOMC see the rate landing over the long term.
“Chair Powell helped orchestrate three 25-basis-point rate cuts in a row. It’s not as if he was standing in the way of the FOMC cutting rates,” Bostjancic said. As far as further cuts go, “For us, it’s the economic data.”
Bostjancic sees the data pointing to two cuts this year, one around mid-year and another toward the end. The Fed’s “dot plot” grid of expectations indicates just one cut, while outliers such as Moody’s Analytics chief economist Mark Zandi and Citigroup seeing labor market weakness pointing to three.
Powell and his colleagues have stood by the notion that they won’t be bullied into cuts and indeed will be guided by data.
Torsten Slok, chief economist at Apollo Global Management, thinks the economy will be too strong for the Fed to cut much more, seeing just one reduction ahead.
“The issue is that the winds are really changing for the U.S. economy,” Slok said during a CNBC interview Friday.
Whereas 2025 saw headwinds of tariffs, inflation and a general air of uncertainty, fiscal stimulus and a stabilizing labor market will be pushing on growth, he said.
“It is, in my view, looking like more that the tailwinds are beginning to accumulate and making it more difficult for the Fed to cut rates this year,” Slok added.
The role of AI
One wildcard will be the role that artificial intelligence plays on economic growth.
Seen as both a productivity enhancer and a potential impediment to hiring, assessing the impact AI is having on the economy will be paramount for the Fed, said Joseph Brusuelas, chief economist at RSM.
“The Fed this year has got a real challenge in terms of communicating their strategy,” Brusuelas said. “We have this massive investment flowing into very sophisticated technologies, and the Federal Reserve is going to need to communicate their basic view on what this means.”
After sputtering at the beginning of 2026, the economy grew rapidly in the middle two quarters and is on pace to accelerate at a 3% pace in the fourth quarter, according to preliminary data from the Atlanta Fed.
In addition to helping push along the broader economy, AI-related stocks were a key highlight of another stellar year on Wall Street that saw major averages post double-digit increases.
Calibrating monetary policy in that kind of environment will be tough, Brusuelas said.
“They’re going to need to provide strategic direction for the central bank at a time when the economy is clearly pivoting towards the integration of this sophisticated technology in the production of goods and provision of services,” he said. “This is a really big potential pivot around policy that needs to happen.”

Exotic Option Structured ProductsAdvanced Instruments for Customized Risk–Return Profiles
Exotic option structured products are sophisticated financial instruments designed by combining traditional securities with exotic derivatives to create customized payoff structures. Unlike plain vanilla options such as simple calls and puts, exotic options embed complex features—path dependency, multiple underlying assets, conditional triggers, or non-standard expiration rules. When these options are packaged into structured products, they offer tailored solutions to investors seeking specific risk–return outcomes, yield enhancement, capital protection, or exposure to particular market views.
Understanding Structured Products
Structured products are pre-packaged investment strategies, typically issued by banks or financial institutions, whose returns depend on the performance of one or more underlying assets such as equities, indices, interest rates, commodities, or currencies. They are usually composed of two main components:
A fixed-income element (such as a bond or zero-coupon bond) that provides capital protection or income stability.
A derivative component (options or swaps) that delivers market-linked returns.
When exotic options are used instead of standard options, the product becomes an exotic option structured product. These structures allow issuers to engineer highly specific payoff profiles that cannot be easily replicated through direct market trading.
What Makes an Option “Exotic”?
Exotic options differ from vanilla options in their payoff complexity and conditions. Some defining characteristics include:
Path dependency: Payoff depends on the entire price path of the underlying, not just the final price.
Conditional triggers: Activation or deactivation occurs if certain price levels are touched.
Multiple underlyings: Returns may depend on the worst-performing or best-performing asset in a basket.
Non-standard settlement: Payoffs may occur at multiple observation dates or vary dynamically.
Examples of exotic options include barrier options, digital options, Asian options, lookback options, and rainbow options.
Common Types of Exotic Option Structured Products
Barrier-Linked Structured Notes
These products embed barrier options, where the payoff depends on whether the underlying asset crosses a predetermined barrier level.
Knock-in structures activate only if the barrier is breached.
Knock-out structures terminate if the barrier is breached.
Such products are often used to enhance yield but expose investors to sudden changes in risk if the barrier is touched.
Autocallable Structured Products
Autocallables are among the most popular exotic structured products. They include periodic observation dates. If the underlying asset trades above a predefined level on any observation date, the product automatically redeems early, paying a fixed coupon.
These products are attractive in sideways or moderately bullish markets but can expose investors to significant downside risk in sharp market declines.
Range Accrual Notes
Returns accrue only when the underlying asset remains within a specified price range. The longer the asset stays within the range, the higher the coupon earned.
These products are sensitive to volatility and are suitable when investors expect stable market conditions.
Worst-of and Best-of Structures
These products depend on the performance of multiple underlying assets.
Worst-of structures base returns on the poorest-performing asset in the basket, increasing risk but offering higher coupons.
Best-of structures benefit from the strongest performer but usually offer lower yields.
Digital and Binary Payoff Products
Digital structures pay a fixed amount if a specific condition is met (for example, the index closes above a strike level at maturity), and nothing otherwise.
They provide clear outcomes but involve all-or-nothing risk profiles.
Why Investors Use Exotic Option Structured Products
Exotic option structured products are used for several strategic reasons:
Yield Enhancement: In low-interest-rate environments, these products offer higher potential returns than traditional bonds by selling optionality.
Market View Expression: Investors can express nuanced views such as range-bound markets, mild bullishness, or low volatility expectations.
Customization: Products can be tailored to specific investment horizons, risk tolerance levels, and underlying assets.
Capital Protection (Partial or Conditional): Some structures provide capital protection unless certain adverse conditions occur.
Risks Involved in Exotic Structured Products
Despite their attractiveness, exotic option structured products carry significant risks:
Complexity Risk
The payoff mechanics are often difficult to understand, making it hard for investors to assess true risk exposure.
Market Risk
Adverse movements in the underlying asset can lead to partial or full capital loss, especially in barrier or worst-of structures.
Issuer Credit Risk
Structured products are typically unsecured obligations of the issuing bank. If the issuer defaults, investors may lose their investment regardless of market performance.
Liquidity Risk
Secondary market liquidity can be limited. Exiting the product before maturity may result in unfavorable pricing.
Model and Volatility Risk
Exotic options are highly sensitive to volatility, correlation, and pricing models. Changes in these parameters can significantly affect valuation.
Pricing and Valuation Considerations
Pricing exotic option structured products involves advanced quantitative models. Unlike vanilla options, which can often be priced using closed-form solutions, exotic options typically require numerical methods such as Monte Carlo simulations or lattice models.
Key factors influencing pricing include:
Implied volatility and volatility skew
Correlation between multiple underlyings
Interest rates and dividend assumptions
Frequency of observation dates
Barrier proximity and probability of breach
Because of this complexity, investors often rely on issuer-provided pricing, which may include embedded margins.
Role in Portfolio Construction
Exotic option structured products are generally used as satellite investments rather than core holdings. They can complement a portfolio by:
Generating income during low-growth phases
Providing differentiated return streams
Enhancing yield without full equity exposure
However, prudent allocation sizing and diversification across issuers and structures are essential to manage concentration risk.
Regulatory and Suitability Aspects
Given their complexity, regulators in many jurisdictions require enhanced disclosure and suitability assessments before these products are sold to retail investors. They are more commonly used by high-net-worth individuals, institutional investors, and professional traders who understand derivatives and structured payoffs.
Conclusion
Exotic option structured products represent the intersection of financial engineering, derivatives pricing, and customized investment solutions. They offer powerful tools for tailoring risk and return, expressing precise market views, and enhancing yield. However, these benefits come with increased complexity, opacity, and risk. Successful use of exotic option structured products requires deep understanding of derivative mechanics, careful assessment of issuer creditworthiness, and disciplined risk management. For informed investors, they can be valuable instruments—but they demand respect, due diligence, and strategic intent rather than speculative use.

Currency Trading ExposedThe Foundation of Currency Trading
At its core, currency trading involves the exchange of one currency for another. Every trade is quoted in pairs, such as EUR/USD, USD/JPY, or GBP/INR. When a trader buys a currency pair, they are buying the base currency and simultaneously selling the quote currency. Exchange rates fluctuate continuously based on supply and demand, reflecting economic strength, capital flows, interest rates, and geopolitical confidence.
Unlike stock markets, forex is decentralized. There is no single exchange. Instead, trading occurs electronically over-the-counter (OTC) through a global network of banks, institutions, brokers, and traders operating 24 hours a day, five days a week. This structure provides unmatched liquidity but also makes regulation and transparency uneven across regions.
Who Really Moves the Currency Market
A common myth is that retail traders drive currency prices. In reality, retail participation represents only a tiny fraction of total volume. The true market movers include:
Central Banks, which influence currencies through interest rates, monetary policy, and direct interventions
Commercial Banks and Financial Institutions, executing large transactions for clients and proprietary desks
Corporations, hedging currency risk arising from international trade
Hedge Funds and Asset Managers, deploying macro and speculative strategies
Governments and Sovereign Funds, managing reserves and capital flows
Retail traders operate on the margins, reacting to price movements rather than creating them. Understanding this power imbalance is crucial for realistic expectations.
What Drives Currency Prices
Currency values are shaped by a combination of fundamental, technical, and sentiment-based factors.
Fundamentally, interest rate differentials are among the most powerful drivers. Capital tends to flow toward countries offering higher real returns, strengthening their currencies. Inflation data, GDP growth, employment numbers, trade balances, and fiscal stability also play major roles.
Technically, forex markets are highly responsive to price levels, trends, support and resistance, and market structure. Because of high liquidity and institutional participation, technical analysis often works effectively—especially on higher time frames.
Sentiment reflects how market participants collectively feel about risk. In times of global uncertainty, traders flock to safe-haven currencies such as the US dollar, Japanese yen, or Swiss franc. During risk-on phases, capital shifts toward emerging market and high-yield currencies.
The Truth About Leverage
One of the most “exposed” realities of currency trading is leverage. Forex brokers offer extremely high leverage, sometimes up to 1:500. While leverage magnifies potential profits, it also magnifies losses—often wiping out accounts faster than traders expect.
Many beginners are attracted by the ability to control large positions with small capital, but this is where the market becomes unforgiving. Without disciplined risk management, leverage turns forex trading into a probability-defying gamble rather than a strategic endeavor. Professional traders focus on capital preservation first, using leverage cautiously and consistently.
Retail Trading vs Institutional Reality
Retail forex education often promotes indicators, signals, and short-term strategies promising quick returns. Institutional traders, however, operate very differently. They focus on:
Macro-economic themes
Interest rate cycles
Order flow and liquidity zones
Risk-adjusted returns over long horizons
This mismatch between retail expectations and institutional reality explains why a majority of retail traders struggle. Currency trading is not about predicting every move—it is about managing uncertainty, probabilities, and drawdowns over time.
Psychology: The Silent Market Force
Currency trading exposes traders not just to markets, but to themselves. Fear, greed, impatience, and overconfidence are amplified in a fast-moving, leveraged environment. Many losses are not due to poor analysis, but poor emotional control.
Successful traders develop routines, predefined risk rules, and the ability to accept losses without emotional reaction. The mental discipline required in forex often exceeds that needed in slower-moving markets.
Opportunities That Still Exist
Despite the challenges, currency trading offers genuine opportunities. High liquidity ensures tight spreads in major pairs. The 24-hour nature allows flexibility across time zones. Strong trends can develop around monetary policy shifts, economic cycles, and geopolitical changes.
For informed traders, currencies also serve as tools for hedging, diversification, and global macro positioning. When approached with realistic expectations, solid education, and patience, forex trading can become a professional skill rather than a speculative trap.
Currency Trading Exposed: The Bottom Line
Currency trading is neither a shortcut to wealth nor an impossible game. It is a highly competitive, institution-driven market where success depends on knowledge, discipline, and risk control. Exposing the reality behind forex removes the illusion of easy money and replaces it with a clearer understanding of how global capital truly moves.
Those who treat currency trading as a serious financial craft—grounded in economics, structure, and psychology—stand a far better chance of long-term survival and growth. In the end, forex does not reward excitement; it rewards consistency, humility, and respect for risk.

Exchange Rate SecretsThe Hidden Forces That Drive Currency Movements
Exchange rates appear on screens every second—USD/INR, EUR/USD, GBP/JPY—yet the forces that truly move currencies are far deeper than simple supply and demand. Behind every tick lies a complex interaction of economics, policy, psychology, capital flows, and global power dynamics. Understanding these “exchange rate secrets” is essential for traders, investors, policymakers, and businesses operating in a globalized world.
At its core, an exchange rate represents the relative value of one currency against another. However, currencies are not priced like ordinary goods. They are reflections of an economy’s credibility, stability, and future prospects. The real secret is that currencies trade on expectations more than on current reality.
1. Interest Rates: The Most Powerful Silent Driver
One of the strongest and most consistent drivers of exchange rates is interest rate differentials. Capital flows toward higher yields. When a country offers higher interest rates relative to others, global investors are incentivized to move capital into that currency to earn better returns. This is the foundation of the carry trade, where investors borrow in low-yield currencies and invest in high-yield ones.
However, the secret lies in expectations. Markets often move before a central bank changes rates. If traders believe interest rates will rise in the future, the currency may strengthen months in advance. Conversely, a rate hike that is already priced in may cause little movement—or even a reversal.
2. Central Banks: Masters of Perception
Central banks do more than set interest rates; they shape narratives. Forward guidance, speeches, press conferences, and even subtle changes in language can move currencies dramatically. A single word like “persistent” or “temporary” in inflation commentary can trigger large currency swings.
The hidden truth is that central banks manage confidence as much as policy. A credible central bank stabilizes its currency even during economic stress, while a loss of credibility can trigger sharp depreciation regardless of actual data.
3. Inflation: The Currency Erosion Factor
Inflation quietly eats away at a currency’s purchasing power. Countries with persistently high inflation tend to see long-term currency depreciation. This is why emerging market currencies often weaken over decades against developed market currencies.
But the secret is relative inflation. A currency doesn’t weaken just because inflation is high—it weakens when inflation is higher than its trading partners. If inflation rises everywhere, exchange rates may barely move. Forex is always a game of comparison.
4. Trade Balance and Current Account: Structural Pressure
Countries that export more than they import generate continuous foreign currency inflows, supporting their exchange rate. Export-driven economies often enjoy structurally strong currencies over time. Conversely, large and persistent current account deficits can put downward pressure on a currency.
Yet this relationship is not always immediate. The secret is financing. As long as a country can attract stable capital inflows—foreign investment, remittances, or portfolio flows—it can sustain a deficit without currency collapse. Problems arise when confidence breaks and funding dries up.
5. Capital Flows: The Real Market Movers
Trade flows are slow and predictable; capital flows are fast and emotional. Large institutional investors, hedge funds, sovereign wealth funds, and multinational corporations can move billions in minutes. These flows often overwhelm trade-based fundamentals in the short to medium term.
The hidden reality is that currencies are increasingly driven by financial markets, not goods markets. Risk-on and risk-off sentiment—whether investors are seeking risk or safety—can dominate exchange rate movements irrespective of domestic economic conditions.
6. Safe-Haven Myth and Reality
Certain currencies, such as the US dollar, Swiss franc, and Japanese yen, are considered safe havens. During global crises, capital rushes into these currencies, pushing them higher even if the underlying economy is weak.
The secret here is trust and liquidity. Safe-haven currencies belong to countries with deep financial markets, strong institutions, and the ability to absorb massive capital inflows without destabilization. Safety is less about growth and more about reliability.
7. Geopolitics and Power Currency Dynamics
Exchange rates are also geopolitical instruments. Sanctions, trade wars, military conflicts, and diplomatic tensions can all affect currency values. The dominance of the US dollar is not just economic—it is political and strategic.
A key secret is that reserve currency status creates self-reinforcing strength. Because so much global trade and debt is denominated in dollars, global demand for dollars remains high even when US fundamentals weaken. This “exorbitant privilege” distorts traditional exchange rate logic.
8. Speculation and Market Positioning
Currencies are heavily traded assets, and speculative positioning can exaggerate moves. When too many traders are positioned on one side of a trade, even small news can trigger violent reversals as positions unwind.
The secret lies in understanding positioning, not just data. Many major currency moves occur not because of new information, but because the market was already overcrowded. In forex, who is already in the trade often matters more than the news itself.
9. Psychological Levels and Market Behavior
Round numbers—such as USD/INR 80 or EUR/USD 1.10—carry psychological significance. These levels attract large orders from institutions, corporates, and central banks. Breaks above or below such levels can trigger momentum-based moves.
This reveals a key secret: exchange rates are partly behavioral. Algorithms, technical traders, and human psychology interact to create self-fulfilling price movements that may temporarily disconnect from fundamentals.
10. Long-Term vs Short-Term Truth
In the short term, exchange rates are noisy, emotional, and often irrational. In the long term, they reflect productivity, economic growth, institutional strength, and policy discipline. Traders operate in the short-term chaos; investors and policymakers must respect long-term fundamentals.
The deepest secret is that both perspectives are correct—but on different time horizons. Confusion arises when short-term movements are mistaken for long-term trends, or vice versa.
Conclusion: Seeing Beyond the Numbers
Exchange rate secrets are not hidden formulas or insider tricks. They are insights into how economics, expectations, and human behavior intertwine. Currencies move not just on data, but on belief, credibility, fear, and confidence. Those who understand exchange rates deeply learn to read between the lines—listening not only to what central banks say, but how markets react.
In the global financial system, exchange rates act as real-time verdicts on nations’ economic stories. To understand them is to understand the invisible forces shaping global wealth, trade, and power.

Arbitrage Opportunities Across World ExchangesUnderstanding Global Arbitrage
At its core, arbitrage is the practice of buying an asset in one market where it is undervalued and simultaneously selling it in another market where it is overvalued, locking in a risk-free or low-risk profit. When this activity occurs across different countries or exchanges, it is referred to as global or cross-border arbitrage.
World exchanges differ due to:
Time zone variations
Currency denominations
Regulatory frameworks
Market liquidity and participant behavior
Information dissemination speed
These differences create temporary inefficiencies that arbitrageurs seek to exploit.
Key Types of Arbitrage Across World Exchanges
1. Equity Cross-Listing Arbitrage
Many large corporations are listed on multiple exchanges across the world. Examples include companies listed both in their home market and overseas through American Depositary Receipts (ADRs) or Global Depositary Receipts (GDRs).
Price discrepancies can occur due to:
Exchange rate movements
Different demand-supply dynamics
Local investor sentiment
Arbitrageurs buy shares where they are cheaper and sell where they are more expensive, adjusting for currency conversion and transaction costs.
2. Currency (Forex) Arbitrage
The foreign exchange market is the largest global market and operates 24 hours a day. Arbitrage opportunities arise when exchange rates between three or more currencies are misaligned, commonly known as triangular arbitrage.
For example:
USD → EUR
EUR → JPY
JPY → USD
Even small pricing mismatches can be profitable when executed at large volumes and high speed. However, such opportunities are extremely short-lived due to intense competition and automation.
3. Interest Rate Arbitrage
Interest rates vary across countries due to differing monetary policies, inflation expectations, and economic conditions. Arbitrageurs exploit these differences through covered and uncovered interest rate arbitrage.
Covered interest arbitrage uses forward contracts to hedge currency risk.
Uncovered interest arbitrage takes exposure to currency movements in pursuit of higher yields.
Global bond markets, especially government securities, play a major role in these strategies.
4. Commodity Arbitrage
Commodities such as gold, crude oil, silver, and agricultural products trade on multiple global exchanges. Price differences may arise due to:
Transportation and storage costs
Regional supply-demand imbalances
Taxation and import-export regulations
For instance, gold prices may differ between London, New York, Dubai, and Shanghai markets. Arbitrageurs factor in logistics and financing costs before executing trades.
5. Derivatives and Futures Arbitrage
Futures and options linked to the same underlying asset often trade on multiple international exchanges. Arbitrage opportunities arise when futures prices deviate from their fair value based on spot prices, interest rates, dividends, and time to expiry.
Common strategies include:
Cash-and-carry arbitrage
Reverse cash-and-carry arbitrage
Index futures arbitrage across regions
These trades are popular among institutional players due to their scalability.
6. ETF and Index Arbitrage
Exchange-Traded Funds (ETFs) track indices that may include global securities. When ETF prices diverge from their Net Asset Value (NAV), arbitrageurs step in to profit from the difference.
Global index arbitrage also occurs when the same index futures trade in different time zones, such as Asian, European, and US market hours, leading to temporary mispricing.
7. Cryptocurrency Arbitrage
Digital assets trade on hundreds of exchanges worldwide, often with significant price differences due to:
Capital controls
Liquidity fragmentation
Exchange-specific demand
Regulatory restrictions
Crypto arbitrage can be:
Spatial (between exchanges)
Triangular (within one exchange)
Cross-border (fiat on-ramps and off-ramps)
While highly attractive, these opportunities carry operational, regulatory, and counterparty risks.
Drivers of Arbitrage Opportunities
Several factors contribute to the persistence of arbitrage opportunities across world exchanges:
Market Fragmentation – Different exchanges operate under unique rules and participant structures.
Information Asymmetry – News travels unevenly across regions and time zones.
Currency Volatility – Exchange rate movements distort price parity.
Regulatory Barriers – Capital controls, taxes, and settlement restrictions prevent instant alignment.
Liquidity Differences – Thinly traded markets adjust prices more slowly.
Role of Technology in Global Arbitrage
Modern arbitrage is dominated by technology-driven participants. High-frequency trading (HFT) firms and institutional desks use:
Ultra-low-latency networks
Algorithmic trading systems
Co-location near exchanges
Real-time global data feeds
As a result, simple arbitrage opportunities vanish within milliseconds, leaving retail traders with limited access to pure risk-free arbitrage.
Risks and Constraints
Despite its theoretical risk-free nature, global arbitrage involves several practical risks:
Execution risk due to latency
Currency conversion and hedging costs
Regulatory and compliance issues
Settlement and counterparty risk
Sudden liquidity evaporation
In stressed market conditions, arbitrage can fail, leading to losses instead of profits.
Impact on Global Financial Markets
Arbitrage plays a vital role in:
Enhancing price discovery
Improving market efficiency
Reducing regional price disparities
Integrating global financial systems
Without arbitrage, markets would remain fragmented, inefficient, and prone to persistent mispricing.
Conclusion
Arbitrage opportunities across world exchanges are a natural outcome of global market diversity. While advancements in technology and regulation have reduced the frequency and size of these opportunities, they have not eliminated them. Instead, arbitrage has become more complex, capital-intensive, and speed-dependent.
For institutional players, global arbitrage remains a cornerstone strategy. For individual investors, understanding arbitrage provides valuable insight into how global markets function and why prices converge over time. Ultimately, arbitrage is not just a profit-seeking activity—it is a stabilizing force that keeps the world’s financial markets connected, efficient, and aligned.
Participants’ Market Coverage1. Types of Market Participants and Their Coverage
Financial markets are populated by a wide range of participants, broadly categorized into institutional investors, retail investors, intermediaries, proprietary traders, hedgers, and regulators. Each group covers markets differently.
Institutional investors—such as mutual funds, pension funds, insurance companies, sovereign wealth funds, and endowments—typically provide broad market coverage. They operate across equities, fixed income, commodities, real estate, and increasingly alternative assets like private equity and infrastructure. Their long-term mandates require diversified exposure across sectors and geographies, making them key providers of stable capital. Because of their size, institutional investors influence benchmark indices and play a central role in capital allocation.
Retail investors generally have narrower market coverage. Their participation is often concentrated in domestic equities, exchange-traded funds (ETFs), derivatives for speculation or hedging, and popular thematic investments. While individually small, their collective impact can be significant, especially during periods of heightened sentiment or technological access through online platforms.
Proprietary traders and hedge funds focus on selective but deep market coverage. Rather than covering all markets broadly, they specialize in specific strategies—such as arbitrage, macro trading, statistical strategies, or event-driven trades—across multiple instruments. Their coverage is opportunistic and dynamic, shifting rapidly as risk–reward conditions change.
2. Market Coverage Across Asset Classes
Participants’ market coverage varies significantly by asset class.
In equity markets, coverage is typically broad due to high liquidity, transparency, and accessibility. Large-cap stocks attract coverage from almost all participant types, while mid- and small-cap stocks may have thinner coverage, often dominated by domestic institutions and select funds. This uneven coverage can create pricing inefficiencies in less-followed stocks.
In fixed income markets, coverage is more fragmented. Government bonds enjoy deep participation from central banks, institutions, and foreign investors, while corporate bonds—especially lower-rated or illiquid issues—have limited coverage. This asymmetry affects liquidity and price stability.
Derivatives markets—including futures and options—are heavily covered by hedgers, speculators, and arbitrageurs. Coverage here is driven by leverage, risk management needs, and the ability to express views efficiently. Participants often focus on the most liquid contracts, leaving less popular maturities or underlyings with sparse participation.
In commodity and currency markets, coverage is global but concentrated among professional participants such as exporters, importers, banks, and macro funds. Retail participation exists but is relatively smaller compared to equities.
3. Geographic Market Coverage
Participants’ market coverage also differs by geography. Developed markets generally enjoy extensive coverage due to strong regulation, transparency, and liquidity. Emerging and frontier markets, while offering higher growth potential, often suffer from limited coverage because of political risk, currency volatility, and regulatory uncertainty.
Foreign institutional investors (FIIs) play a crucial role in extending market coverage to emerging economies. Their participation improves liquidity, governance standards, and global integration. However, reliance on foreign capital can also introduce volatility, as global risk-off events may trigger sudden withdrawals.
Domestic institutions help stabilize coverage by providing a local capital base that understands country-specific risks. Balanced participation between domestic and foreign players leads to healthier market development.
4. Time Horizon and Coverage
Market participants differ in their time horizons, which influences how they cover markets.
Long-term investors—such as pension funds and insurance companies—cover markets with a focus on fundamentals, valuation, and sustainability. Their steady participation dampens excessive volatility and supports long-term price discovery.
Short-term traders, including high-frequency traders (HFTs) and day traders, cover markets at a micro level. Their activity is concentrated in highly liquid instruments and contributes to tight bid–ask spreads and rapid price adjustments. However, their coverage is shallow in illiquid or less-followed markets.
The coexistence of multiple time horizons enhances overall market efficiency. When one group withdraws, another often fills the gap, maintaining functional coverage.
5. Role of Intermediaries in Market Coverage
Intermediaries such as stock exchanges, brokers, market makers, and clearing institutions are critical to participants’ market coverage. Market makers, in particular, ensure continuous two-way quotes, enabling participants to transact even during periods of stress. Without them, coverage would become fragmented and liquidity would evaporate quickly.
Technological advancements have expanded coverage by reducing transaction costs and improving access. Electronic trading platforms allow participants to cover multiple markets simultaneously, breaking down geographic and structural barriers.
6. Information, Research, and Coverage Quality
Market coverage is not only about participation volume but also about information depth. Analysts, rating agencies, data providers, and financial media enhance coverage by producing research and disseminating information. Well-covered markets tend to be more efficient, as prices reflect available information more quickly.
Conversely, markets or securities with poor research coverage may experience mispricing. While this increases risk, it also creates opportunities for skilled participants who can conduct independent analysis.
7. Regulatory Influence on Market Coverage
Regulation shapes participants’ market coverage by defining who can participate, how much risk they can take, and which instruments are permissible. Strong regulatory frameworks encourage broader participation by building trust and reducing systemic risk. Overregulation, however, may discourage participation and reduce coverage, particularly in innovative or niche markets.
Balanced regulation promotes inclusive coverage while safeguarding market integrity.
8. Implications of Participants’ Market Coverage
Participants’ market coverage has far-reaching implications. Broad and diversified coverage enhances liquidity, stabilizes prices, and improves capital formation. Narrow or uneven coverage can lead to volatility, liquidity gaps, and systemic vulnerabilities.
For investors, understanding coverage patterns helps in identifying risks and opportunities. Markets with limited coverage may offer higher returns but require careful risk management. For policymakers, fostering balanced participation supports economic growth and financial stability.
Conclusion
Participants’ market coverage is the backbone of financial market functioning. It reflects how different actors engage across assets, regions, and time horizons, shaping liquidity, efficiency, and resilience. A well-covered market benefits from diverse participation, robust information flow, and effective intermediation. As markets evolve through globalization and technology, understanding and adapting to changing coverage dynamics remains essential for all stakeholders in the financial ecosystem.

Comprehensive Financial Market CoverageScope, Importance, and Modern Dynamics
Financial market coverage refers to the systematic analysis, tracking, interpretation, and communication of developments across global and domestic financial markets. It includes equities, bonds, commodities, currencies, derivatives, alternative assets, and emerging financial instruments. In today’s interconnected and fast-moving economic environment, effective financial market coverage plays a critical role in informing investors, policymakers, institutions, and the general public. It bridges the gap between complex market activity and practical decision-making by transforming raw data into actionable insights.
Understanding Financial Market Coverage
At its core, financial market coverage involves monitoring market movements, economic indicators, corporate actions, policy changes, and geopolitical events that influence asset prices. It spans real-time news reporting, in-depth research, technical and fundamental analysis, macroeconomic commentary, and long-term thematic insights. Coverage may be delivered through financial news platforms, brokerage research reports, institutional notes, data terminals, social media channels, and independent analysts.
Financial market coverage is not limited to price reporting. It also explains why markets move, how different assets are interconnected, and what potential future scenarios may unfold. This interpretive layer is what differentiates meaningful coverage from mere information dissemination.
Key Segments of Financial Market Coverage
Equity Markets
Equity market coverage focuses on stock indices, individual companies, sectors, earnings results, valuations, corporate governance, and mergers and acquisitions. Analysts assess both fundamentals (revenues, profits, balance sheets) and technical factors (trends, volume, momentum). Equity coverage is essential for retail investors, portfolio managers, and traders seeking alpha or long-term growth.
Fixed Income and Debt Markets
Bond market coverage tracks government securities, corporate bonds, yield curves, credit spreads, and interest rate expectations. Since debt markets are closely tied to monetary policy, inflation, and fiscal conditions, their coverage is crucial for understanding economic health. Bond market signals often precede equity market trends, making this segment highly influential.
Currency and Forex Markets
Currency market coverage analyzes exchange rate movements driven by interest rate differentials, trade balances, capital flows, and geopolitical risks. Forex markets operate 24/5 and reflect real-time global sentiment. Coverage helps businesses manage currency risk and traders identify macro-driven opportunities.
Commodities and Real Assets
This segment includes energy (oil, gas), metals (gold, copper), agricultural products, and increasingly, carbon and environmental credits. Commodity coverage links supply-demand dynamics, weather patterns, geopolitical tensions, and industrial demand. It is vital for inflation analysis and global growth assessment.
Derivatives and Structured Products
Coverage of futures, options, swaps, and structured instruments focuses on hedging activity, leverage, volatility, and market expectations. Derivatives often reveal institutional positioning and risk appetite, making them an advanced but powerful area of market intelligence.
Role of Macroeconomic and Policy Coverage
A significant pillar of financial market coverage is macroeconomic analysis. This includes tracking GDP growth, inflation, employment data, central bank decisions, fiscal policies, and global economic cycles. Central banks such as the Federal Reserve, ECB, and RBI heavily influence markets through interest rates, liquidity measures, and forward guidance. Accurate coverage of policy signals helps investors anticipate shifts in capital flows and asset valuations.
Geopolitical developments—trade disputes, wars, sanctions, elections—also form a critical part of market coverage. In modern markets, political risk can move prices as strongly as economic fundamentals, making integrated analysis indispensable.
Technology and Data in Modern Coverage
Technology has transformed financial market coverage. High-frequency data, algorithmic analysis, artificial intelligence, and alternative data (satellite data, social media sentiment, supply-chain metrics) are now integral. Market coverage today combines traditional financial statements with real-time analytics and predictive modeling.
Digital platforms enable instant dissemination of insights, while dashboards and visualizations help users interpret complex information quickly. However, this abundance of data also increases noise, making credibility, context, and analytical rigor more important than ever.
Importance for Different Stakeholders
Investors and Traders: Financial market coverage guides asset allocation, risk management, and timing decisions.
Institutions and Corporates: It aids capital raising, hedging strategies, and strategic planning.
Policymakers and Regulators: Market coverage helps assess financial stability and systemic risks.
General Public: It improves financial literacy and awareness of economic trends impacting daily life.
Challenges in Financial Market Coverage
Despite its importance, financial market coverage faces several challenges. Information overload can overwhelm users, while short-termism and sensationalism may distort long-term perspectives. Bias, conflicts of interest, and misinformation—especially in the age of social media—pose risks to credibility. High-quality coverage must balance speed with accuracy, depth with clarity, and opinion with evidence.
The Future of Financial Market Coverage
Looking ahead, financial market coverage is likely to become more personalized, data-driven, and interactive. AI-generated insights, real-time scenario analysis, and cross-asset integration will enhance decision-making. At the same time, human judgment, ethical standards, and contextual understanding will remain irreplaceable.
Conclusion
Comprehensive financial market coverage is the backbone of informed participation in the global financial system. It connects data with insight, markets with the economy, and short-term movements with long-term trends. As markets grow more complex and interconnected, the value of accurate, unbiased, and insightful financial market coverage will only increase—making it an essential tool for navigating uncertainty and opportunity in the modern financial world.

Impact of Foreign Institutional Investors (FIIs) on InvestmentsRole of FIIs in Capital Formation
One of the most important contributions of FIIs is capital inflow. Developing economies often require large pools of capital to fund infrastructure, corporate expansion, innovation, and economic growth. FIIs provide access to global capital that may not be sufficiently available domestically. By investing in equities, bonds, and other financial instruments, FIIs support capital formation and help companies raise funds at competitive costs. This strengthens balance sheets, improves productivity, and enhances long-term growth prospects.
Impact on Equity Markets
FIIs have a strong influence on stock markets due to the sheer size of their investments. Large inflows generally lead to rising stock prices, improved market breadth, and higher valuations. When FIIs invest aggressively, benchmark indices often move upward, attracting further participation from domestic institutional investors (DIIs) and retail investors. This creates a positive feedback loop of liquidity and confidence.
Conversely, when FIIs withdraw funds, markets may experience sharp corrections. FII selling can lead to increased volatility, falling prices, and negative sentiment. In many cases, even fundamentally strong stocks may decline due to broad-based selling pressure. This makes FII behavior a key factor for short- to medium-term market movements.
Influence on Market Liquidity
FIIs significantly enhance market liquidity. Higher liquidity leads to tighter bid-ask spreads, better price discovery, and lower transaction costs. Liquid markets attract more participants and encourage efficient allocation of capital. For long-term investors, improved liquidity reduces entry and exit risks, while for traders, it creates opportunities through volume and volatility.
However, excessive dependence on FII liquidity can also be a risk. Sudden global shocks—such as changes in US interest rates, geopolitical tensions, or financial crises—can trigger rapid capital outflows, causing liquidity stress in domestic markets.
Impact on Bond and Debt Markets
FIIs also invest in government securities, corporate bonds, and other debt instruments. Their participation deepens the bond market, improves yield curve efficiency, and provides governments and corporations with alternative funding sources. Increased FII participation often leads to lower borrowing costs due to higher demand for bonds.
At the same time, FII flows in debt markets are sensitive to interest rate differentials and currency expectations. Rising global interest rates or a depreciating domestic currency may prompt FIIs to exit debt investments, leading to higher yields and increased financing costs for borrowers.
Effect on Currency Markets
FII inflows and outflows have a direct impact on exchange rates. When FIIs invest in a country, they convert foreign currency into local currency, supporting currency appreciation or stability. Sustained inflows can strengthen the currency and improve foreign exchange reserves.
On the other hand, large-scale FII outflows can put pressure on the currency, leading to depreciation. Currency volatility affects import costs, inflation, corporate earnings, and overall macroeconomic stability. Central banks often intervene in foreign exchange markets to manage the impact of volatile FII flows.
Impact on Corporate Governance and Standards
FIIs often bring global best practices in corporate governance, transparency, and disclosure. Large institutional investors tend to favor companies with strong management quality, ethical practices, and clear reporting standards. As a result, domestic companies seeking FII investments may improve governance frameworks, adopt international accounting standards, and enhance investor communication.
This positive spillover benefits the broader market by raising overall standards and improving investor confidence. Over time, better governance leads to more sustainable growth and reduced risk premiums.
Influence on Valuations and Market Efficiency
FII participation contributes to better valuation benchmarks and market efficiency. Through extensive research, data analytics, and global comparisons, FIIs help align asset prices with fundamentals. Their investment decisions often reflect macroeconomic trends, sectoral growth prospects, and global risk appetite.
However, FII-driven markets can sometimes experience overvaluation, especially during periods of excessive liquidity. Herd behavior among global funds may inflate asset bubbles, which can later burst when conditions reverse.
Impact on Domestic Investors
FII activity strongly influences domestic investor behavior. Retail investors often track FII flows as a sentiment indicator. Heavy FII buying is seen as a sign of confidence, while selling is perceived as a warning signal. Domestic institutional investors may counterbalance FII selling during downturns, helping stabilize markets.
Over time, increased domestic participation reduces overreliance on FIIs, creating a more balanced and resilient investment ecosystem.
Risks Associated with FII Dependence
While FIIs bring many benefits, overdependence on foreign capital poses risks. FII flows are influenced by global factors beyond domestic control, such as US monetary policy, global risk sentiment, and international crises. Sudden reversals can destabilize markets, affect currency stability, and disrupt economic planning.
Policymakers therefore aim to strike a balance—encouraging FII participation while strengthening domestic capital markets and long-term investment frameworks.
Conclusion
Foreign Institutional Investors have a profound impact on investments and financial markets. They enhance liquidity, support capital formation, improve governance standards, and integrate domestic markets with the global financial system. At the same time, their flows introduce volatility and external dependence, making risk management and policy oversight essential. For investors, understanding FII behavior provides valuable insights into market trends, sentiment, and potential risks. A healthy investment ecosystem ultimately relies on a balanced mix of foreign and domestic participation, ensuring stability, growth, and long-term sustainability.

The Language of Price | Lesson 13 – Candlesticks + S&R Theory 3Educational Context
This lesson illustrates how price behaves inside a ranging market :
⬆️ Upper boundary → Resistance
⬇️ Lower boundary → Support
by combining Candlesticks and Support & Resistance into a single structural context.
The goal is to improve price reading and market awareness — not prediction.
Scenario 1 – Resistance Reaction (Range High)
⬆️ Resistance
• Fresh formed
• Swing high
🕯️ Candlesticks
• Long wick
• Inside candle
• Change color
• Momentum
🧠 Illustrated Interpretation
↳ Price pushes up ⬆️ into resistance
↳ Upper wick shows rejection ⛔
↳ Inside candle reflects hesitation
↳ Momentum fades near range top
📌 Structure remains capped at the range high
Scenario 2 – Support Reaction (Range Low)
⬇️ Support
• Fresh formed
• Swing low
🕯️ Candlesticks
• Shrinking candles
• Long wick
• Change color
• Momentum
🧠 Illustrated Interpretation
↳ Price declines ⬇️ into support
↳ Long lower wick shows defense 🛡️
↳ Shrinking candles indicate slowing pressure
↳ Buyers absorb selling near the range low
📌 Market stays balanced inside the range
Scenario 3 – Resistance With Multiple Rejections
⬆️ Resistance
• 2 rejections
• Fresh formed
• Swing high
🕯️ Candlesticks
• Inverse long wick
• Change color
• Momentum
🧠 Illustrated Interpretation
↳ Price tests resistance multiple times 🔁
↳ Inverse wicks show failed continuation
↳ Color change signals loss of upside strength
↳ Range ceiling becomes structurally valid
📌 Breakout failure, not trend confirmation
Scenario 4 – Support With Multiple Rejections
⬇️ Support
• 2 rejections
• Fresh formed
• Swing low
🕯️ Candlesticks
• Shrinking candles
• Long wick
• Change color
• Inverse long wick
• Momentum
🧠 Illustrated Interpretation
↳ Price repeatedly fails to break down ⛔⬇️
↳ Long wicks show rejection below support
↳ Shrinking candles reflect reduced selling
↳ Range floor holds structurally
📌 Support acts as a balance zone
Key Educational Insight
🧩 Candlesticks → show reaction
📐 Support & Resistance → define boundaries
➡️ In ranging markets, price moves between zones , not directions.
Important Educational Notice
• These are structural illustrations, not signals
• No trade execution is implied
• No outcome is guaranteed
This lesson focuses on understanding price behavior , not forecasting.
ETHICAL & EDUCATIONAL NOTICE
This content is presented solely for educational and analytical purposes , based on historical price data.
It does not promote or encourage any specific trading method, financial instrument, gambling, leverage, margin usage, short selling, or interest-based activity .
Readers are encouraged to align any financial activity with their own ethical, legal, and religious principles .
⚠️ DISCLAIMER
This material is strictly educational and informational .
It does not constitute financial advice, investment recommendations, or trading instructions.
The author does not provide personalized guidance.
Any decisions made based on this content are the sole responsibility of the individual.

Head and Shoulders PatternHead & Shoulders Patterns
Classic Reversal Structures Every Trader Should Know
1. Head & Shoulders (Bearish Reversal)
The Head & Shoulders pattern is a bearish reversal formation that typically appears after an established uptrend. It signals a possible shift from bullish to bearish market conditions.
This structure consists of three swing highs:
• Left Shoulder – first peak
• Head – highest peak
• Right Shoulder – final peak, similar in height to the left shoulder
Identification Rules
• Left Shoulder < Head > Right Shoulder
• Left Shoulder ≈ Right Shoulder (symmetry improves reliability)
Volume ideally declines as the pattern forms, showing weakening buying pressure.
Between the peaks are two pullbacks (swing lows). Connecting these lows forms the neckline. A confirmed break below the neckline completes the pattern and signals bearish continuation.
2. Inverse Head & Shoulders (Bullish Reversal)
The Inverse Head & Shoulders is the bullish counterpart and typically forms after a downtrend. Instead of peaks, the pattern is made of three troughs:
• Left Shoulder – first low
• Head – lowest point
• Right Shoulder – higher low, similar to the left shoulder
Identification Rules
• Left Shoulder > Head < Right Shoulder
• Left Shoulder ≈ Right Shoulder (symmetry improves reliability)
Volume often contracts during formation and may expand on the neckline breakout.
The highs between the troughs form the neckline. A break above the neckline confirms the bullish reversal.
3. Complex Head & Shoulders Variations
Complex variations follow the same logic as standard H&S patterns but include:
• Multiple shoulders on one or both sides
• More than one head
Despite the added structure, these patterns still rely on:
• Symmetry
• Clear neckline definition
• Breakout confirmation
Traders should treat them the same way as standard formations, but with extra patience.
4. Measurement Rule (Profit Targets)
Standard Head & Shoulders (Bearish)
• Measure the vertical distance from the head to the neckline
• Subtract that distance from the neckline breakout level
• This projects a downside target
Inverse Head & Shoulders (Bullish)
This is very simple. It’s exactly the same as the above Standard Head & Shoulders (Bearish), but inverted. Same concept. Just upside down.
** Tip **
When multiple heads exist, use the most extreme head (highest for bearish, lowest for bullish) for measurement.
Final Notes for Traders
Head & Shoulders patterns remain effective because they visually represent trend exhaustion and shifting market psychology.
When trading these patterns, always emphasize:
• Structure first
• Confirmation second
• Risk management always

Exchange Rate Dynamics and FluctuationsUnderstanding Exchange Rates
An exchange rate is the price of one country’s currency expressed in terms of another currency. For example, if the Indian rupee trades at 83 per US dollar, it means 83 rupees are required to purchase one dollar. Exchange rates can be fixed, managed, or floating, depending on the monetary system adopted by a country. In a floating exchange rate regime, market forces of demand and supply largely determine currency values. In contrast, fixed or pegged regimes involve central bank intervention to maintain a stable currency level.
Key Drivers of Exchange Rate Fluctuations
Interest Rate Differentials
Interest rates are one of the most powerful determinants of exchange rate movements. Higher interest rates in a country tend to attract foreign capital, increasing demand for that country’s currency and leading to appreciation. Conversely, lower interest rates reduce capital inflows and may cause currency depreciation. Central bank policies, such as rate hikes or cuts, often trigger sharp currency movements.
Inflation and Purchasing Power Parity (PPP)
Inflation affects a currency’s purchasing power. Countries with lower inflation rates generally see their currencies appreciate over time, as their goods and services become more competitive internationally. According to the theory of purchasing power parity, exchange rates should adjust so that identical goods cost the same across countries in the long run. Persistent inflation differentials often lead to long-term currency depreciation.
Economic Growth and Macroeconomic Performance
Strong economic growth, rising productivity, and stable fiscal conditions support a stronger currency. Investors prefer economies with robust growth prospects, healthy government finances, and predictable policy frameworks. Weak growth, high fiscal deficits, or rising public debt can undermine confidence and lead to currency weakness.
Trade Balance and Current Account
A country’s trade balance has a direct impact on its currency. Trade surpluses increase demand for a currency, as foreign buyers need it to pay for exports. Trade deficits increase supply of the domestic currency in global markets, often putting downward pressure on exchange rates. Over time, persistent current account deficits can lead to structural currency depreciation.
Capital Flows and Investment Sentiment
Short-term portfolio flows and long-term foreign direct investment significantly influence exchange rates. During periods of global risk appetite, capital flows into emerging markets seeking higher returns, strengthening their currencies. In times of uncertainty or financial stress, investors move funds to safe-haven currencies such as the US dollar, Swiss franc, or Japanese yen, causing sharp exchange rate swings.
Role of Central Banks and Policy Interventions
Central banks play a crucial role in exchange rate dynamics. Through monetary policy tools such as interest rates, open market operations, and foreign exchange reserves management, central banks can influence currency movements. Some central banks actively intervene in currency markets to smooth excessive volatility, prevent disorderly movements, or protect export competitiveness.
In managed exchange rate systems, central banks may buy or sell foreign currencies to stabilize the domestic currency. While intervention can be effective in the short term, sustained misalignment from economic fundamentals often proves difficult and costly to maintain.
Political and Geopolitical Factors
Political stability, governance quality, and geopolitical developments significantly affect currency markets. Elections, policy uncertainty, trade wars, sanctions, and military conflicts can trigger abrupt exchange rate fluctuations. Currencies tend to weaken when political risk rises, as investors demand higher risk premiums or withdraw capital entirely.
Geopolitical events also influence global commodity prices, supply chains, and capital flows, indirectly impacting exchange rates across multiple countries simultaneously.
Speculation and Market Psychology
Exchange rate movements are not driven solely by fundamentals. Speculation, expectations, and market psychology play a major role, especially in the short term. Traders react to news, rumors, data releases, and central bank signals, often amplifying price movements. Herd behavior can lead to overshooting, where currencies move beyond levels justified by economic fundamentals before correcting.
The availability of leveraged instruments in foreign exchange markets increases volatility, as small changes in expectations can result in large capital movements.
Short-Term vs Long-Term Exchange Rate Dynamics
In the short term, exchange rate fluctuations are often dominated by financial factors such as interest rate expectations, capital flows, and speculative activity. In the long term, economic fundamentals—productivity growth, inflation differentials, trade patterns, and institutional quality—tend to determine currency trends.
For example, a currency may experience sharp short-term depreciation due to risk-off sentiment, but over the long run, strong economic reforms and productivity gains can support appreciation.
Impact of Exchange Rate Fluctuations
Exchange rate volatility has wide-ranging economic consequences. For exporters and importers, currency movements affect competitiveness, profit margins, and pricing strategies. For governments, exchange rates influence inflation, external debt servicing, and overall financial stability. For investors, currency risk can significantly impact returns on international investments.
In emerging economies, excessive exchange rate volatility can destabilize financial systems, increase inflation, and reduce investor confidence. As a result, many emerging market central banks focus on managing volatility rather than targeting a specific exchange rate level.
Globalization and Exchange Rate Interdependence
In today’s globalized economy, exchange rate dynamics are increasingly interconnected. Policy decisions in major economies, particularly the United States, can have spillover effects on currencies worldwide. For example, US Federal Reserve tightening cycles often lead to dollar appreciation and capital outflows from emerging markets, putting pressure on their currencies.
Global supply chains, cross-border investments, and synchronized financial cycles mean that exchange rate movements in one region can quickly influence others.
Conclusion
Exchange rate dynamics and fluctuations are shaped by a complex interaction of economic fundamentals, financial markets, policy decisions, and human behavior. While short-term movements are often volatile and unpredictable, long-term trends tend to reflect underlying economic strength and stability. For policymakers, managing exchange rate volatility without distorting market signals is a delicate balance. For investors and businesses, understanding the drivers of currency movements is essential for effective risk management and strategic decision-making.
In an era of heightened global uncertainty, technological change, and shifting economic power, exchange rate dynamics will remain a critical factor shaping global economic outcomes and financial market behavior.

The Global ESG TrendIntegrating Sustainability, Responsibility, and Long-Term Value Creation
Environmental, Social, and Governance (ESG) has evolved from a niche ethical concept into a central pillar of global economic, financial, and corporate decision-making. Across developed and emerging markets, ESG considerations now shape how companies operate, how investors allocate capital, and how governments design policies. The global ESG trend reflects a broader shift in mindset: long-term value creation is no longer measured purely by financial returns, but also by how responsibly organizations manage environmental risks, treat stakeholders, and uphold transparent governance. This transformation is redefining capitalism in the 21st century.
Understanding ESG: The Three Pillars
The ESG framework rests on three interconnected dimensions.
The Environmental pillar focuses on how organizations interact with the natural world. This includes climate change mitigation, carbon emissions, energy efficiency, renewable energy adoption, water usage, waste management, and biodiversity protection. Rising climate risks, extreme weather events, and resource scarcity have made environmental performance a strategic priority rather than a compliance exercise.
The Social pillar examines how companies manage relationships with employees, customers, suppliers, and communities. Issues such as labor standards, workplace diversity and inclusion, health and safety, data privacy, human rights, and community engagement fall under this category. Social performance has gained prominence as stakeholders increasingly expect businesses to contribute positively to society and avoid practices that exploit people or communities.
The Governance pillar relates to corporate leadership, ethics, and accountability. It includes board structure and independence, executive compensation, shareholder rights, audit quality, risk management, and anti-corruption practices. Strong governance is seen as the foundation that ensures environmental and social commitments are implemented effectively and not reduced to superficial branding.
Drivers of the Global ESG Momentum
Several powerful forces are driving the global ESG trend. One of the most important is climate change awareness. Scientific consensus and visible environmental damage have increased pressure on governments and corporations to reduce emissions and transition toward low-carbon economies. International agreements, such as climate accords, have reinforced this direction and encouraged regulatory action.
Another key driver is investor demand. Institutional investors, sovereign wealth funds, pension funds, and asset managers increasingly integrate ESG criteria into their investment processes. They view ESG not only as an ethical choice but also as a tool for risk management. Poor ESG performance is often associated with regulatory penalties, reputational damage, operational disruptions, and long-term financial underperformance.
Regulatory and policy initiatives have also accelerated ESG adoption. Governments across regions are introducing mandatory ESG disclosures, sustainability reporting standards, and stricter corporate governance rules. These measures aim to improve transparency, protect investors, and align capital flows with sustainable development goals.
Finally, consumer and societal expectations play a critical role. Consumers are more conscious of how products are made and how companies behave. Brands associated with sustainability, fairness, and transparency often enjoy stronger loyalty, while those linked to environmental harm or social injustice face boycotts and reputational risks.
ESG in Global Capital Markets
The rise of ESG has significantly reshaped global capital markets. Sustainable investing strategies—such as ESG integration, negative screening, best-in-class selection, and impact investing—have gained widespread acceptance. Assets under management in ESG-focused funds have grown rapidly, reflecting a shift in how capital is allocated.
Green bonds, social bonds, and sustainability-linked bonds have emerged as important financing instruments. These allow governments and corporations to raise capital specifically for projects related to renewable energy, clean transportation, affordable housing, healthcare, and social development. The growth of sustainable finance has helped channel funds toward projects that support long-term environmental and social objectives.
However, the ESG investment landscape also faces challenges. Differences in ESG rating methodologies, lack of standardized data, and concerns about “greenwashing” have raised questions about credibility and comparability. As a result, global efforts are underway to harmonize reporting standards and improve data quality.
Corporate Strategy and ESG Integration
For corporations, ESG is no longer a separate corporate social responsibility initiative; it is increasingly embedded into core strategy. Companies are setting net-zero targets, redesigning supply chains, investing in clean technologies, and strengthening governance frameworks. ESG considerations influence capital expenditure decisions, mergers and acquisitions, risk management, and executive incentives.
Leading companies recognize that ESG integration can drive competitive advantage. Energy efficiency reduces costs, strong labor practices improve productivity, and transparent governance enhances investor confidence. Over time, organizations that align profitability with sustainability are better positioned to navigate regulatory changes, technological disruptions, and shifting consumer preferences.
At the same time, ESG implementation requires cultural change. It demands long-term thinking, cross-functional collaboration, and accountability at the highest levels of leadership. Firms that treat ESG as a box-ticking exercise risk losing trust among investors and stakeholders.
ESG in Emerging and Developed Economies
The ESG trend manifests differently across regions. In developed markets, regulatory frameworks are more mature, and investor pressure is stronger. ESG disclosures, climate risk assessments, and governance reforms are increasingly standardized. These markets often lead innovation in sustainable finance and corporate sustainability practices.
In emerging markets, ESG adoption is accelerating but faces unique challenges. Issues such as data availability, regulatory enforcement, and developmental priorities can complicate implementation. However, emerging economies also present significant ESG opportunities, particularly in renewable energy, infrastructure development, financial inclusion, and social impact projects. As global investors seek diversification and growth, ESG performance in emerging markets is becoming a key differentiator.
Challenges and Criticisms of ESG
Despite its rapid growth, ESG is not without criticism. One major concern is the lack of universally accepted definitions and metrics. ESG scores from different providers can vary widely, creating confusion for investors. Another challenge is balancing short-term financial pressures with long-term sustainability goals, especially during periods of economic stress.
There is also debate about whether ESG should prioritize risk-adjusted returns or broader societal outcomes. Critics argue that ESG can be politicized or used for marketing rather than meaningful change. Addressing these concerns requires stronger standards, better disclosure, and greater accountability.
The Future of the Global ESG Trend
Looking ahead, the global ESG trend is likely to deepen and mature. Advances in data analytics, technology, and reporting frameworks will improve transparency and comparability. Climate transition planning, biodiversity protection, and social equity are expected to gain greater emphasis. Governance standards will continue to evolve as shareholders demand stronger oversight and ethical leadership.
Ultimately, ESG represents a fundamental shift in how value is defined and created. It reflects the recognition that economic growth, environmental sustainability, and social well-being are interconnected. As global challenges become more complex, ESG provides a framework for aligning capital, corporate behavior, and policy with a more resilient and inclusive future.
In conclusion, the global ESG trend is not a passing phase but a structural transformation of the global economy. By integrating environmental responsibility, social impact, and strong governance into decision-making, ESG is shaping a new model of sustainable capitalism—one that seeks to balance profit with purpose and short-term performance with long-term resilience.

Global Equity TrendsNavigating Growth, Volatility, and Structural Shifts in World Markets
Global equity markets represent the collective pulse of the world economy. They reflect not only corporate earnings and economic growth but also investor sentiment, geopolitical realities, technological disruption, and policy decisions taken by governments and central banks. Over the past few decades—and especially in recent years—global equity trends have undergone significant transformation. Understanding these trends is essential for investors, policymakers, and analysts seeking to navigate an increasingly interconnected and dynamic financial landscape.
1. Evolution of Global Equity Markets
Historically, global equity markets were dominated by developed economies such as the United States, Western Europe, and Japan. These markets benefited from stable institutions, deep capital pools, and mature corporate sectors. Over time, globalization, liberalization of capital flows, and technological advances enabled capital to move more freely across borders. This laid the foundation for the rise of emerging markets, which now play a crucial role in global equity performance.
Today, global equities are no longer driven by a single region. Instead, market leadership rotates across geographies depending on economic cycles, interest rate regimes, and structural reforms. This diversification has increased opportunities but has also introduced new layers of complexity and risk.
2. Dominance of the United States in Global Equities
The United States remains the most influential equity market globally. US equities account for more than half of global market capitalization, driven largely by innovation-led companies in technology, healthcare, and consumer sectors. The rise of mega-cap technology firms has reshaped global indices, making US market performance a key determinant of worldwide equity returns.
Strong corporate governance, deep liquidity, and a culture of innovation have allowed US companies to consistently attract global capital. However, this dominance has also raised concerns about valuation concentration and overreliance on a narrow set of stocks to drive global performance.
3. Shifting Role of Europe and Japan
European equity markets have shown moderate but uneven growth. Structural challenges such as aging populations, slower productivity growth, and political fragmentation have limited long-term returns compared to the US. However, Europe continues to offer opportunities in industrials, luxury goods, renewable energy, and financials, especially during cyclical recoveries.
Japan’s equity market has experienced a renaissance after decades of stagnation. Corporate governance reforms, shareholder-friendly policies, and improving profitability have attracted renewed foreign interest. While demographic challenges persist, Japan’s focus on efficiency, automation, and export competitiveness continues to support equity growth.
4. Rise of Emerging Markets
Emerging markets (EMs) have become a central theme in global equity trends. Countries across Asia, Latin America, Eastern Europe, and Africa have seen expanding equity markets driven by urbanization, rising incomes, and industrialization. China and India, in particular, have emerged as major equity market powerhouses.
EM equities often outperform during periods of global growth and weaker US dollar cycles. However, they are also more sensitive to external shocks, capital flow reversals, and domestic policy risks. As a result, global investors increasingly adopt selective and thematic approaches rather than broad EM exposure.
5. Sectoral Shifts and Thematic Investing
One of the most important global equity trends is the shift from traditional sectors to new-economy themes. Technology, artificial intelligence, renewable energy, electric vehicles, biotechnology, and digital finance are now major drivers of equity returns worldwide.
At the same time, traditional sectors such as energy, materials, and financials continue to play a cyclical role, often outperforming during inflationary or recovery phases. This has led to a growing emphasis on sector rotation strategies, where investors shift capital based on macroeconomic conditions.
Thematic investing has gained prominence, allowing investors to capture long-term structural trends that transcend geographic boundaries.
6. Impact of Monetary Policy and Interest Rates
Global equity trends are deeply influenced by central bank policies. Periods of low interest rates and abundant liquidity have historically supported higher equity valuations. Conversely, tightening monetary conditions often lead to market corrections, increased volatility, and a shift toward defensive stocks.
In recent years, the global fight against inflation has reintroduced interest rate sensitivity into equity markets. Growth stocks, which rely heavily on future earnings, have become more volatile, while value and dividend-paying stocks have regained relevance.
7. Geopolitics and Fragmentation of Globalization
Geopolitical tensions have become a defining feature of modern global equity trends. Trade disputes, sanctions, military conflicts, and strategic competition between major powers have increased uncertainty and market volatility.
As globalization evolves into a more fragmented system, companies are rethinking supply chains, production hubs, and market exposure. This has implications for equity markets, favoring regions and companies aligned with domestic manufacturing, energy security, and strategic independence.
8. Role of Technology and Digital Transformation
Technology has fundamentally transformed global equity markets, not just in terms of listed companies but also market structure. Algorithmic trading, digital exchanges, real-time data, and increased retail participation have changed how markets function.
Global equity performance is increasingly linked to innovation cycles. Companies that adapt quickly to digital transformation tend to attract premium valuations, while laggards face declining relevance.
9. Sustainability and ESG Influence
Environmental, Social, and Governance (ESG) considerations have become an integral part of global equity trends. Investors are increasingly factoring sustainability, climate risk, and corporate ethics into valuation and capital allocation decisions.
While ESG investing has faced periods of skepticism, the long-term shift toward sustainable business models continues to influence equity markets, particularly in developed economies and large institutional portfolios.
10. Volatility, Cycles, and Long-Term Outlook
Global equity markets move in cycles influenced by economic growth, earnings trends, and investor psychology. Short-term volatility is inevitable, especially in a world marked by rapid information flow and policy shifts. However, over the long term, equities remain one of the most effective tools for wealth creation.
Looking ahead, global equity trends are likely to be shaped by demographic changes, technological innovation, climate transition, and evolving global power dynamics. Investors who understand these structural forces—and diversify across regions, sectors, and themes—are better positioned to navigate uncertainty and capture long-term growth.
Conclusion
Global equity trends reflect a world in transition. From the dominance of US markets to the rising influence of emerging economies, from traditional industries to disruptive technologies, equities continue to adapt to changing realities. While risks such as volatility, geopolitical tension, and policy uncertainty persist, global equity markets remain a powerful engine of growth. A disciplined, informed, and long-term perspective is essential to successfully navigate the evolving global equity landscape.

The Commodity Super Cycle: Long-Term Force Shaping Global MarketA commodity super cycle refers to a prolonged period—often lasting a decade or more—during which commodity prices move significantly above their long-term average due to strong, sustained demand driven by structural changes in the global economy. Unlike normal commodity cycles, which are short-term and influenced by seasonal factors or temporary supply disruptions, super cycles are rooted in deep economic, demographic, technological, and geopolitical transformations. Understanding commodity super cycles is critical for investors, policymakers, businesses, and economies that rely heavily on natural resources.
Understanding the Concept of a Commodity Super Cycle
At its core, a commodity super cycle emerges when demand growth persistently outpaces supply growth over an extended period. Commodities such as energy (oil, gas), metals (copper, iron ore, aluminum), agricultural products, and precious metals experience broad-based price appreciation. The key difference between a regular cycle and a super cycle is duration and breadth. While normal cycles may last a few years and affect specific commodities, super cycles span multiple commodities and can last 10–30 years.
Supply in commodity markets is often inelastic in the short to medium term. Mining projects, oil exploration, and agricultural expansion require significant capital investment and long gestation periods. When demand accelerates rapidly due to structural shifts, supply cannot adjust quickly, leading to prolonged price increases—an essential feature of a super cycle.
Historical Commodity Super Cycles
Historically, several major commodity super cycles can be identified:
The Industrial Revolution (late 19th to early 20th century): Rapid industrialization in Europe and the United States drove massive demand for coal, steel, and other raw materials.
Post–World War II Reconstruction (1940s–1960s): Rebuilding Europe and Japan, combined with U.S. infrastructure expansion, fueled demand for metals and energy.
China-Led Super Cycle (early 2000s–2010s): China’s entry into the World Trade Organization (WTO) and its infrastructure-heavy growth model caused an unprecedented surge in demand for iron ore, copper, coal, and oil.
Each of these cycles was powered by large-scale urbanization, industrialization, and capital formation, which fundamentally reshaped global commodity demand.
Key Drivers of a Commodity Super Cycle
Several structural forces typically drive a commodity super cycle:
1. Economic Development and Urbanization
Rapid growth in emerging economies increases consumption of commodities. Urbanization requires steel, cement, copper, energy, and agricultural products. As millions move from rural to urban areas, per-capita commodity consumption rises sharply.
2. Infrastructure and Industrial Investment
Large infrastructure programs—roads, railways, power plants, housing, and ports—are commodity-intensive. Government-led capital expenditure often plays a crucial role in sustaining demand over long periods.
3. Demographics and Population Growth
A growing population increases demand for food, water, energy, and housing. Younger populations in emerging markets tend to consume more resources as incomes rise.
4. Technological Transitions
Technological shifts can significantly alter commodity demand. For example, the transition toward renewable energy, electric vehicles, and battery storage has increased demand for copper, lithium, nickel, cobalt, and rare earth elements.
5. Monetary and Financial Factors
Loose global monetary policy, low interest rates, and currency debasement can fuel commodity investment. Commodities are often viewed as a hedge against inflation, attracting financial capital during periods of macroeconomic uncertainty.
6. Geopolitical and Supply Constraints
Geopolitical tensions, trade restrictions, sanctions, and underinvestment in supply capacity can exacerbate shortages. Environmental regulations and ESG considerations can further restrict supply growth, reinforcing long-term price pressures.
Phases of a Commodity Super Cycle
A commodity super cycle typically unfolds in four broad phases:
Early Recovery Phase: Prices are low due to prior oversupply. Investment in capacity is minimal.
Demand Acceleration Phase: Structural demand begins to rise, tightening markets and pushing prices higher.
Peak and Overinvestment Phase: High prices incentivize aggressive investment, leading to excess capacity.
Correction and Decline Phase: Supply eventually overshoots demand, prices fall, and weaker producers exit the market.
These phases can span many years, and timing them precisely is extremely challenging.
Impact on Economies and Markets
Commodity super cycles have profound economic and financial implications:
Commodity-exporting countries benefit from higher revenues, stronger currencies, improved fiscal balances, and increased foreign investment.
Commodity-importing countries face higher input costs, inflationary pressures, and potential trade deficits.
Equity markets often see strong performance in resource sectors such as metals, mining, energy, and agriculture.
Inflation dynamics are heavily influenced, as commodities are key inputs across the economy.
However, reliance on commodity booms can also create vulnerabilities, including fiscal mismanagement, asset bubbles, and long-term competitiveness issues—commonly referred to as the “resource curse.”
The Current and Future Outlook
Many analysts argue that the world may be entering—or already be in—the early stages of a new commodity super cycle driven by the energy transition, deglobalization, supply-chain reconfiguration, and infrastructure renewal. Decarbonization requires massive investment in renewable energy, power grids, electric vehicles, and energy storage—all of which are metal-intensive. At the same time, years of underinvestment in traditional energy and mining have constrained supply.
Additionally, geopolitical fragmentation and a shift toward domestic manufacturing and strategic stockpiling are increasing demand for critical commodities. These factors suggest that upward pressure on commodity prices could persist for an extended period, although volatility will remain high.
Conclusion
The commodity super cycle is a powerful framework for understanding long-term movements in commodity markets and their broader economic consequences. Driven by structural forces such as urbanization, technological change, demographics, and geopolitics, super cycles reshape global trade, investment flows, and macroeconomic stability. While they present significant opportunities for investors and commodity-producing nations, they also carry risks of inflation, volatility, and misallocation of capital. A disciplined, long-term perspective is essential to navigate and benefit from the complex dynamics of a commodity super cycle.
