The Bear Market Isn't Coming? Old BTC Playbook is a TrapFor years, traders have relied on Bitcoin's predictable cycles. We look for the same clues, the same topping signals, and the same patterns. But what if the market has evolved? What if the playbook we've all been studying is now a trap?
This analysis dives deep into key indicators across all three

The best trades require research, then commitment.
Get started for free$0 forever, no credit card needed

Scott "Kidd" PoteetThe unlikely astronaut

Where the world does markets
Join 100 million traders and investors taking the future into their own hands.
Major indices

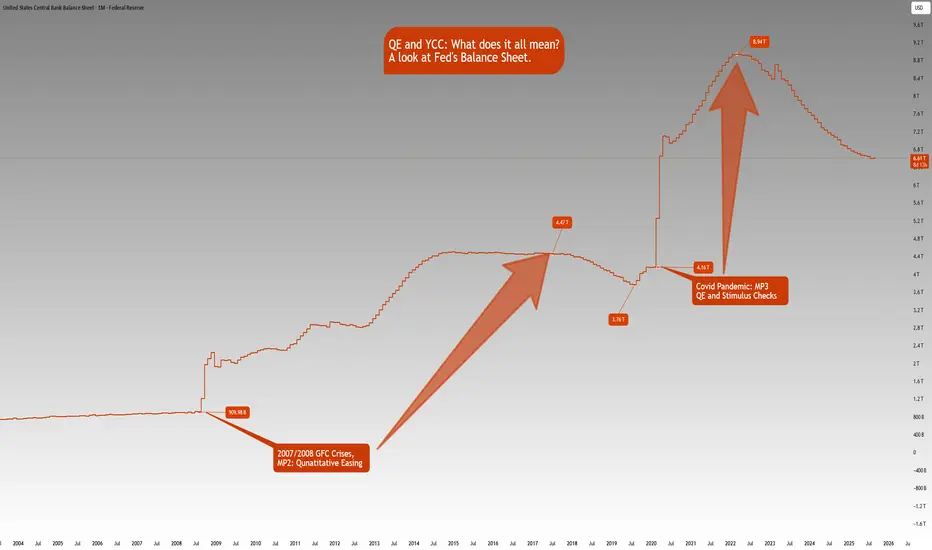
QE and YCC: What does it all mean?ECONOMICS:USCBBS
CBOT:ZB1! CBOT:ZN1! CME_MINI:NQ1!
There is growing market speculation that the Fed may tolerate inflation above 2% for longer, consistent with its Average Inflation Targeting (AIT) framework introduced in 2020.
This also implies that real rates i.e., nominal rates minus
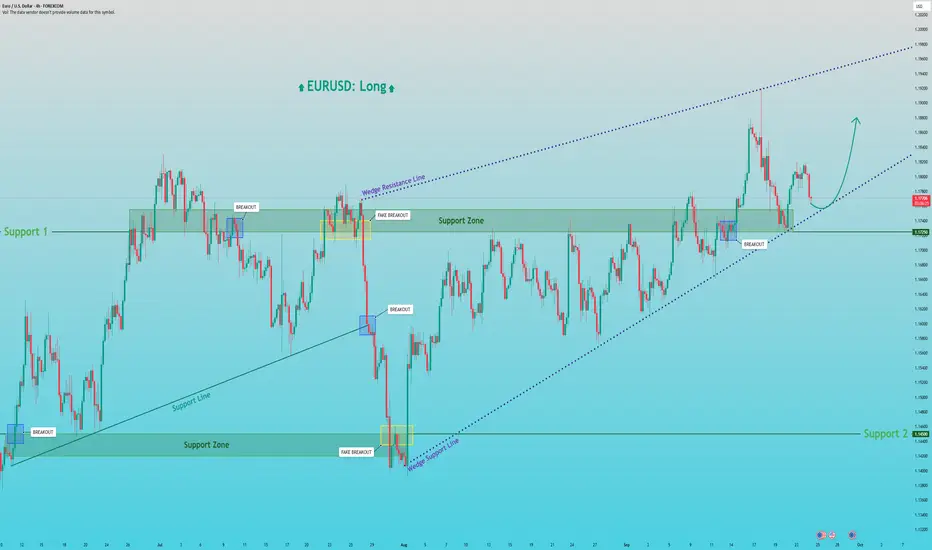
EURUSD: Rally from Wedge Support to 1.1880Hello everyone, here is my breakdown of the current Euro setup.
Market Analysis
A prior uptrend failed, leading to a sharp drop down to the major Support zone 2 around the 1.1450 level. However, strong buying pressure emerged from that low, initiating a powerful reversal and establishing the cu
BTC Breakdown: Watching 112.6K-113.5K for Rejection Toward 109kHello guys!
Trend Structure:
The price was moving in a clear ascending channel, but recently broke down below the lower boundary with strong bearish momentum. This confirms a structural shift from bullish to bearish sentiment.
Current Price Action:
After the breakdown, BTC attempted a relief rally

XAUUSD Long: Bullish Momentum to ContinueHello, traders! The price auction for XAUUSD has been in a strong bullish phase, confirmed by the establishment of a well-defined ascending channel. This uptrend was initiated after a breakout from lower levels and has shown significant strength by pushing through multiple prior resistance areas, in

Bear market has startedThe End of the Bull Cycle. Why I'm Selling Everything and Won't Buy Again Until September 2026.
For the last year and a half, I have said that we are in a bull market. I never once changed my opinion. But all things come to an end. The time has come.
September 13, 2025, the date I have been ment

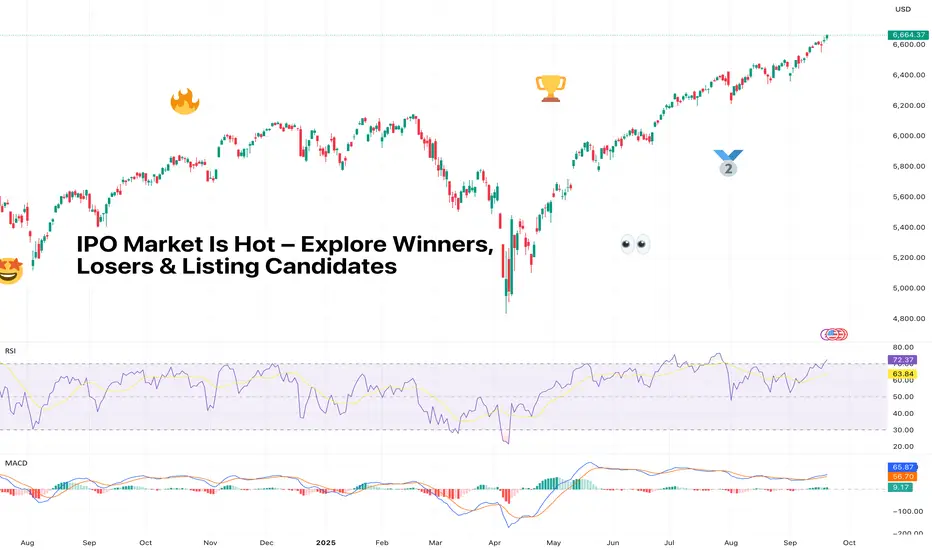
IPO Market Is Hot – Explore Winners, Losers & Listing CandidatesThe IPO market has woken up from its multi-year nap and is now in beast mode. But as always, Wall Street’s hottest party comes with an entrance fee and a dose of uncertainty – opaque prices, sketchy balance sheets, and a whole lot of FOMO.
So who’s winning, who’s losing, and who’s still waiting in
INDV - Helping Trump Fight The Drug War In The US and Overseas.Thought this was a good example of the kind of stock I like to trade.
Not all of these have to be true to make it tradable. Just things I like to see.
Up over 100% over the last 12 months
Nice and steady price gains continuing to make higher highs
Had a good bump on earnings
Has had a recent

Nvidia Returns to Yearly Highs on Temporary Boost in ConfidenceNvidia’s stock started the week with a gain of more than 4%, maintaining a steady bullish bias after it was announced that the company will invest over $100 billion in OpenAI to support the development of artificial intelligence infrastructure. As part of the agreement, Nvidia is expected to receive

Supreme Court ruling could lift gold further Gold has climbed $410 over the past four weeks, reaching ~$3,750 today after an additional ~$60 gain.
The combination of political risk, questions over central bank independence, and robust technical momentum has positioned gold as one of the best performing assets.
The Supreme Court has appare

See all editors' picks ideas
FiniteStateMachine🟩 OVERVIEW
A flexible framework for creating, testing and implementing a Finite State Machine (FSM) in your script. FSMs use rules to control how states change in response to events.
This is the first Finite State Machine library on TradingView and it's quite a different way to think about your

Trading Activity Index (Zeiierman)█ Overview
Trading Activity Index (Zeiierman) is a volume-based market activity meter that transforms dollar-volume into a smooth, normalized “activity index.”
It highlights when market participation is unusually low or high with a dynamic color gradient:
Light Blue → Low Activity (thin p

Expected Value Monte CarloI created this indicator after noticing that there was no Expected Value indicator here on TradingView.
The EVMC provides statistical Expected Value to what might happen in the future regarding the asset you are analyzing.
It uses 2 quantitative methods:
Historical Backtest to ground your anal

Bar Index & TimeLibrary to convert a bar index to a timestamp and vice versa.
Utilizes runtime memory to store the 𝚝𝚒𝚖𝚎 and 𝚝𝚒𝚖𝚎_𝚌𝚕𝚘𝚜𝚎 values of every bar on the chart (and optional future bars), with the ability of storing additional custom values for every chart bar.
█ PREFACE
This library aims to tackle s

Liquidity Void Detector (Zeiierman)█ Overview
Liquidity Void Detector (Zeiierman) is an oscillator highlighting inefficient price displacements under low participation. It measures the most recent price move (standardized return) and amplifies it only when volume is below its own trend.
Positive readings ⇒ strong up-move

DeltaFlow Volume Profile [BigBeluga]🔵 OVERVIEW
The DeltaFlow Volume Profile builds a compact volume profile next to price and enriches every bin with flow context : bullish vs. bearish participation (%), a per-bin Delta % , an optional Delta Heat Map , and a PoC band with the bin’s absolute volume. This lets you see not just

Volume by Time [LuxAlgo]The Volume by Time indicator collects volume data for every point in time over the day and displays the average volume of the specific dataset collected at each respective bar.
The indicator overlays the current volume and the historical average to allow for better comparisons.
🔶 USAGE
Thr

FlowScope [Hapharmonic]FlowScope: Uncover the Market's True Intent 🔬
Ever wished you could look inside the candles and see where the real action is happening? FlowScope is your microscope for the market's flow, designed to give you a powerful edge by revealing the volume distribution that price action alone can't sh

VWAP Price ChannelVWAP Price Channel cuts the crust off of a traditional price channel (Donchian Channel) by anchoring VWAPs at the highs and lows. By doing this, the flat levels, characteristic of traditional Donchian Channels, are no more!
Author's Note: This indicator is formed with no inherent use, and serves

Fibonacci Sequence Circles [BigBeluga]🔵 Overview
The Fibonacci Sequence Circles is a unique and visually intuitive indicator designed for the TradingView platform. It combines the principles of the Fibonacci sequence with geometric circles to help traders identify potential support and resistance levels, as well as price expansio

See all indicators and strategies
Community trends
Alibaba - Here we have the final bottom!🏮Alibaba ( NYSE:BABA ) finally created its bottom:
🔎Analysis summary:
As we are speaking, Alibaba finally managed to create a long term bottom formation. Specifically with the recent bullish break and retest, bulls are picking up momentum. We just have to see a break above the current key res

PII Possibility everyone n canada drives polaris. what a fun vehicle. nice daily trend, long term stock is below 100/200 on M & W so it should take time to recover. BUT, fundamentally, who doesn't love snow mobiles.

#MARA NASDAQ:MARA
MARA is poised to go higher potentially towards $50 as the first target and onto 150+ in the next few years if bitcoin continues to break higher highs. Its only a matter of time before the miners start to catch up as the revenues would grow significantly and with green energy initiati

BULL - VERY Bullish SetupBULL seems to have finished a very elongated correctional ABC to it's first impulse which of course came to a stop at the ATH anchored VWAP point, this is very typical to see in stocks preparing for a breakout.
The structure is incredibly clear here, even on the micro-count (I didn't include that h

TESLA - Expected drop to 350 area following newswassup guys its Tommy here, its been a while i know.
With less time on my hands to scalp gold as i did, i have been looking at stocks and applying my skills in different areas like swing trading and investing short and long term.
Its easier on the mind for me as i can research in my own time and

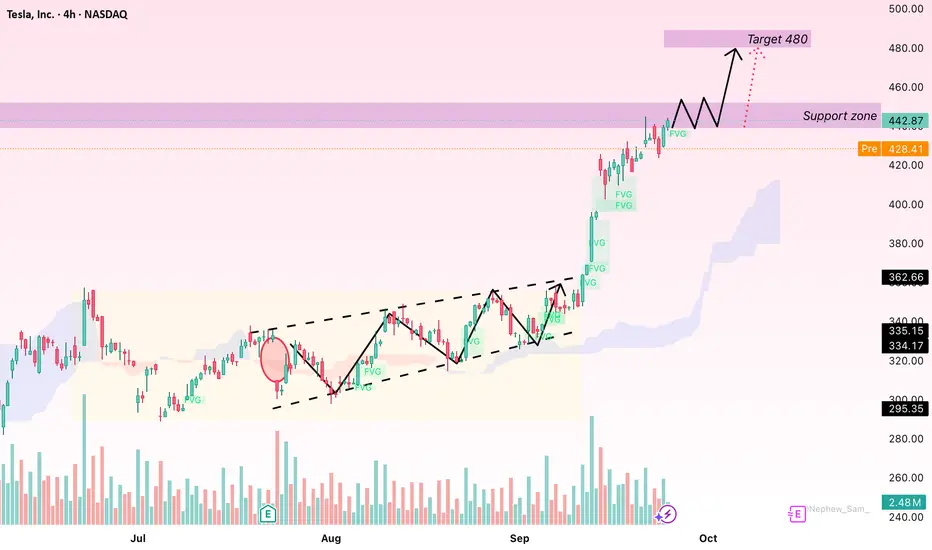
TSLA: Likely to Continue Rising if Holding Above $440Hello everyone,
Today, Tesla (TSLA) shares are trading at $442.87, up 0.77% from the previous close. After a strong rally recently, the market is closely watching whether TSLA can sustain its upward momentum or if a short-term pullback may occur.
The slight retreat in recent sessions mainly stems
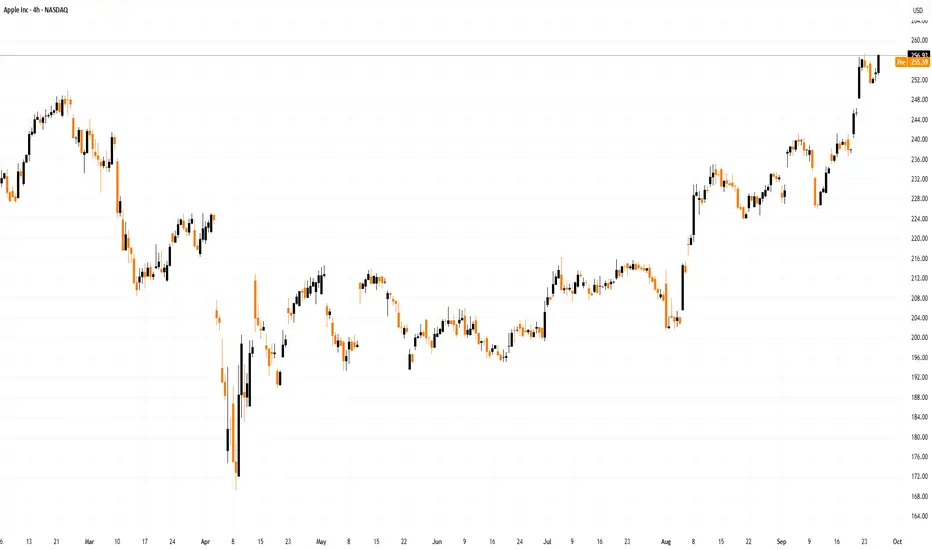
AAPL Bullish Swing Setup – Buy the Dip for $289 Target1. Chart Type & Timeframe
Symbol: Apple Inc. (AAPL)
Timeframe: 4H (4-hour candles)
Platform: TradingView
This is a short- to medium-term analysis, not a long-term forecast.
2. Trend Analysis
The price is in a rising channel (marked in red), meaning the overall trend is bullish.
Currently, the

TSLA LONG SWING READ NOTES 25 SEP 2025I have bought some Tesla stocks now around $424 for swings. I know market is all time high & Tsla can do $450 here. I am just taking market over all support which is again very poor.
This is an average trade
If you are not confident dont trade.
I have gone long with stocks only

Apple Shares (AAPL) Close to Reaching Record HighApple Shares (AAPL) Close to Reaching Record High
On 10 September, we noted that following the launch of new products — including the iPhone 17 — AAPL shares had fallen by approximately 1.5%, as analysts considered the model lacked the breakthrough appeal necessary to drive further growth.
Howeve
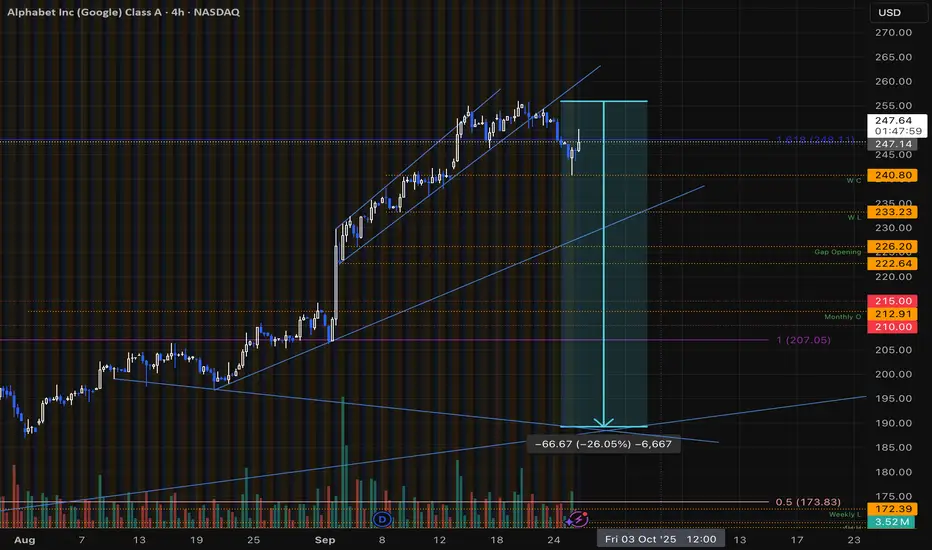
Google to $185 by EO next WeekAfter touching the 1.618 fib level, the extension of this rally is completed.
Technical Reasons to be (aggressively) short
- Rejection at 1.618 fib level
- breaking upward channel with retest
- breaking the previous Week Low
Fundamental reasons
- Multiple cases across the world
- $3 Billion fin
See all stocks ideas
Today
PZGParamount Gold Nevada Corp.
Actual
−0.02
USD
Estimate
−0.02
USD
Today
BNEDBarnes & Noble Education, Inc
Actual
—
Estimate
—
Today
LITSLite Strategy, Inc.
Actual
—
Estimate
—
Today
DTSSDatasea Inc.
Actual
—
Estimate
—
Today
ANEBAnebulo Pharmaceuticals, Inc.
Actual
—
Estimate
−0.07
USD
Today
IXHLIncannex Healthcare Inc.
Actual
—
Estimate
−0.29
USD
Today
GMGIGolden Matrix Group, Inc.
Actual
—
Estimate
−0.00
USD
Today
TAYDTaylor Devices, Inc.
Actual
—
Estimate
0.69
USD
See more events
Community trends
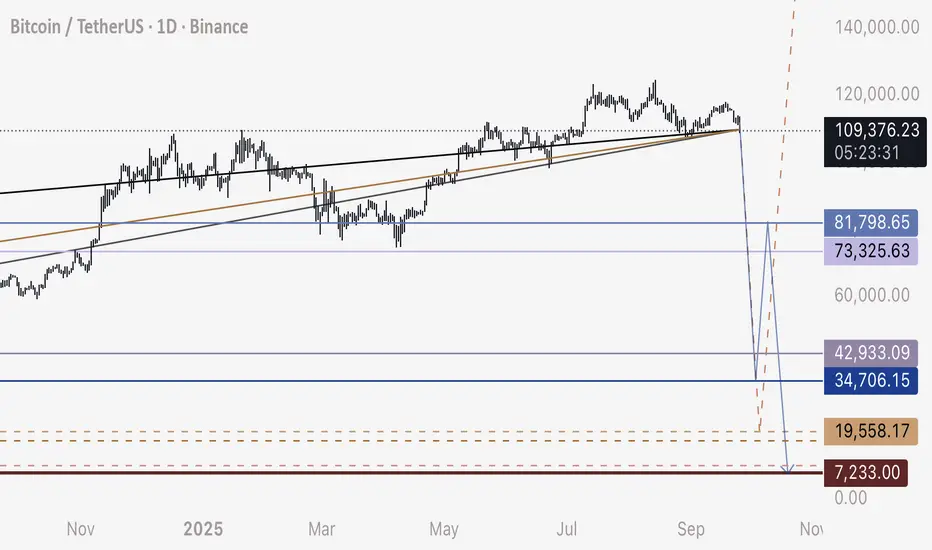
Bitcoin Short Update - Updated Targets and Corrective MoveHi all,
Short update on my BTC short - with updated numbers and anticipated zig zag correction.
I’m updating frequently because this drop will happen extremely fast. Only those who are prepared before hand will be able to take advantage.
110,000 to 35,000
35,000 to 81,000
81,000 to 8,000
Ta
Bitcoin - Sacrificed by the banks! (100k, then 130k - buy here)Bitcoin and the whole crypto market have been dropping heavily these days. And I know why! You may wonder, why is Bitcoin in such a weak uptrend, and why do the majority of altcoins never grow, or after a small pump, a huge dump follows? Finally, I bring you the answer to this important question man

BTCUSD: Awaiting Rejection from the Seller ZoneHello everyone, here is my breakdown of the current Bitcoin setup.
Market Analysis
From a broader perspective, the price action for Bitcoin has been highly volatile, transitioning from a Downward Channel into the current Broadening wedge. This pattern is defined by higher highs and lower lows,

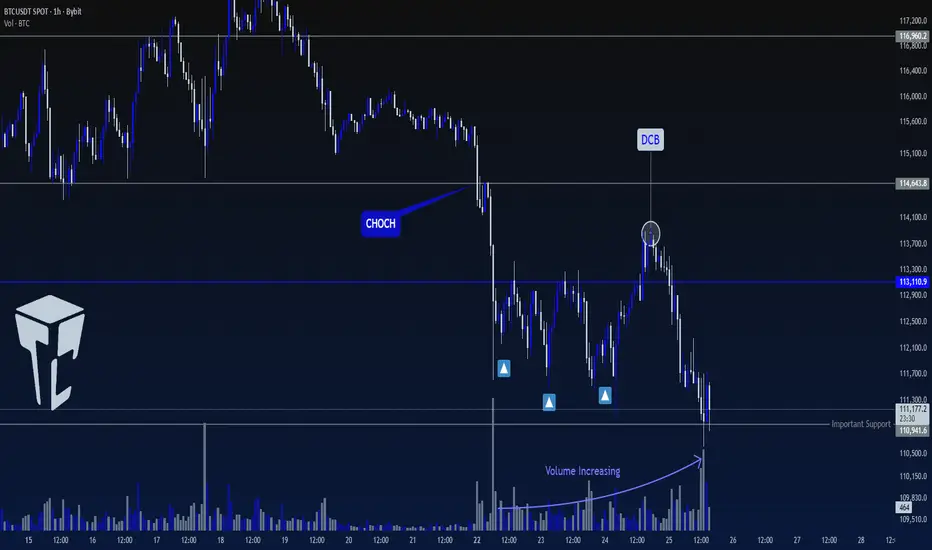
Bitcoin Setup: Eyeing CME Gap at $113KBitcoin( BINANCE:BTCUSDT ) is currently trading in a Heavy Support zone($112,000-$105,800) and near the Support zone($110,920-$109,900), Support lines, Potential Reversal Zone(PRZ) , and Cumulative Long Liquidation Leverage($110,430-$109,660).
In terms of Elliott Wave theory, Bitcoin seems to have

#BTC/USDT THE ONLY BITCOIN CHART YOU NEED!BTC : Almost There!
BTC is currently following the trajectory shown in my last chart. It took some time, but it’s playing out exactly as expected. Sooner or later, a bounce is coming — there’s no reason to panic unless we break below $103.5K, which is the key support level.
You need to understand

Bitcoin I Daily Range Manipulated - chance for push upHello traders, as you know when range low is manipulated price goes to the opostin liuqditiy for the stop hunt. Order flow changed to the bullish. there is chance that we are in distribution phase.
🧪This concept is very easy to follow here are few examples of the recent trades.
✅ EURUSD - Stop hu

BTCUSD: Bearish Reversal on the Horizon?👋Hello everyone, what do you think about BITSTAMP:BTCUSD ?
Bitcoin is showing signs of a bearish reversal as it tests the lower boundary of its rising channel, with the likelihood of a breakdown below the trendline increasing. The diamond pattern also seems to be completing, signaling further do

TradeCityPro | Bitcoin Daily Analysis #180👋 Welcome to TradeCity Pro!
Let’s move on to Bitcoin analysis. Yesterday Bitcoin continued its drop and made another downward move. Let’s check the market together.
⏳ 1-Hour Timeframe
Bitcoin in the 1-hour timeframe started a downward move and, with consolidation below the 114643 area, turned beari
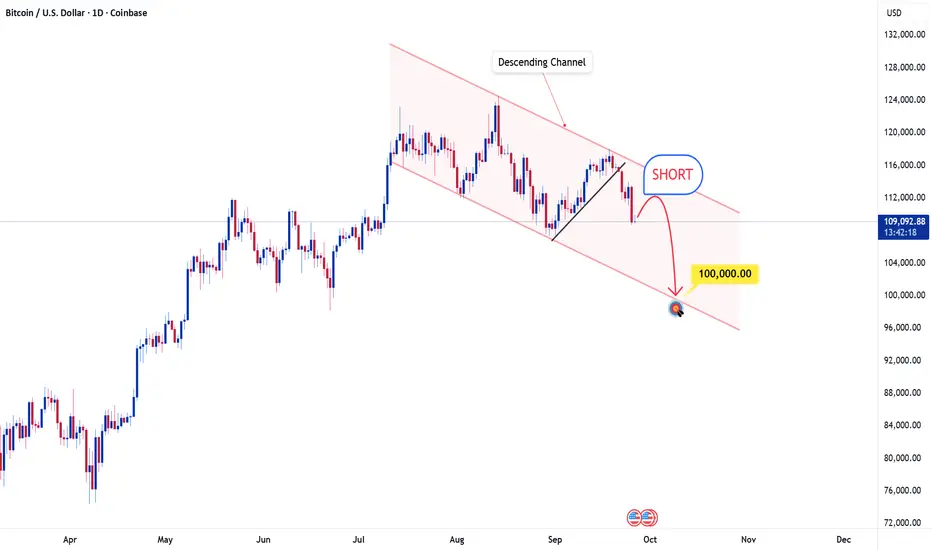
Bitcoin Setup: Will the Bears Push the Price Down to $100,000?Hey everyone, what’s your view on Bitcoin at the moment?
From a technical standpoint, Bitcoin is clearly in a downtrend, moving within a descending channel that shows strong bearish momentum. The price is currently at an important support level after a significant drop. As the market approaches the
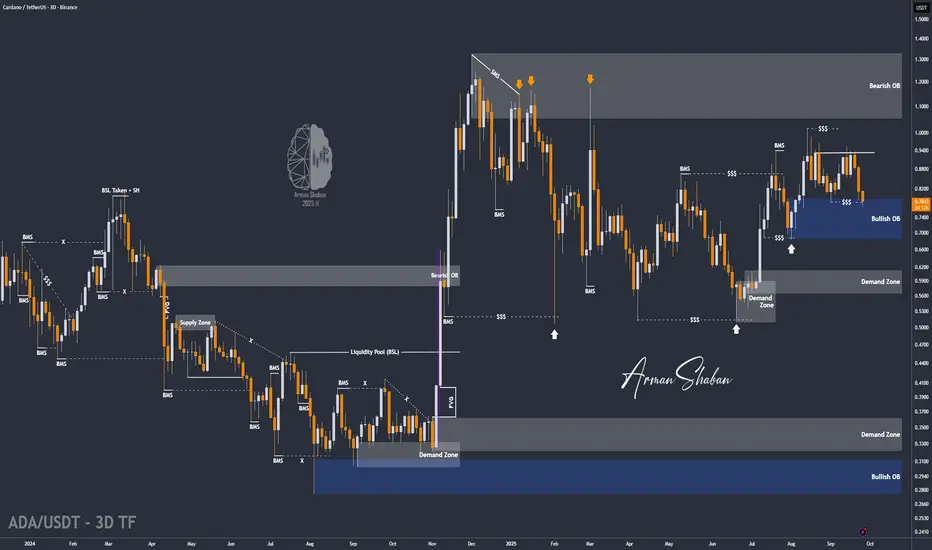
ADA/USDT | ADA Testing $0.68–$0.78 Demand – Next Pump Ahead?By analyzing the Cardano (ADA) chart on the 3-day timeframe, we can see that the price started correcting as expected and has now reached $0.78, entering the key $0.68–$0.78 demand zone. Now we need to see whether this zone can stop ADA from dropping further.
If the price holds in this strong deman
See all crypto ideas
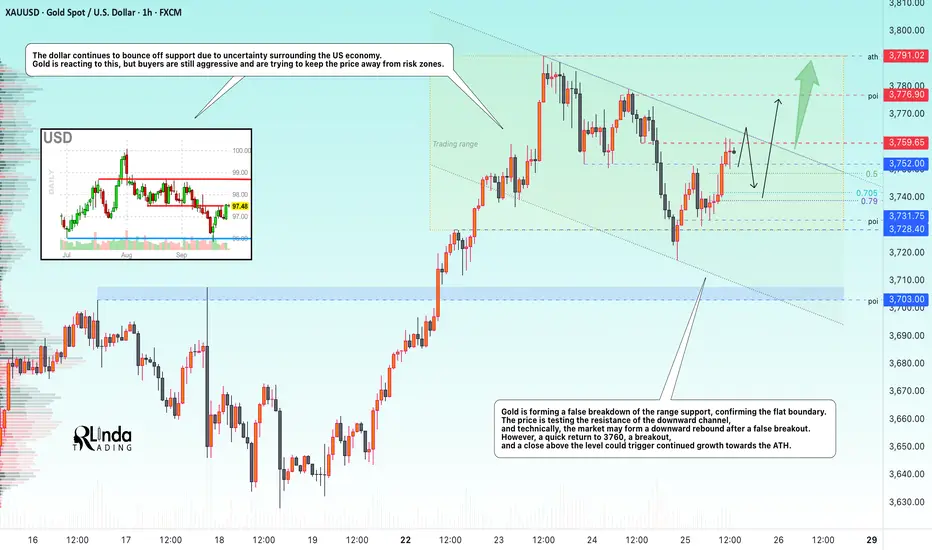
GOLD → Will the correction continue, or is it time for growth?FX:XAUUSD is inside a descending channel—corrections within a global bullish trend. The price is forming a retest of resistance, and the market's reaction to the 3760 zone will give further insight into price movement...
Gold is consolidating in the range of 3730-3790 in anticipation of US economi
XAU/USD | Gold at $3,740 – Demand Zone Decides the Next MoveBy analyzing the Gold chart on the 1-hour timeframe, we can see that yesterday the price finally started a correction, dropping to $3,717 . From this key psychological level, demand stepped in and pushed gold strongly up to $3,761 .
Currently, gold is trading around $3,740 , but it hasn’t full

Lingrid | GOLD Retracement Complete Potential ContinuationOANDA:XAUUSD pulled back after hitting the 3,790 resistance but continues to respect the upward trendline and channel structure. Price action shows a trend continuation setup with consolidation zones acting as mid-support. As long as 3,730 holds, buyers may attempt another push toward the 3,800 and

Gold can Resume its Uptrend After This CorrectionHello traders, I want share with you my opinion about Gold. The market context for Gold has been firmly bullish since the price action reversed from the deep 3335 - 3355 buyer zone, a move which established the current, well-defined upward channel. This bullish structure has since been guiding the p

GOLD IS READY TO MAKE A BIGGER CORRECTIONGOLD IS READY TO MAKE A BIGGER CORRECTION
Yesterday gold rose to 3778 and created a false bullish rally and fell to 3716.
Today gold rose again to 3761 inside the structure area and created another false bullish rally.
After better-than-expected data from the US, we can see that gold has starte

Latest Gold Price Update Today👋Hello everyone, it's great to be back! Let's take a look at OANDA:XAUUSD !
Gold continues to maintain a strong uptrend, supported by the Federal Reserve's monetary policy. Recently, statements from the Fed about maintaining accommodative monetary policy and expectations of further rate cuts are

THE KOG REPORT - UpdateEnd of day update from us here at KOG:
Not bad at all! We got a decent trade early session on the hot spots and Excalibur, only then to have a quiet session while we waited for the right set up, got the break we wanted and we managed to complete most of the targets downside.
Ideally, we want to s

Gold at Key Decision Zone: Breakout or Breakdown?Hello guys!
Let's analyze Gold!
🔸 Current Market Structure
Price is consolidating inside a symmetrical triangle after a strong bullish run.
Momentum remains positive, but sellers are defending the upper trendline.
Key short-term support is around 3,720 – 3,710 zone.
🔺 Bullish Scenario (Mo
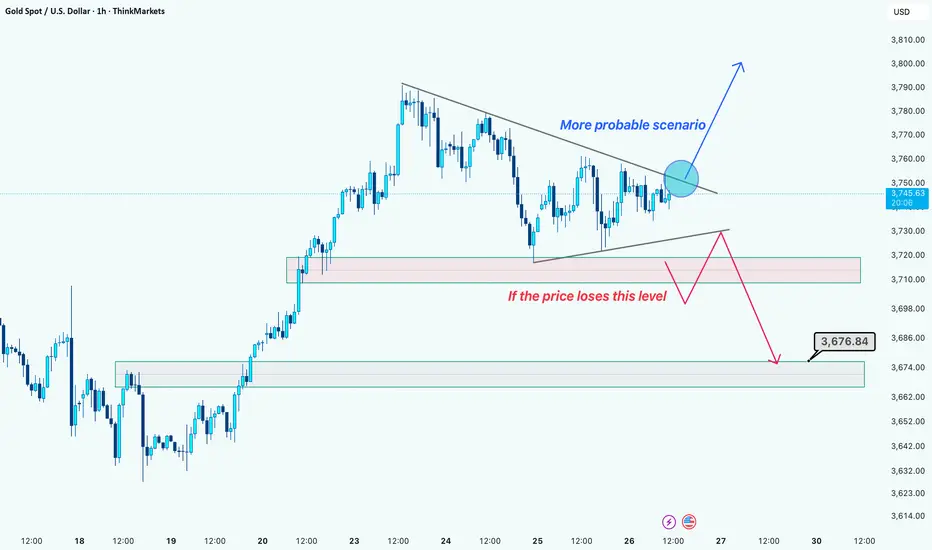
Gold consolidating between two key ranges above recent highsGold is currently consolidating between two key ranges after failing to sustain above recent highs. The metal hovered below 3740 per ounce on Thursday, marking its second consecutive decline since hitting a record high of 3792 earlier in the week. The pullback was driven largely by strong U.S. econo

XAU/USD: Strong Rebound After Testing $3,720 SupportHello everyone, let’s take a closer look at gold (XAU/USD) after the latest market moves.
At present, gold is undergoing a mild pullback from $3,748, though the primary trend remains bullish after testing the key support area at $3,720. Following the strong upward rally, profit-taking emerged as p

See all futures ideas
EUR/USD: Waiting for BreakoutLooks like EURUSD might be heading down.
I saw a confirmed breakout of a rising trend line on the 4H chart.
The sellers need to break the 1.1746 - 1.1724 support on the 4H.
If they do, it's a big bearish sign.
If the downtrend continues, we're looking at 1.1684 at least.

EURUSD - Bears are taking control!Introduction
This chart analysis of EUR/USD highlights key price action concepts such as liquidity grabs, fair value gaps, and inversions on the four-hour timeframe. By examining how the market has been moving recently, we can better understand where price may head next and how institutional activi

EUR/AUD - Breakout Pattern|Buy Opportunity (26.09.2025)The EUR/AUD pair has been trading inside a descending wedge formation and is now showing a potential breakout to the upside.
🔹 Price successfully tested the trendline resistance and is gaining bullish momentum.
🔹 Buyers are stepping in after multiple rejections near the lower boundary (A–C trendlin

GBP/JPY - BOJ Holds Rates, Inflation Outlook RisesOANDA:GBPJPY #GBPJPY #Forex #Trading #FXAnalysis #TechnicalAnalysis #PriceAction #BankOfJapan #ForexTrader
The Bank of Japan decided to keep interest rates unchanged while raising its inflation forecast. This shows caution but also optimism that cooperation with the U.S. could support Japan’s eco

EURUSD Long: Reversal from Wedge Support ExpectedHello, traders! The prior market structure for EURUSD was a bullish ascending channel, which concluded with a pivot point high at the SUPPLY 2 level of 1.1835. A subsequent breakdown from that channel shifted the market's momentum, initiating a corrective phase that has since taken the form of a dow

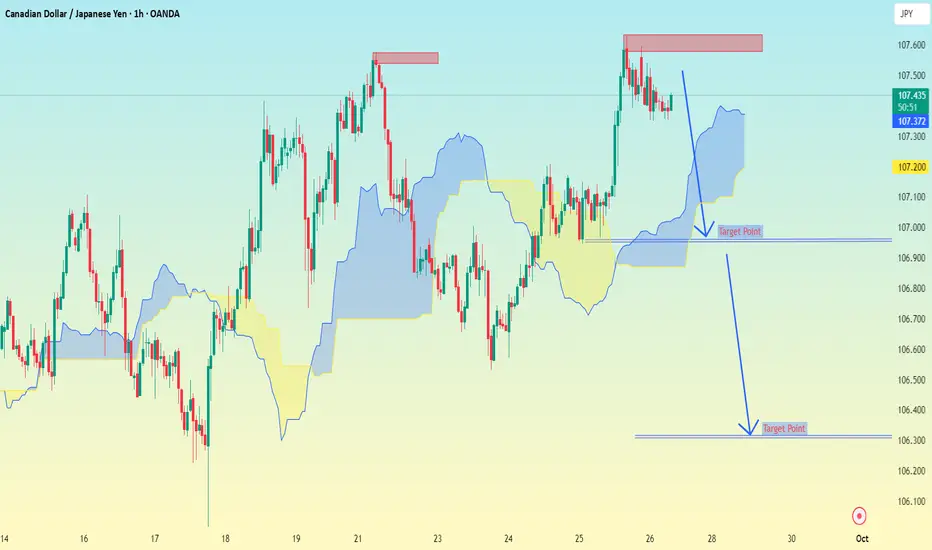
CAD/JPY 1H chart Pattern..CAD/JPY 1H chart:
Current price is around 107.43.
I have already marked two downside target levels with arrows.
📉 Targets shown:
1. First target: ~ 107.00
2. Second target: ~ 106.30
So if CAD/JPY continues to reject from the red resistance zone, my downside targets are:
TP1 → 107.00
TP2
EURJPY Holds Above 174.50: Bulls in ControlEURJPY Holds Above 174.50: Bulls in Control
Two days ago, EURJPY broke through a strong resistance area near 174.50.
The fact that price is holding firmly above this level strengthens the bullish setup.
EUR remains strong for now, and the pair could extend its short-term upside toward 175.20 a

26.09.25 Morning ForecastPairs on Watch -
FX:EURAUD
A short overview of the instruments I am looking at for today, multi-timeframe analysis down to what I will be looking at for an entry. Enjoy!

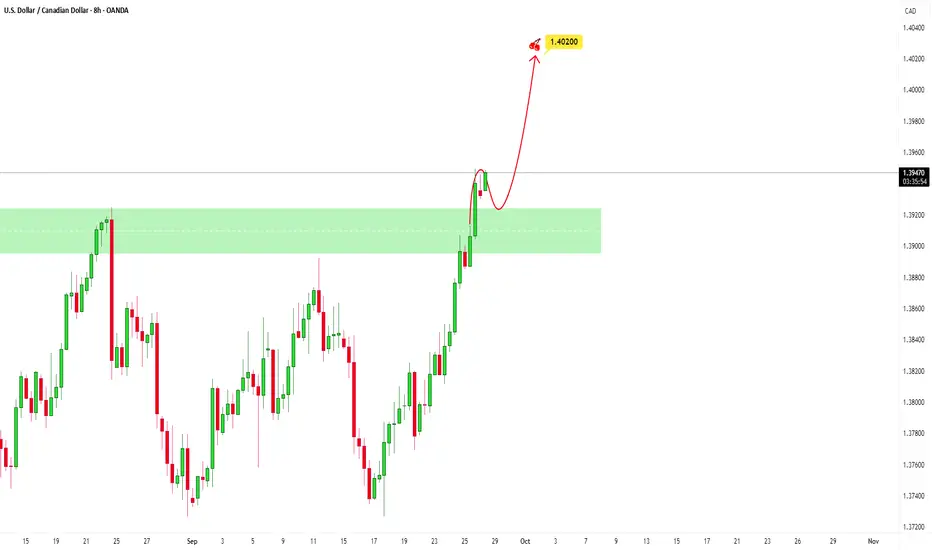
USDCAD Could continue higherBuyers managed to break price above the key resistance zone, showing strong conviction as they pushed through the area with strength.
If price pulls back into the broken level and buyers successfully defend it, holding above and rejecting downside attempts, that becomes our long confirmation. The
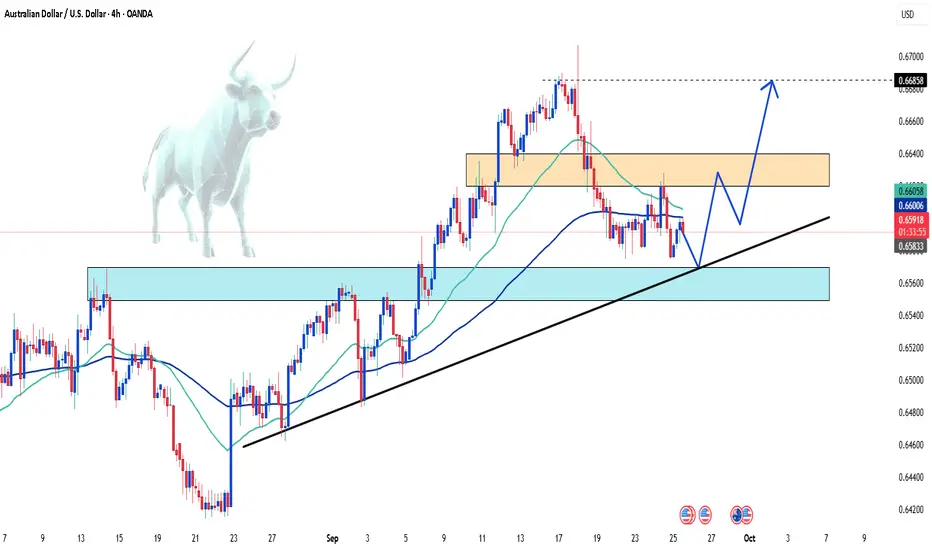
AUD/USD: Preparing for a Bounce from Key Support ? 👋Hello everyone, let’s take a look at OANDA:AUDUSD !
Recently, the pair has shown strong bullish momentum, reaching a new high at 0.6685, and is now in a retracement phase as the price moves closer to the support zone at 0.656.
The Australian Dollar is supported by a relatively stable commodity
See all forex ideas
| - | - | - | - | - | - | - | ||
| - | - | - | - | - | - | - | ||
| - | - | - | - | - | - | - | ||
| - | - | - | - | - | - | - | ||
| - | - | - | - | - | - | - | ||
| - | - | - | - | - | - | - | ||
| - | - | - | - | - | - | - | ||
| - | - | - | - | - | - | - |
Trade directly on the supercharts through our supported, fully-verified and user-reviewed brokers.


