EUR/AUD at a Crossroads!The EUR/AUD pair is trading in an upward trend on the four-hour timeframe following the pullback that took place between November 25 and December 10.
The pair is now at a crossroads between continuing the upward trend from the current support levels at 1.77340 and 1.77154, targeting 1.77792 as the
Your 2025 space mission is here
Suit up and get ready to explore every highlight of your trading galaxy.


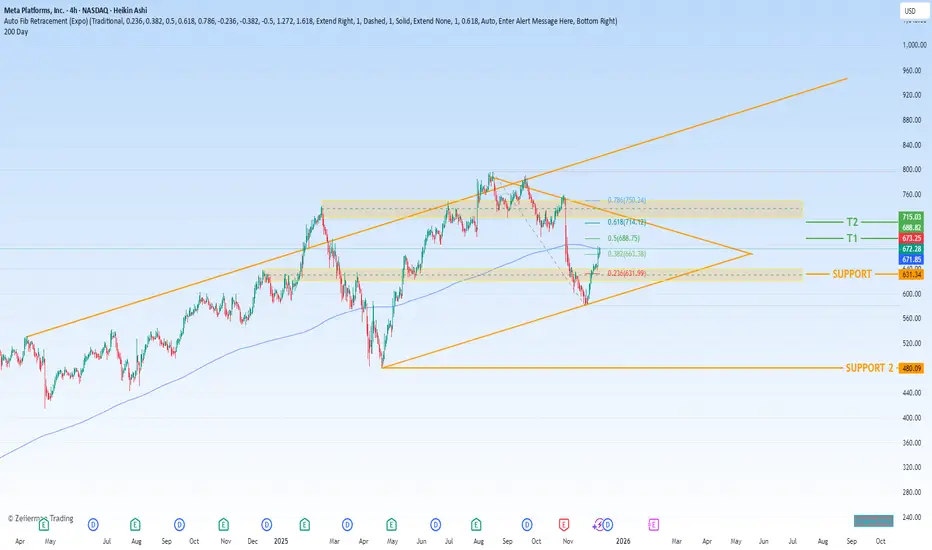
Navigating Volatility Amid Unprecedented Scale and Future InvestNASDAQ:META Meta Platforms, Inc. (META) presents a compelling bullish case rooted in its unparalleled execution within the digital advertising core business, juxtaposed against significant strategic investments in future technologies—investments that, while costly, are funded by immense cash flows
GC(XAU/USD) technical analysis and directional opinion*In this analysis I will not include macroecnomic analysis as we all know broad financial market is waiting for BoJ to create clear directional bias upcoming end of this week on Friday. However I will make a seperate post regarding "How to decode BoJ decision" on the day before the Japanese rate dec

Nasdaq-100: Lower Low and Lower High?The Nasdaq-100 made a lower low, and now it might have made a lower high.
The first pattern on today’s chart is the November 21 low of 23,854, some 353 points below the October trough. That broke a series of higher lows since April.
Second, the tech-heavy index peaked at 25,835 on December 10. Tha

Lingrid | GOLD Sideways Movement Ahead of FOMC DecisionOANDA:XAUUSD perfectly played out my previous trading idea . Price is holding inside a well-defined consolidation after its prior surge, with price rotating above the rising channel base. The trend remains constructive, but momentum has cooled, suggesting participants are waiting for a catalyst ra

BOJ to Stress Test Global Markets? Why a Black Swan Is PossibleWhile US markets are busy debating AI valuations and parsing the Fed’s latest rate cut , something far more understated — and potentially more disruptive — is brewing across the Pacific.
The Bank of Japan is expected to raise interest rates on Friday, marking what could be its first hike in 11 mon

GOOG: Is a 10% Surge Imminent? The Setup for $340 Explained🚀 NASDAQ:GOOG : Is a 10% Surge Imminent? The Setup for $340 Explained
In the noisy world of trading, clarity is power.
Today, we are looking at Alphabet Inc. (GOOGL). We are not predicting the future, we are simply preparing for a high-probability outcome.
We have identified a textbook Bull Fla

DOGE pulls back before major decline DOGECOIN is in a range formed against the backdrop of a downtrend. The market is under pressure from above at 0.155 - 0.153 - 0.150. The structure is bearish. The rebound from 0.134 is directed towards 0.1415. A false breakout could trigger a decline.
There is no volume from the bulls, and the mark

BTC Corrections Don’t Kill Bull Market. They Power Them1. Primary Trend Structure
Macro trend: Clearly bullish. Price has respected a rising diagonal trendline since the 2022–2023 cycle low. Market structure shows higher highs and higher lows, confirming an intact uptrend.
This is a classic bull market staircase: impulsive advances (green boxes) follo

2025 BITCOIN TARGETS: Reality Check
Forecasting is easy. Being right is hard.
1. When Targets Turn Into Illusions
Look at this chart.
Bitcoin at $90,000. Sixteen days left in 2025.
And every “expert” target — JPMorgan, VanEck, Standard Chartered, Tom Lee, Kiyosaki, BlackRock, Cathie Wood —
all of them missed. Every single one.

See all editors' picks ideas
Multi-Ticker Anchored CandlesMulti-Ticker Anchored Candles (MTAC) is a simple tool for overlaying up to 3 tickers onto the same chart. This is achieved by interpreting each symbol's OHLC data as percentages, then plotting their candle points relative to the main chart's open. This allows for a simple comparison of tickers to tr

Vdubus Divergence Wave Pattern Generator V1The Vdubus Divergence Wave Theory
10 years in the making & now finally thanks to AI I have attempted to put my Trading strategy & logic into a visual representation of how I analyse and project market using Core price action & MacD. Enjoy :)
A Proprietary Structural & Momentum Confluence System

Per Bak Self-Organized CriticalityTL;DR: This indicator measures market fragility. It measures the system's vulnerability to cascade failures and phase transitions. I've added four independent stress vectors: tail risk, volatility regime, credit stress, and positioning extremes. This allows us to quantify how susceptible markets are

Volatility Risk PremiumTHE INSURANCE PREMIUM OF THE STOCK MARKET
Every day, millions of investors face a fundamental question that has puzzled economists for decades: how much should protection against market crashes cost? The answer lies in a phenomenon called the Volatility Risk Premium, and understanding it may fundam

Volume Gaps & Imbalances (Zeiierman)█ Overview
Volume Gaps & Imbalances (Zeiierman) is an advanced market-structure and order-flow visualizer that maps where the market traded, where it did not, and how buyer-vs-seller pressure accumulated across the entire price range.
The core of the indicator is a price-by-price volume prof

Match Finder [theUltimator5]Match Finder is the dating app of indicators. It takes your current ticker and finds the most compatible match over a recent time period. The match may not be Mr. right, but it is Mr. right now. It doesn't forecast future connection, but it tells you current compatibility for today.
Jokes aside,

Trend Line Methods (TLM)Trend Line Methods (TLM)
Overview
Trend Line Methods (TLM) is a visual study designed to help traders explore trend structure using two complementary, auto-drawn trend channels. The script focuses on how price interacts with rising or falling boundaries over time. It does not generate trade sign

Breakouts & Pullbacks [Trendoscope®]🎲 Breakouts & Pullbacks - All-Time High Breakout Analyzer
Probability-Based Post-Breakout Behavior Statistics | Real-Time Pullback & Runup Tracker
A professional-grade Pine Script v6 indicator designed specifically for analyzing the historical and real-time behavior of price after strong All-Ti

Count█ OVERVIEW
A library of functions for counting the number of times (frequency) that elements occur in an array or matrix.
█ USAGE
Import the Count library.
import joebaus/count/1 as c
Create an array or matrix that is a `float`, `int`, `string`, or `bool` type to count elements from, t

Holographic Market Microstructure | AlphaNattHolographic Market Microstructure | AlphaNatt
A multidimensional, holographically-rendered framework designed to expose the invisible forces shaping every candle — liquidity voids, smart money footprints, order flow imbalances, and structural evolution — in real time.
---
📘 Overview
The Hol

See all indicators and strategies
Community trends
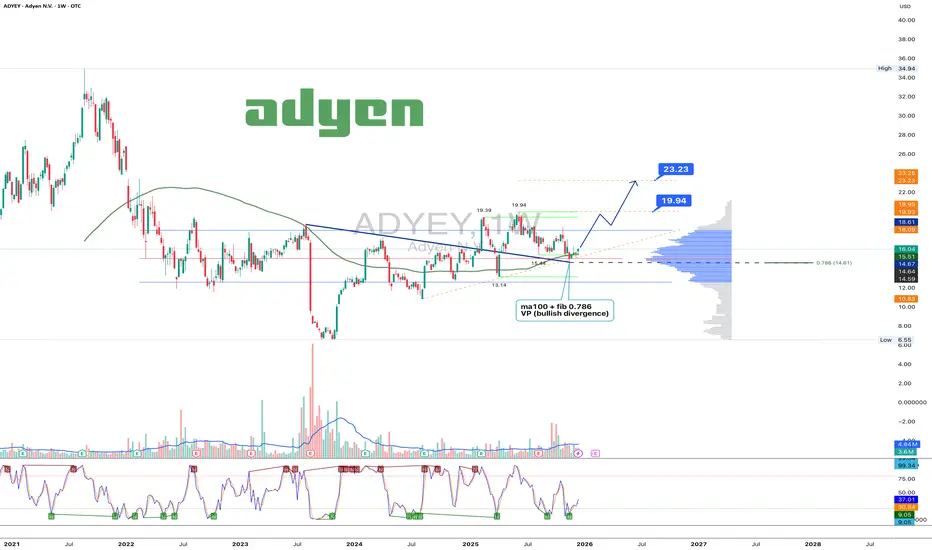
Adyen 1W: The trend broke twice, the market is just catching upOn the weekly chart, Adyen has broken the long term downtrend twice, and price is now performing a controlled pullback retest. The current consolidation holds above the $15.5–16.0 demand zone, where MA100, 0.786 Fibonacci and strong volume profile support align. Selling pressure is fading, volumes
"VG" Inverse Head & Shoulders Pattern @ 1H FrameThe price action of the 1H timeframe shows a well developed inverse head and shoulders pattern, which is a classically a trend-reversal formation from bearish to bullish.
The neckline is sloping slightly downward, curranty around 6.3 - 6.35

TSLA:Quadruple Witching Day Update:Wave 3 ExtensionvsTruncation TSLA Quadruple Witching Day Update: Wave 3 Extension vs Truncation – Key Level 474 Decides
TSLA Elliott Wave Update – Quadruple Witching Day (December 19, 2025)
Good morning folks! Here's the latest Elliott Wave analysis for Tesla (TSLA) on this high-volatility Quadruple Witching Day.
Primary

$MRNA: campaign trading started# Moderna’s Major Collaborations
## Co-Development and Research Partnerships
- Merck & Co.: Joint development of personalized cancer vaccine mRNA-4157, combining Moderna’s mRNA platform with Merck’s KEYTRUDA® immunotherapy.
- AstraZeneca: Collaboration on RSV vaccine mRNA-1345, advancing Phase 3

Fasten your seatbelts, we're about to take off!Rocket Lab (RKLB) is approaching a decisive technical inflection point after several weeks of heavy correction. The structure is shifting: compression, potential breakout, and early momentum recovery. Everything is lining up for a strong directional move.
Overall Structure
Price is attempting to b

UBER shortSupply Zone had been confirmed
Looks like ABC Pattern.
Stop 93,
Short entry 91
Target 82, 75
Risk management is much more important than a good entry point.
I am not a PRO trader.
In my trading plan, the Max Risk of each short term trade should be less than 1% of an account.

HRTG correlated with XLF (Bollinger Band Squeeze)I notice this stock HRTG looks very well correlated with XLF Financial Select Sector SPDR. I'm in a BB Squeeze Long Trade on the stock.

PLTR GEX - Bull Flag Breakout SetupPLTR Technical & Options Setup Overview
PLTR is setting up a clean bull flag breakout on the daily chart, following a strong impulsive leg higher.
The consolidation has been holding above the 50-day moving average , which has acted as dynamic support throughout the flag structure. Two sessions

Is Visa Ready for a Deeper Drop? Key Daily Levels in Focus👋 Hello & Respect to All Traders
Hello and respect to all traders and dedicated TradingView followers 🙌
Wishing you disciplined trades, solid risk management, and consistent execution 📊🧠
💳 Visa Inc. – Company Overview
Visa Inc. (V) is one of the world’s largest electronic payment networks, provid

Triple bottom, potential (devastating) double-UpThe price is moving near its lows despite steadily increasing revenue.
The current formation is a double or triple bottom with a neckline at $29.3. At the moment, the price continues to decline, following the blue resistance — it’s better to wait for a breakout with a close above it before starting

See all stocks ideas
Tomorrow
EBFEnnis, Inc.
Actual
—
Estimate
0.41
USD
Dec 23
USBCUSBC, Inc.
Actual
—
Estimate
−2.40
USD
Dec 23
GTIMGood Times Restaurants Inc.
Actual
—
Estimate
—
Dec 23
LMNRLimoneira Co
Actual
—
Estimate
−0.11
USD
Dec 31
JVACoffee Holding Co., Inc.
Actual
—
Estimate
—
Dec 31
MSSMaison Solutions Inc.
Actual
—
Estimate
0.00
USD
Dec 31
KAVLKaival Brands Innovations Group, Inc.
Actual
—
Estimate
—
Jan 1
FCFranklin Covey Company
Actual
—
Estimate
0.04
USD
See more events
Community trends
Bitcoin’s Next Move Starts Here Key Levels MappedBTC is currently in a technically critical phase. Price is trading below a major dynamic trendline resistance after a confirmed bearish break, keeping the broader structure corrective rather than impulsive. Momentum remains capped unless bulls reclaim key dynamic levels.
The plan from here is stra

BTCUSDTHello Traders! 👋
What are your thoughts on Bitcoin?
Bitcoin has entered a corrective phase after a strong bearish move and is currently ranging between a clearly defined support and resistance zone. As long as price remains inside this range, no major directional move is expected.
At the moment,

BITCOIN - Manipulation and liquidity hunting before the crash BINANCE:BTCUSDT.P is stuck in the range of 85K - 90K. There is no liquidity in the market, but at the same time, the downward trend continues...
Earlier, we discussed such a nuance as the breakdown of support for the upward local trend. The global trend is bearish, and this nuance generally in

BTC – Weak Rebound Below EMAs, Bias Still Toward CorrectionHello everyone, Domic here.
Looking at BTC on the H4 timeframe right now, the overall feeling is not panic — but there is certainly nothing reassuring either. Price is trading around 85,700 USD, sitting firmly below both the EMA34 and EMA89, and that alone already says a lot about the current mark

$USDT Dominance Is it really different this time?CRYPTOCAP:USDT has broken a major resistance across multiple timeframes, showing clear strength.
Technically, this is not a positive sign for CRYPTOCAP:BTC and other altcoins.
Tether has been in an uptrend for the last 75 days. A reversal could be around the corner in Q1 2025, but for now, the st

ICP — 99.96% Down From ATH | Generational Bottom FormationAfter nearly 5 years of continuous distribution and capitulation, ICP appears to have completed a full macro bear cycle. Price is ~99.96% down from ATH and has formed what looks like a final all-time low around $1.16, followed by prolonged sideways consolidation — a classic sign of seller exhaustion

BTC at Premium Zone | Smart Money Eyes Lower Levels📝 Description
Market structure on M15 remains bearish within the higher-timeframe context, despite the recent bullish retracement. Price is now retracing into a premium zone, aligning with the H1 OTE (0.618–0.786) of the last bearish displacement, without any confirmed CHOCH + BOS combination to val

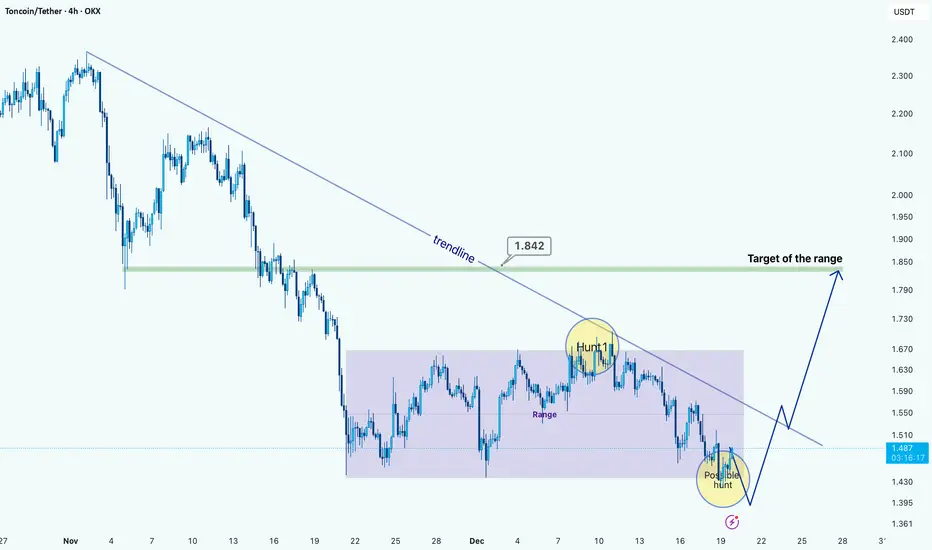
TON/USDT: Range Structure Within a Broader DowntrendHi!
TON is still trading under a well-defined descending trendline, confirming that the higher-timeframe structure remains bearish. After the impulsive sell-off, the price transitioned into a clear consolidation range, highlighted on the chart. This range shows multiple reactions at both extremes,
DodgeCoin About to Hit Major Support Level - Whales Alert!Is this what they are waiting for? Whales expecting to buy Dodge at pennies? :) and pump it up again!
Main Reason is that, people are waiting and observe the market, This behaviour actuate the inactive behaviour of the Dodge and many other cryptos. Once there is none to minor trading activity / tr

Hey guys guess what !!! $BTC is strong !!!If we pump this we break out of a long down trend. If you look to the left we have a similar structure that broke out the same way.
Do you think we can see history repeat it self ?
Comment like and share for more charts.
(If you need me to draw something up for you comment bellow)

See all crypto ideas
XAUUSD Short: Supply Zone Holds - Gold Slips Into CorrectionHello traders! Here’s a clear technical breakdown of XAUUSD (Gold) based on the current chart structure. Gold is still trading within a broader ascending trend, supported by a well-defined rising trend line from the pivot point. The market previously made an impulsive bullish move, but price has now

XAU Near All-Time Highs Bullish Continuation or Fake Breakout?Hello and respect to all TradingView followers 🙌
Hope you’re having profitable trades and disciplined risk management 📊💚
🟡 Gold Market Overview (XAUUSD)
Gold has always been considered a safe-haven asset, especially during periods of economic uncertainty, inflationary pressure, and geopolitical te

Gold 1H – CPI Data Uncertainty Fuels Liquidity Traps at Extremes🟡 XAUUSD – Intraday Smart Money Plan | by Ryan_TitanTrader (19/12)
📈 Market Context
Gold is trading in a tightly engineered range as markets digest the latest U.S. CPI print, which has drawn caution from economists over data reliability and seasonal distortions.
Despite headline inflation showing si

GOLD Is Going Down! Sell!
Here is our detailed technical review for GOLD.
Time Frame: 1D
Current Trend: Bearish
Sentiment: Overbought (based on 7-period RSI)
Forecast: Bearish
The market is trading around a solid horizontal structure 4,340.66.
The above observations make me that the market will inevitably achieve 4,164.

FCPO Important LevelFCPO has been falling for 4 consecutive months. The important level is 3700. If the 3700 level is broken, FCPO is likely to fall again to 3250. My expectation is that FCPO will continue to close the bearish candle of December 2025. The January 2026 candle will determine whether the price will contin

GOLD (XAU/USD) PRICE ACTION OUTLOOK – MONDAY, 22 DECEMBER 2025 Based on current price action structure, Gold (XAU/USD) is showing strong bullish potential and may pump on Monday, 22 December 2025.
The market is respecting key support zones, and bullish momentum could continue if price holds above these levels. Buyers should look for confirmations around the ma

Weekly review of Overall Market
Commodities:
Gold has been running a good uptrend for a while, now looking it is going to break out again after this consolidation.
US Stocks:
SNDK and XMTR looking really nice as it consolidates, top and bottom of orange bar are the entry and stop loss respsectively.
Have a nice Christma

S&P Futures Trading Day 85 — Watching the Market Run Without MeEnded the day +$80 trading S&P Futures. My pre-market analysis spotted a potential breakout from the recent downtrend, with the only major resistance looming ahead at the 6890s. I set my plan to short that resistance and look for longs at the 5-minute MOB. Unfortunately, I was just a step too late o

After retouching life time high, gold is retracing.After retouching life time high, gold is retracing. It may consolidate at this level.

Gold Prices May Reach New Highs Next WeekGold Prices May Reach New Highs Next Week
As shown in the chart: The following is a top-level technical analysis of the current gold price:
1: Trend Resistance Level: 4380-4400
2: Strong Resistance Zone: 4350-4380
3: Bull-Bear Battle Zone: 4330
4: Strong Support Zone: 4305-4320
5: Trend Suppor

See all futures ideas
GBPUSD - Relief Rally Into Resistance? Sellers Watching Closely📉GBPUSD remains overall bearish on the higher timeframe. Price is still trading within a descending structure, and the broader trend continues to favor sellers rather than buyers.
The recent upside move is best viewed as a corrective bounce, not a trend reversal. Price is now approaching a key con

EURUSD: Rejection From Key Resistance - Support 1.1660 in FocusHello everyone, here is my breakdown of the current EURUSD setup.
Market Analysis
EURUSD is trading within a broader corrective structure, and the current price action suggests increasing bearish pressure near key resistance. Earlier, the pair formed a triangle structure, where price respected bo

EURUSD Strong Bearish Continuation ScenarioQuick Summary
EURUSD continues to decline with strong momentum and is expected to extend the move toward 1.16610. There is currently no technical reason supporting a bullish reversal since all upside levels are already mitigated. However, if price rallies first toward the equal highs at 1.17633, th

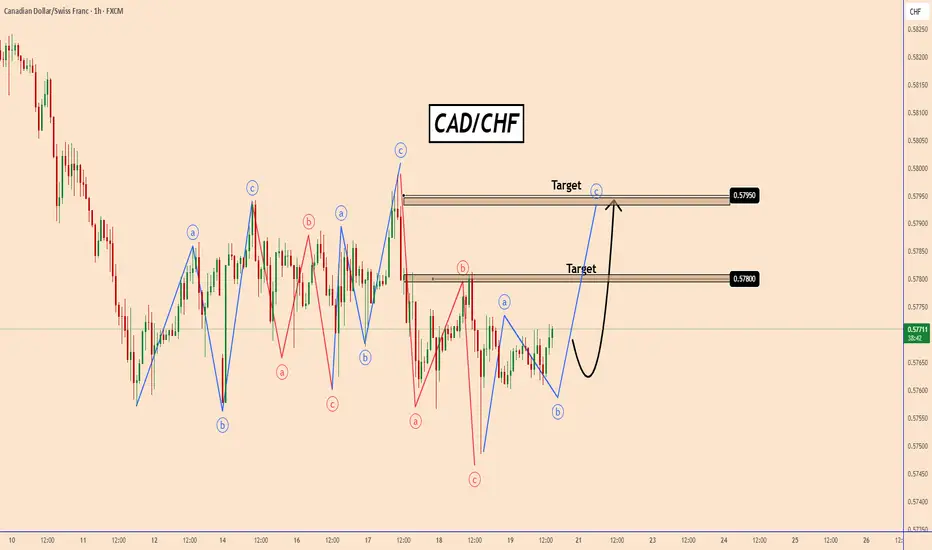
CADCHF – Corrective ABC Near Completion, Wave C in FocusCADCHF – Corrective ABC Near Completion, Wave C in Focus
CADCHF is moving within a large corrective pattern which is taking shape with corrective waves ABC.
At the moment it seems that corrective wave B is about to end and CADCHF may start impulsive wave C which could push CADCHF even above the
USDJPY Still Hot – 157.00 Is CallingHello traders,
USDJPY is currently showing a short-term bullish bias , as the narrative of a weak JPY despite the BOJ’s rate hike has not yet shifted overall market sentiment. Although the BOJ raised rates to 0.75%, the yen remains soft, indicating that much of the move was already priced in, and

YEN CARRY TRADE LAST WAVE UP 5 of C of B CRASH SOON AFTERThe chart of the yen carry trade The reason for the coming CRASH in world markets for 2026 . Best of trades WAVETIMER !


EUR/AUD at a Crossroads!The EUR/AUD pair is trading in an upward trend on the four-hour timeframe following the pullback that took place between November 25 and December 10.
The pair is now at a crossroads between continuing the upward trend from the current support levels at 1.77340 and 1.77154, targeting 1.77792 as the
EUR/USD | What to expect (READ THE CAPTION!)As you can see in the Hourly chart of EURUSD, after the CPI news, it surged in price, went through the supply zone and sweeped the liquidity above 1.1758 before dropping all the way back to the prior supply zone, now being traded at 1.1711.
I expect the SSL there below the 1.1703 level to be sweepe

Sell-Side Bias Favored at Daily PremiumDAILY
4H
Price is currently trading into daily premium and interacting with buy-side liquidity near the recent highs.
While a 4H CHoCH has formed, the displacement occurred directly into prior supply without clear acceptance. Until the daily closes strong above the highs, upside continuatio

See all forex ideas
| - | - | - | - | - | - | - | ||
| - | - | - | - | - | - | - | ||
| - | - | - | - | - | - | - | ||
| - | - | - | - | - | - | - | ||
| - | - | - | - | - | - | - | ||
| - | - | - | - | - | - | - | ||
| - | - | - | - | - | - | - | ||
| - | - | - | - | - | - | - |
Trade directly on Supercharts through our supported, fully-verified, and user-reviewed brokers.


