Silver just hit a record high but a double‑top signals pullback!After a strong rally to new records spurred by safe-haven demand and new entrants, silver is now testing critical support levels near $47‑$48 amid the recent Gaza ceasefire news, forming a classic double‑top pattern that may turn into a long-term Cup & Handle that could place price action in a handl

The best trades require research, then commitment.
Get started for free$0 forever, no credit card needed

Scott "Kidd" PoteetThe unlikely astronaut

Where the world does markets
Join 100 million traders and investors taking the future into their own hands.
Major indices

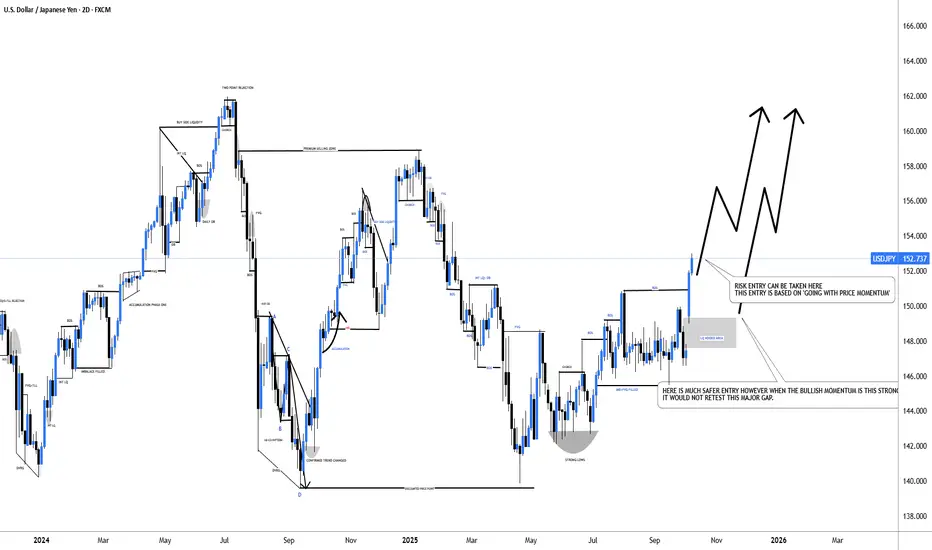
#USDJPY: From +1100 Pips To +1350 Pips A Possible Swing BuyDear Traders,
I hope you’re all having a great trading week!
The USDJPY is currently trading in a 152 price range and is experiencing extreme bullish momentum. The price is rallying without making any corrections, primarily due to the collapse of the Yen. We may see it fall further below. Given th
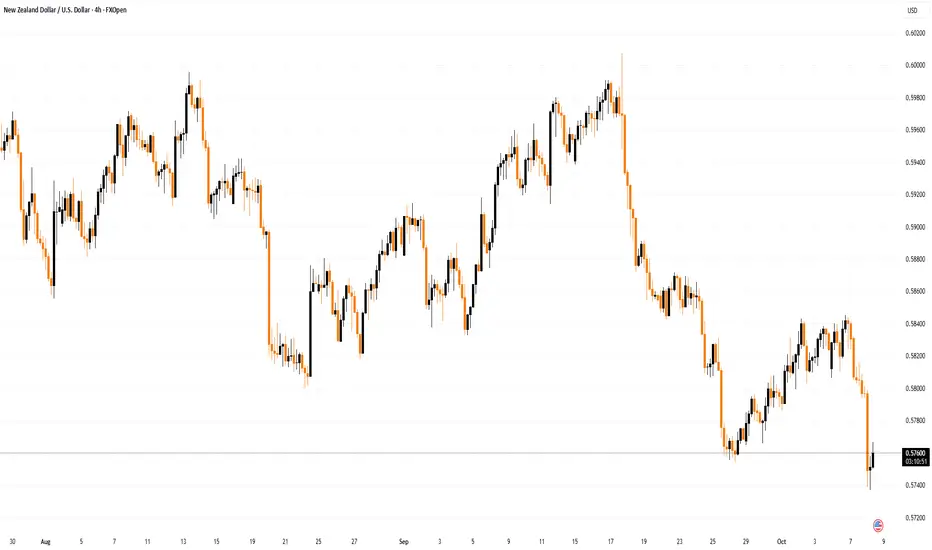
NZD/USD Rate Drops Sharply After Central Bank DecisionNZD/USD Rate Drops Sharply After Central Bank Decision
This morning, the Reserve Bank of New Zealand (RBNZ) cut its key interest rate. According to Forex Factory, the Official Cash Rate was reduced by 50 basis points from 3.0% to 2.5%, while most analysts had expected a smaller cut to 2.75%.
More
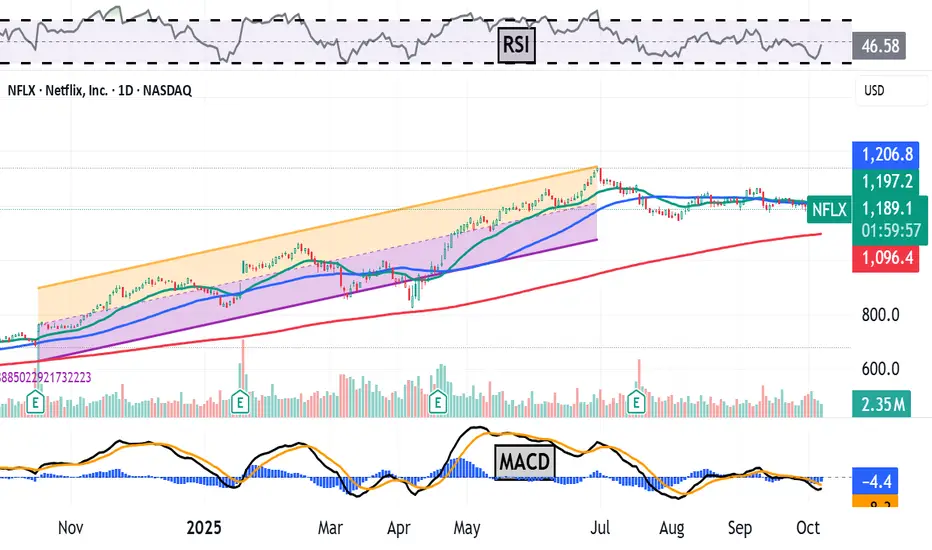
Netflix Is -11% Since June's All-Time High. What Its Chart SaysNetflix NASDAQ:NFLX has fallen more than 10% since hitting an all-time high in June, but the streaming giant is still beating the S&P 500 SP:SPX in the year-to-date, one-year and five-year periods. What does technical and fundamental analysis say is going on?
Let's take a look:
Netflix's Fund
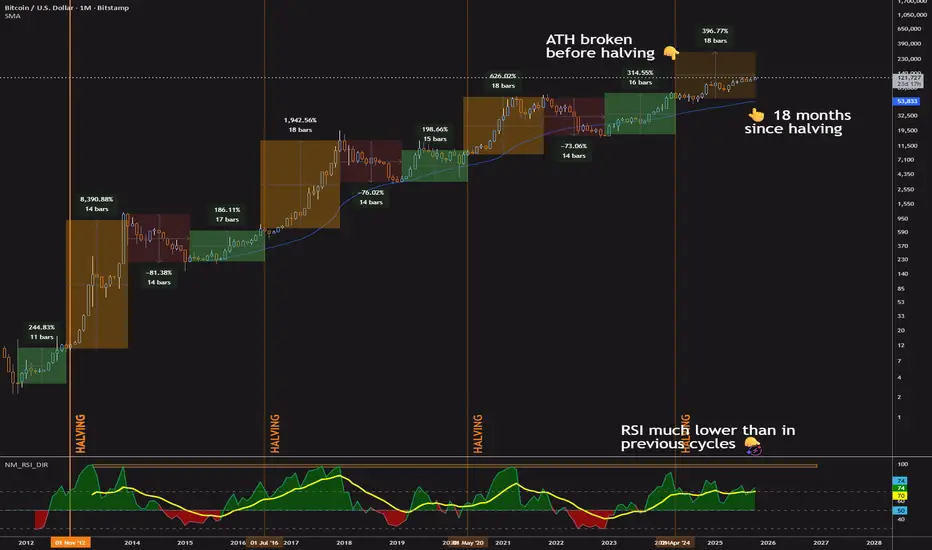
Is Bitcoin's 4-Year Cycle Over? Bitcoin’s 4-year cycle has been a go-to for traders, driven by halving events that spark price surges, sharp corrections, and recovery periods. But something’s off this time.
We’re 18 months into the post-2024 halving rally—hitting the historical peak for bull runs—yet there’s no sign of a crash,
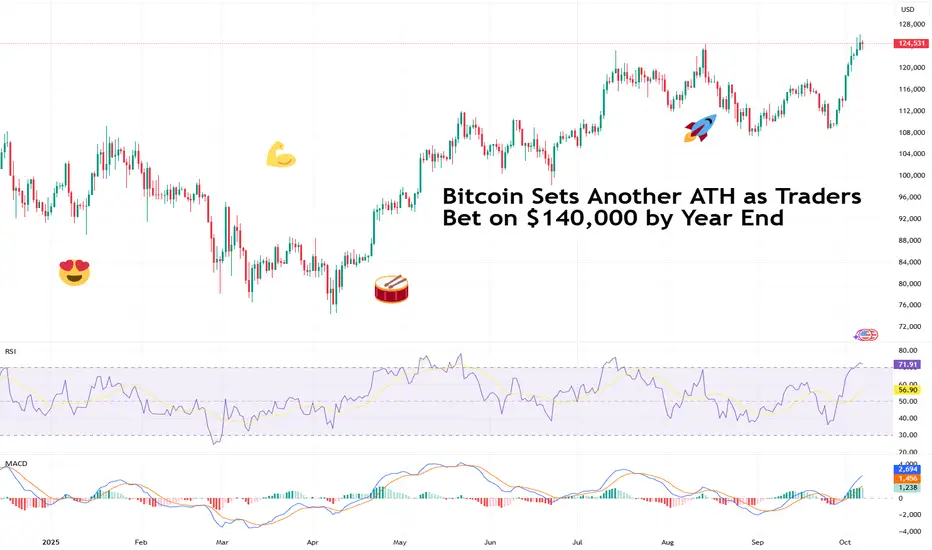
Bitcoin Sets Another ATH as Traders Bet on $140,000 by Year EndBlink and you’ll miss it. Bitcoin’s recent leg up caught lots of traders unprepared. After sinking below $110,000 few weeks back, the OG coin slingshotted to a fresh record high above $126,000 this week. Not a bad way to start October Uptober .
Now, traders are adding to bets that the price will
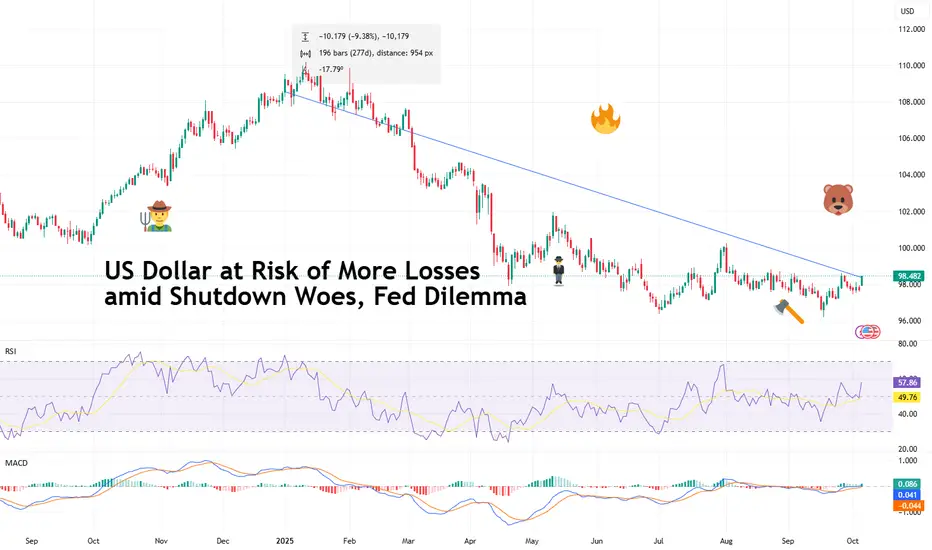
US Dollar at Risk of More Losses amid Shutdown Woes, Fed DilemmaThe US dollar TVC:DXY has been knocked by last week’s US government shutdown and the subsequent economic blackout. At the same time, the Federal Reserve can’t figure out what’s worse – inflation or job crunch.
After Congress failed to pass a funding bill, the government officially went dark at
Retro Editors' picks 2024Closing our retro EP selection , we present to you the last collection of additional scripts that have earned a spot in our Editors' picks, in this case from 2024.
These retrospective selections reflect our continued commitment to honoring outstanding contributions in our community, regardless of

SILVER (XAG/USD): One More Bullish Wave is Coming?!⚠️ SILVER appears to be confined within a horizontal range, as observed on the 4-hour chart. The price is currently nearing the upper limit of this range.
Given the prevailing strong bullish trend, there is a considerable likelihood of a continued upward movement.
A breakout and a 4-hour candle cl

Gold Continues to Challenge Record Resistance Levels👋Hello everyone, what are your thoughts on OANDA:XAUUSD ?
As of this writing, gold continues its upward momentum, having reached new highs as investors increase their bets on the Federal Reserve cutting interest rates in the near future. The concerns over the U.S. government shutdown and global e
See all editors' picks ideas
Dynamic Equity Allocation Model"Cash is Trash"? Not Always. Here's Why Science Beats Guesswork.
Every retail trader knows the frustration: you draw support and resistance lines, you spot patterns, you follow market gurus on social media—and still, when the next bear market hits, your portfolio bleeds red. Meanwhile, institution

First Passage Time - Distribution AnalysisThe First Passage Time (FPT) Distribution Analysis indicator is a sophisticated probabilistic tool that answers one of the most critical questions in trading: "How long will it take for price to reach my target, and what are the odds of getting there first?"
Unlike traditional technical indicators

PongExperience PONG! The classic arcade game, now on your charts!
With this indicator, you can finally achieve your lifelong dream of beating the Markets. . . at PONG!
Pong is jam-packed with features! Such as:
2 Paddles
A moving dot
Floating numbers
The idea of a net
This indicator is solel

Options Max Pain Calculator [BackQuant]Options Max Pain Calculator
A visualization tool that models option expiry dynamics by calculating "max pain" levels, displaying synthetic open interest curves, gamma exposure profiles, and pin-risk zones to help identify where market makers have the least payout exposure.
What is Max Pain?
Max

Volume Profile 3D (Zeiierman)█ Overview
Volume Profile 3D (Zeiierman) is a next-generation volume profile that renders market participation as a 3D-style profile directly on your chart. Instead of flat histograms, you get a depth-aware profile with parallax, gradient transparency, and bull/bear separation, so you can see w

RiskMetrics█ OVERVIEW
This library is a tool for Pine programmers that provides functions for calculating risk-adjusted performance metrics on periodic price returns. The calculations used by this library's functions closely mirror those the Broker Emulator uses to calculate strategy performance metrics (

Simple Decesion Matrix Classification Algorithm [SS]Hello everyone,
It has been a while since I posted an indicator, so thought I would share this project I did for fun.
This indicator is an attempt to develop a pseudo Random Forest classification decision matrix model for Pinescript.
This is not a full, robust Random Forest model by any stretch o

Tick CVD [Kioseff Trading]Hello!
This script "Tick CVD" employs live tick data to calculate CVD and volume delta! No tick chart required.
Features
Live price ticks are recorded
CVD calculated using live ticks
Delta calculated using live ticks
Tick-based HMA, WMA, EMA, or SMA for CVD and price
Key tick levels (S

analytics_tablesLibrary "analytics_tables"
📝 Description
This library provides the implementation of several performance-related statistics and metrics, presented in the form of tables.
The metrics shown in the afforementioned tables where developed during the past years of my in-depth analalysis of various str

Adaptive Trend Classification: Moving Averages [InvestorUnknown]Adaptive Trend Classification: Moving Averages
Overview
The Adaptive Trend Classification (ATC) Moving Averages indicator is a robust and adaptable investing tool designed to provide dynamic signals based on various types of moving averages and their lengths. This indicator incorporates multipl

See all indicators and strategies
Community trends
I'm bored so I'll throw this one out there - ANIX short at 4.92I mentioned the other day that I've been tinkering with a shorting method. It doesn't work with most stocks (or at least most stocks don't throw signals with it), so these are often some pretty obscure stocks. That said, it has been extremely profitable in the small sample size of testing I've bee

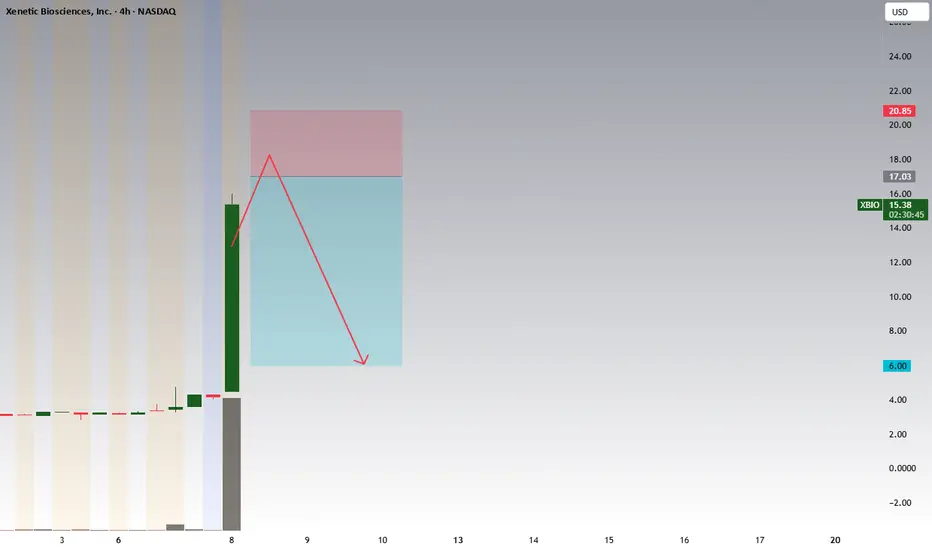
XBIO – Over-Rotated Microfloat Forming the First Red Daily CloseTicker: XBIO
Float: ~1.25 M shares
Volume: ≈ 5.5 M shares → 4.4× float rotation
Dollar Volume: ≈ 59 M USD
Move: +266 % today
Type: Parabolic microfloat blow-off
🧩 Thesis
XBIO completed a full-float rotation and printed a parabolic move — the kind of setup that often signals retail exhaustion.
Now
AMAT LongThe broader market structure on AMAT (15-minute) shows a clear bearish trend following the major Break of Structure (BOS) at 226.46, where price violated a previous higher low and shifted momentum downward. This BOS confirmed the end of the prior bullish leg and established a lower-high–lower-low se

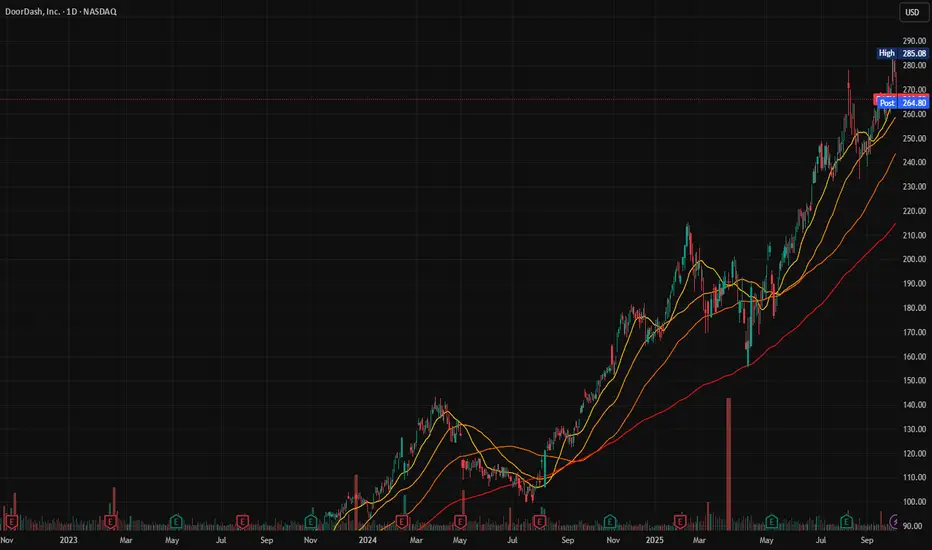
$DASH Call Alert – Oct 31 ’25 $270 Calls | 48% ROI PotentialEnter: NASDAQ:DASH OCT 31 2025 $270 CALLS
Buy in Price: $13.25 - $14.35
Take Profit: $21.24
Stop Bleeding: $12.63
ROI Potential: 48%
Exit Within: 237 Minutes
DKNG Update | Crash AheadOne of the best fractal overlays I've seen with some Elliott Waves to go with it.
Price is still in a uptrend but with growing sellers It'll come to an end similar to the last fractal.
During the 3rd wave in the last pattern price experienced its first pullback at (B), and its second at correction

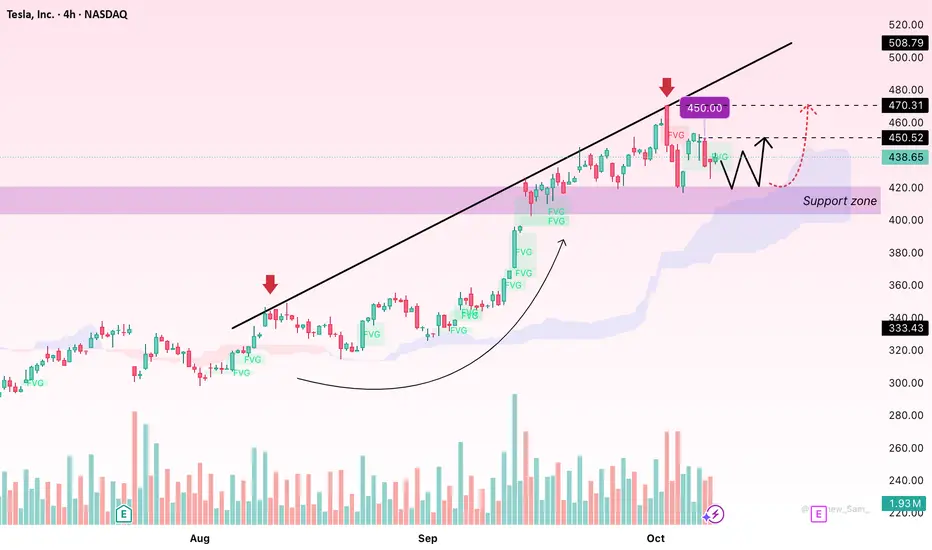
TSLA – Mild Pullback Before Resuming Its Upward TrajectoryHello everyone,
Tesla (TSLA) is showing a healthy technical pullback after an impressive rally, yet the broader bullish trend remains intact. The stock is currently hovering around $438.69, down 4.5% in the latest session — a move that reflects short-term profit-taking rather than a shift in marke
Falling Wedge on NFLX: Set for a Break?Price on NASDAQ:NFLX has been consolidating inside a falling wedge, with each swing showing weaker momentum from sellers. And buyers are slowly stepping back in.
A strong breakout above the upper trendline would confirm bullish strength and signal a potential continuation toward the 1,400.00 leve

BBAI LONGLooking at the volume patterns, a little extended, $16.23 Target on LOG, Breaking out of recent highs with volume.
NVIDIA bearish crabBig red candle on the bearish crab reversal zone signals further downside move. did you buy the dip?

Back test before continuationNYSE:PFE after breaking out on trump deal and now working with him to sell their products through TrumpRx launching next year. They are also exempt from tariffs for 3 years and plan to invest 60B in the US. good support/resistance flip could take place here would like to hold 25 but 24 is possible.
See all stocks ideas
Oct 13
FASTFastenal Company
Actual
—
Estimate
0.30
USD
Oct 13
CMTLComtech Telecommunications Corp.
Actual
—
Estimate
−0.75
USD
Oct 13
GMGIGolden Matrix Group, Inc.
Actual
—
Estimate
−0.00
USD
Oct 13
LFCRLifecore Biomedical, Inc.
Actual
—
Estimate
−0.31
USD
Oct 13
WAFDWaFd, Inc.
Actual
—
Estimate
0.77
USD
Oct 13
VFSVinFast Auto Ltd.
Actual
—
Estimate
−0.26
USD
Oct 13
CCELCryo-Cell International, Inc.
Actual
—
Estimate
−0.03
USD
Oct 13
UNTYUnity Bancorp, Inc.
Actual
—
Estimate
1.29
USD
See more events
Community trends
BITCOIN AND CRYPTO RUG PULL, HERE IS THE REAL REASON WHY!In the 1-hour time period, all altcoins and Bitcoin crashed on Friday afternoon/night! The real reason behind this crash is in this article. The vast majority of traders on the futures market got liquidated with a very low leverage of 2x or more.
If you still believe in Democrats and their controll
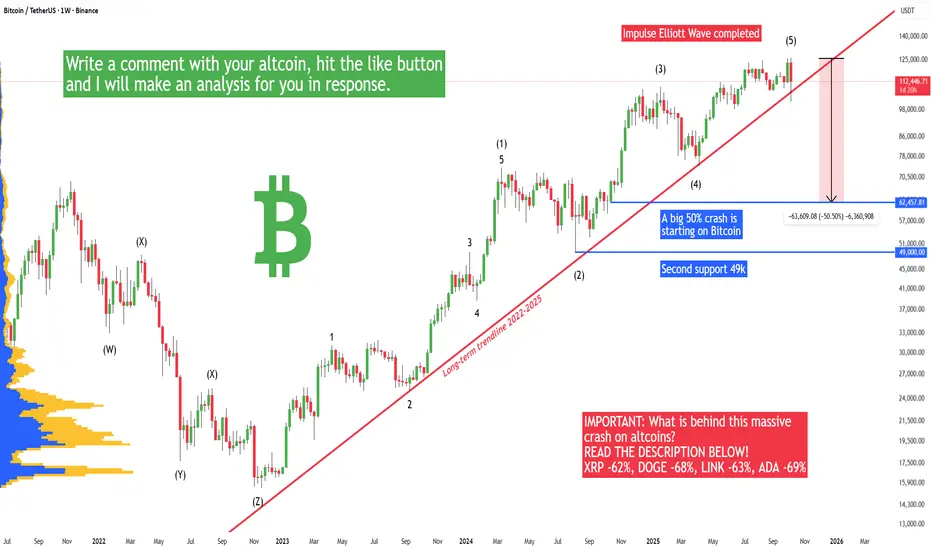
BTC is in 'The Final Trap' Before the Crash (Wyckoff Phase C)
In my last post, I announced the end of the bull cycle and shared my game plan for the next two years. I explained WHAT I am doing and WHY from a macroeconomic perspective.
In this post, I will show you HOW I came to these conclusions using technical analysis. This isn't a gut feeling. It is a stru

Bitcoin Facing Channel Resistance: Another Drop Ahead?Hello guys!
BTC is currently moving within a descending channel, showing consistent lower highs and lower lows, confirming a short-term bearish structure. The price continues to respect this channel, and until a clear breakout occurs, the downward bias remains intact.
Key Observations:
Two beari
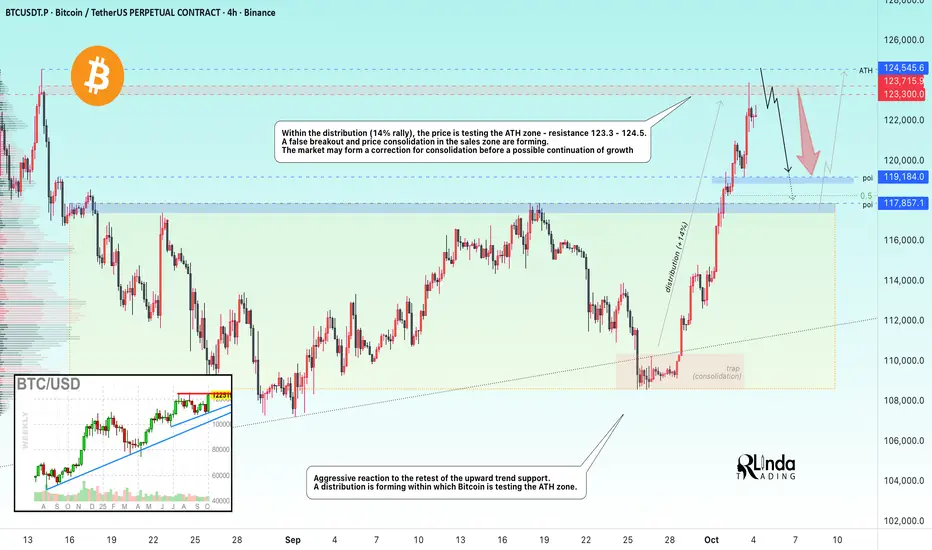
BITCOIN → False breakout of the all-time high zoneBINANCE:BTCUSDT is rising amid the US government shutdown and testing the all-time high zone and resistance at 123.3K - 123.7K. A false breakout has formed and the market is moving into local consolidation.
The price is reacting aggressively to the retest of the uptrend support. A rally is for
BTC Bulls Eye $148K–$160K Targets as IHS Pattern Takes ShapeBitcoin faced rejection from a strong supply zone currently acting as the neckline of a potential Inverse Head & Shoulders (IHS) structure. The right shoulder appears to be forming within the $113K–$116K range, and this zone will be crucial in determining the next major directional move.
If the $11

Is Alt season dead? - June 2025Let me start by saying, Youtube influencers are lying to you. The collective narrative (from those links shared with me) talk almost exclusively about the same set of narratives for triggering “alt season”:
M2 money supply. The printer will be turned on any minute.
The FED is going to cut rat

BTC BREAKING NEWS OR BREAKING CHARTS?📰 BREAKING NEWS OR BREAKING CHARTS?
TRUMP IMPOSES TARIFFS, CAUSING A BITCOIN BLOODBATH — $20,000 DRAWDOWN IN 2 HOURS!
Bitcoin was sitting comfortably at $121,000, before a sudden macro shock — triggered by newly imposed U.S. tariffs — sent prices spiraling down to $100,000 in a matter of hou

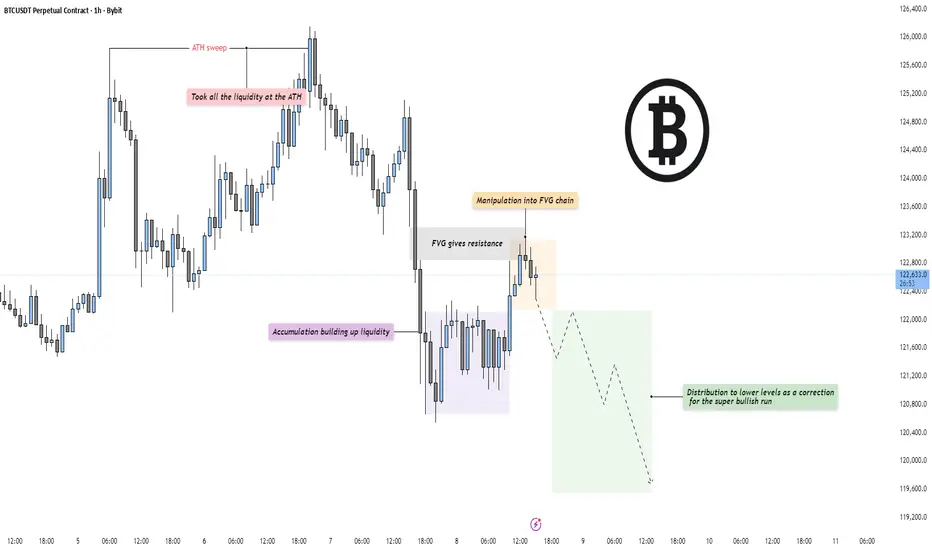
BTC - Distribution after ATH sweepMarket Context
Bitcoin has completed a clear liquidity sweep at the all-time high (ATH) and is now transitioning into a corrective phase. After taking all the liquidity above the prior high, price aggressively rejected and shifted structure to the downside, signaling that smart money may now be eng
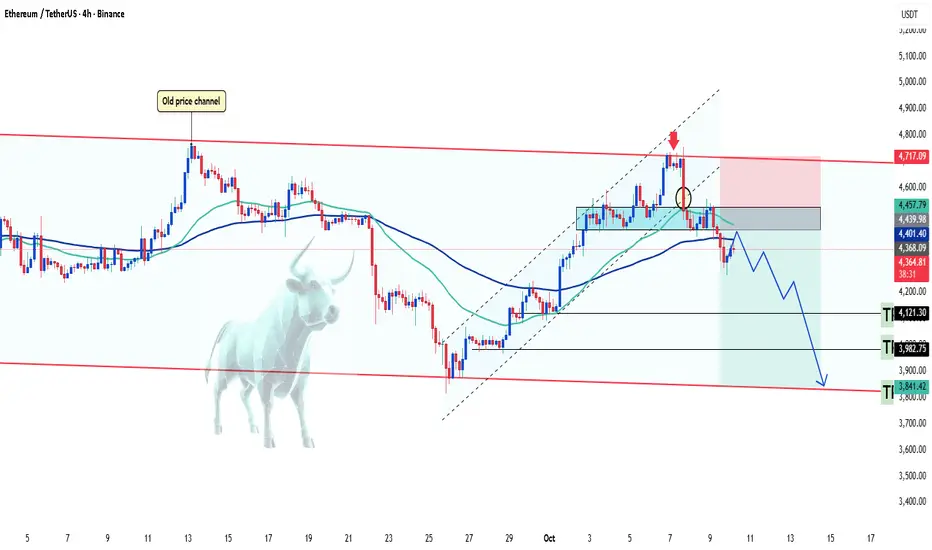
ETHUSDT - Reversal at Key Resistance Level👋Hello everyone, what do you think about the trend of BINANCE:ETHUSDT ?
Previously, I expected ETHUSDT to form a flag pattern and break out of the price channel. However, the buying momentum was not strong enough, and ETHUSDT pulled back when it encountered the upper boundary of the channel.
Lo
BITCOIN Are you worried about this?Bitcoin (BTCUSD) is pulling back aggressively today following Trump's China-tariffs related news and this weekly rejection is far from ideal technically as well.
In recent years it's been unusual to look at the market on anything but a logarithmic scale, which is natural as it offers a fair represe

See all crypto ideas
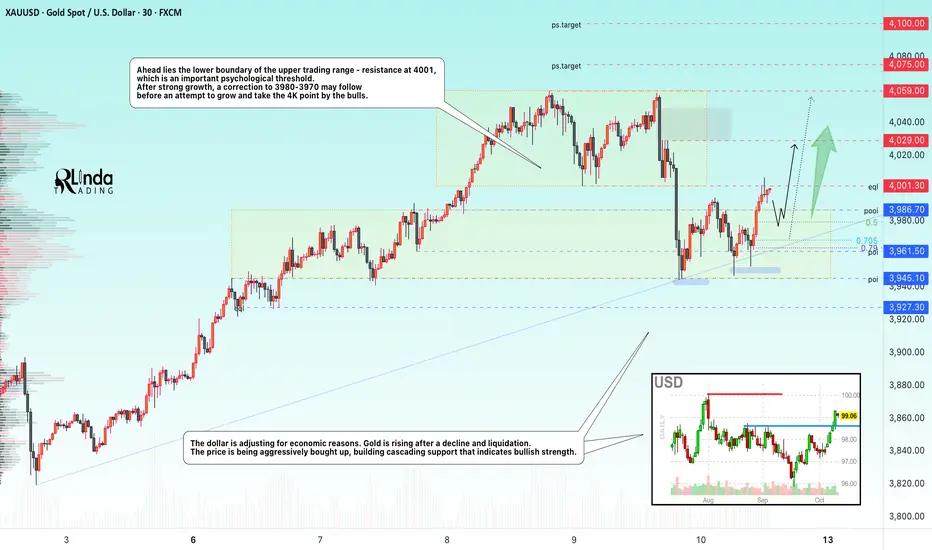
GOLD → Retest 4000. Pullback before a breakout and rise to 4100?FX:XAUUSD , after a sharp sell-off and testing of the 3950 support zone, is aiming to return to the $4000 level on Friday, preparing for its eighth consecutive week in positive territory.
The Senate adjourned for the weekend until Tuesday, postponing a decision on the shutdown. John Williams s
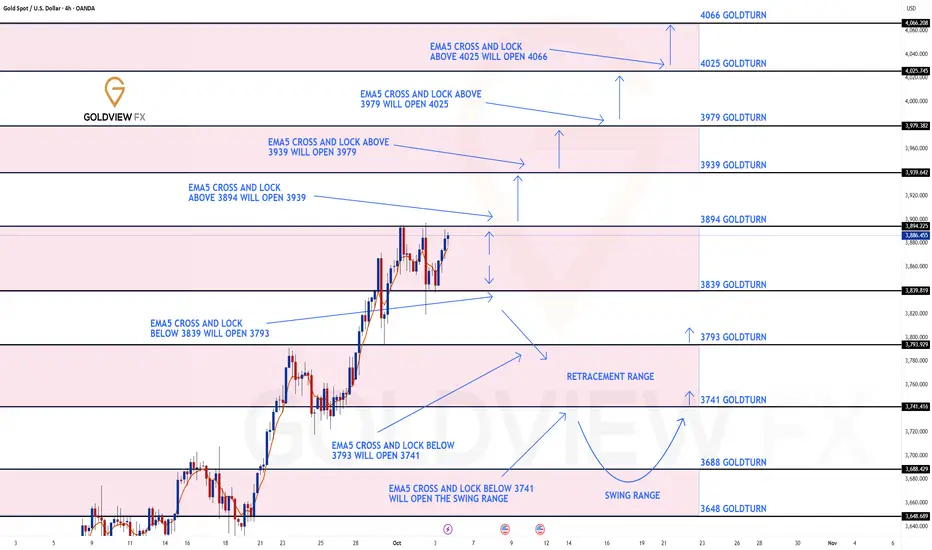
GOLD 4H CHART ROUTE MAP UPDATE & TRADING PLAN FOR THE WEEKHey Everyone,
Please see our updated 4h chart levels and targets for the coming week.
We are seeing price play between two weighted levels with a gap above at 3894 and a gap below at 3839. We will need to see ema5 cross and lock on either weighted level to determine the next range.
We will see le
Lingrid | GOLD Bullish Trend Extension OpportunityOANDA:XAUUSD remains in a strong bullish structure, holding above the confluence zone near 3,940 and respecting the upward trendline. Price action forms higher highs inside the ascending channel, suggesting continuation toward the 4,055–4,100 resistance zone in the mid-term. As long as 3,940 holds

XAU/USD – Pause in the Rally as Profit-Taking Takes HoldHello everyone,
After days of unstoppable gains and repeated record highs, gold (XAU/USD) is witnessing a notable correction. In today’s session, the metal fell sharply from $4,060 to $3,980 — a drop of $82 in a short span, reflecting strong profit-taking pressure as investors lock in gains near a

Gold Breakout Setup After Completing CorrectionGold ( OANDA:XAUUSD ) fell to $3,963 , as I expected in my previous idea .
Gold is currently moving near the lower line of the ascending and the Resistance zone($4,012 – $3,991) . If Gold touches $4,003 , we can expect a break of the Resistance zone($4,012 – $3,991) .
In terms of Elliott W
GOLD (XAU/USD): Bullish Wave ContinuesI believe that the price of 📈GOLD is likely to continue rising.
I have spotted another bullish pattern today.
We have a confirmed breakout above the neckline of a double bottom.
It appears that the market will likely experience a bullish trend and reach the 4040 level in the near future.

Gold Holds Key Support at 3945 – Bulls Still in Control for NowGold Holds Key Support at 3945 – Bulls Still in Control for Now
You already know my opinion — under normal conditions, gold shouldn’t be trading in this zone.
Even though Israel approved the first phase of the Gaza deal, gold only made a small correction, not a strong bearish move.
The drop from
Gold Complete Deep Pull back and is likely to retest 4025Gold Complete Deep Pull back and is likely
to retest 4025
After a quick drop to the demand zone 3950
Gole formed a Pin bar and now is forming
an Inside bar
Trading Plan:
Long gold now, Sl below the Pin
Aim 4025
Apply 2% risk rule, and close half position
when Reward Risk Ratio hit 2:!
All the

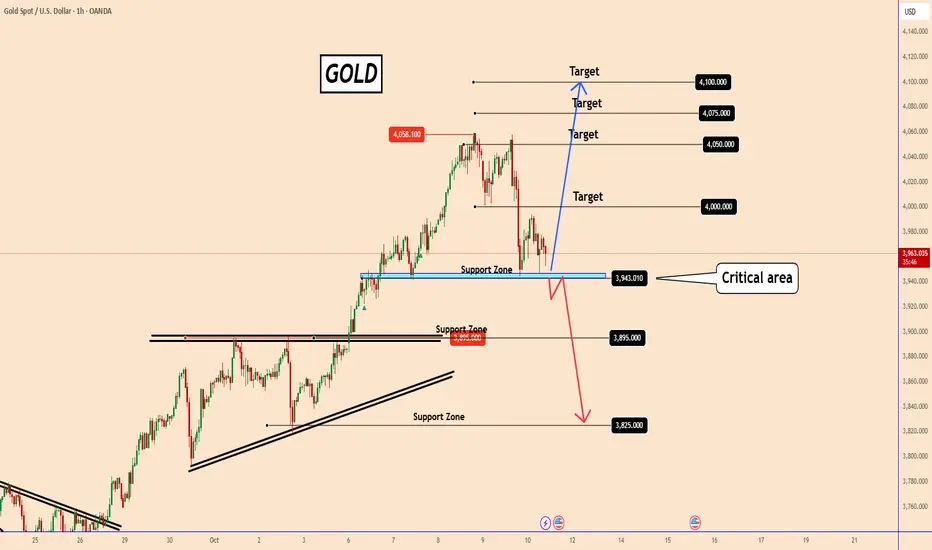
XAU/USD | Gold Recovers After Sharp Selloff (READ THE CAPTION)By analyzing the Gold (XAUUSD) chart on the 30-minute timeframe, we can see that yesterday, following the announcement of peace between Hamas and Israel, gold experienced a sharp drop — falling from $4029 to $3943, which means a decline of over 850 pips (and about 1140 pips from the $4058 level!).

Gold Rise on likely technical recovery Market TalkGold consolidated higher in early Asian trading on a likely technical recovery following the sharp decline overnight. Despite recent volatility, the broader bullish momentum in the precious metal appears to remain intact.
From a technical perspective, minutes from the FOMC’s September meeting indic

See all futures ideas
AUDUSD Eyes 0.64500 Support as Bullish Structure Holds FirmHey Traders,
In today’s session, we’re closely monitoring AUDUSD for a potential buying opportunity around the 0.64500 zone. The pair continues to trade within a broader uptrend, and the current pullback appears to be a healthy correction toward a key support and resistance confluence near 0.64500.

EURCAD +3% Trade Recap 10.10.25 In this recap I break down my EURCAD short position I took yesterday morning. I fully forecast this setup in the morning as per my forecast video, and then executed later that day. Manually closing for just under 3% profit at the intended target.
Full explanation as to why I executed on this posit

NZDUSDeven HTF is bearish, price is reading to the bullish zone that havent been tested. if price reaches 0.57000, I go long with full lot size. this level could create a nice reversal trade, targeting the previous swing low of the downtrend.

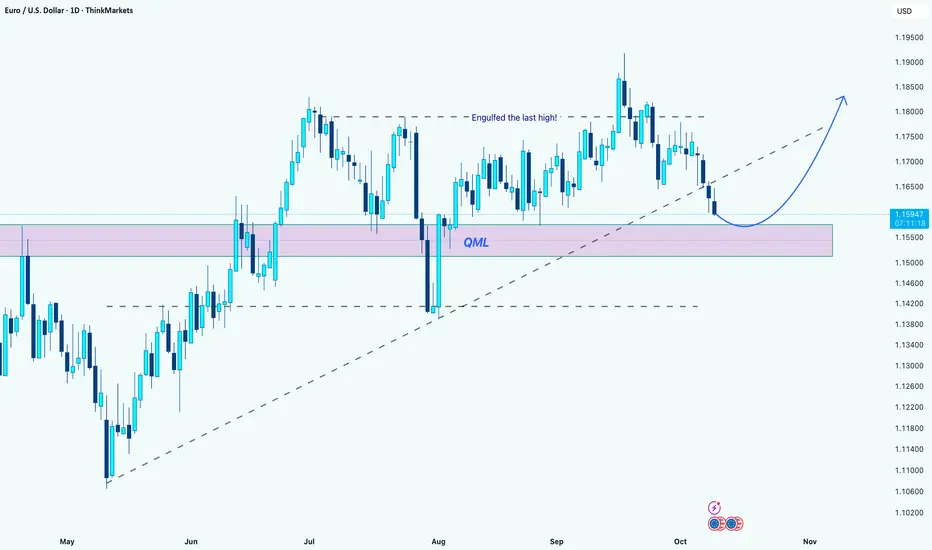
EUR/USD: Retesting QML Zone for a Potential Bullish ReversalHi Guys!
After breaking out from the previous range, EUR/USD has been respecting the ascending trendline quite well. Recently, the price pulled back toward the QML zone (marked in purple), which has acted as a strong demand area in the past.
We can see that price engulfed the last high before star
GBP/USD Trade Alert🚨 GBP/USD Trade Alert 🚨
━━━━━━━━━━━━━━━━━━━
Type: 🟢 Buy Stop
Entry: 1.33146
Take Profit (TP): 🎯 1.34559
Stop Loss (SL): ❌ 1.32498
━━━━━━━━━━━━━━━━━━━
📅 Signal Time: 10 Oct 2025
📈 Status: Pending Activation
💡 Analysis: Buyers have come into play strongly at this level, showing increased demand and mo

NZD/JPY: Bearish Reversal ConfirmedIt appears quite probable that the 📉NZDJPY pair may experience a further decline.
This analysis is based on the confirmation of a change of character on a 4-hour timeframe, along with the presence of a bearish imbalance candle.
The subsequent support level is anticipated to be at 87.60.

EURUSD I Weekly Range I Manipulation - Time for pullbackGM Friends,price was ranging diagonaly up for the whole August. During the FOMC it has made final manipulation where most of traders most likely entered longs. With expectations of weak USD. While the CUT 0.25 BPS was already priced in so price reversed. This is a clean pattern of accumulation, m
EURUSD Short: Trend Continuation to 1.1525 pointsHello, traders! The prior market structure for EURUSD has shifted to a bearish bias. This occurred after a failed breakout above the 1.1800 resistance level, which concluded a prior ascending channel. The subsequent reversal established the current descending channel, which has been guiding the pric
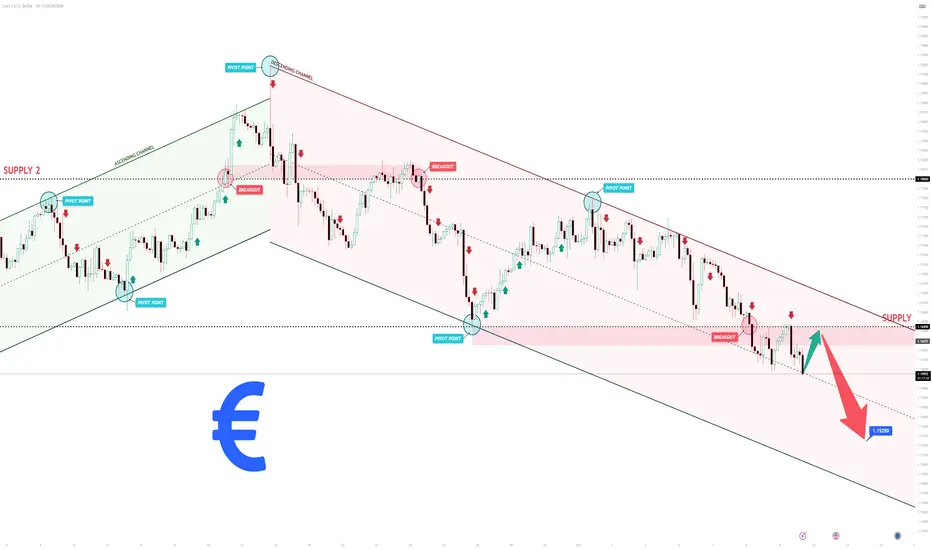
Euro may Break the 1.1550 Support LevelHello traders, I want share with you my opinion about Euro. The dominant market pressure for the Euro has been bearish since the price failed to sustain its rally to the 1.1920 high. This reversal initiated a significant downward trend for EURUSD, characterised by the breakdown of several key market

#USDCAD: Price to continue remain bullish! Let's wait and watchDear traders,
I hope you all are doing well.
The USDCAD pair has been extremely bullish since the CAD currency began to decline. We now have an excellent opportunity to rise, with the potential for the price to reverse in good time. This analysis is based solely on the current market conditions an

See all forex ideas
| - | - | - | - | - | - | - | ||
| - | - | - | - | - | - | - | ||
| - | - | - | - | - | - | - | ||
| - | - | - | - | - | - | - | ||
| - | - | - | - | - | - | - | ||
| - | - | - | - | - | - | - | ||
| - | - | - | - | - | - | - | ||
| - | - | - | - | - | - | - |
Trade directly on the supercharts through our supported, fully-verified and user-reviewed brokers.


