Tesla (TSLA) — Momentum Reload or Major Cooldown?The Next $400–$450 Decision Zone!
🧭 Weekly Chart — Big Picture Momentum
Tesla has printed one of the cleanest BOS (Break of Structure) patterns on the weekly timeframe since the post-2023 recovery, confirming that the macro downtrend has flipped into a sustained bullish expansion. The stock ripped

The best trades require research, then commitment.
Get started for free$0 forever, no credit card needed

Scott "Kidd" PoteetThe unlikely astronaut

Where the world does markets
Join 100 million traders and investors taking the future into their own hands.
Major indices

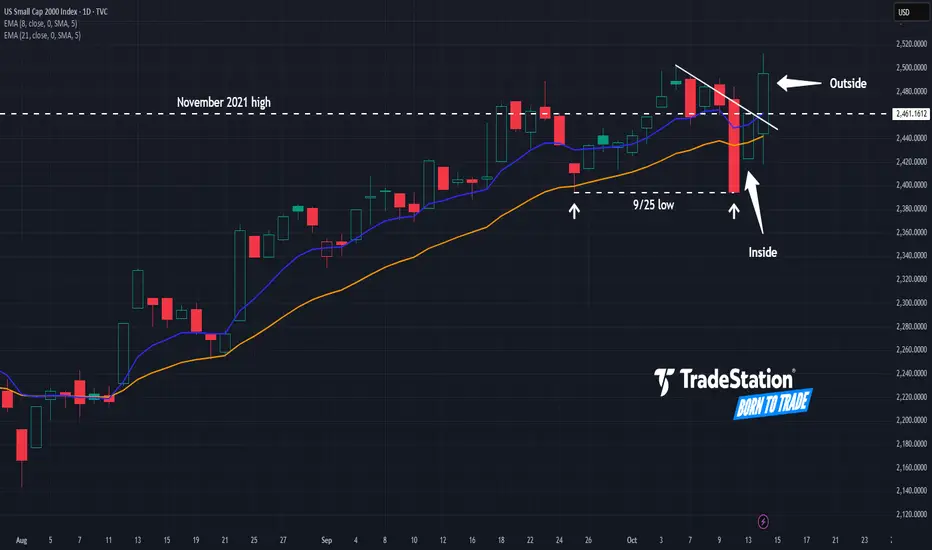
Small Caps: Finally a Breakout?The Russell 2000 has been stuck in a rut for years, but some traders may think the small-cap index has finally achieved escape velocity.
The first pattern on today’s chart is the November 2021 high around 2,460, where prices stalled last November. RUT has gotten above it this month and refused to s
“I Am Become Meme, Destroyer of Short-Sellers”: Gold at $4,200Remember those days where you could short gold and turn a profit? They’re gone. The precious metal is relentlessly pushing higher, breaking every short-seller’s dreams and portfolio.
It’s official — gold has gone full meme. The shiny metal that your grandparents swore by is now trending on Reddit

Gold/Oil Signaling Market Is In A Super Bubble Gold = Fear
Oil = how strong the economy is.
Except for COVID we have never seen such an extreme reading. Yet people are buying up stocks like we will never again be able to produce another stock again as long as we live!
Tulips!
Here are just a few of the factors to consider that make this indic

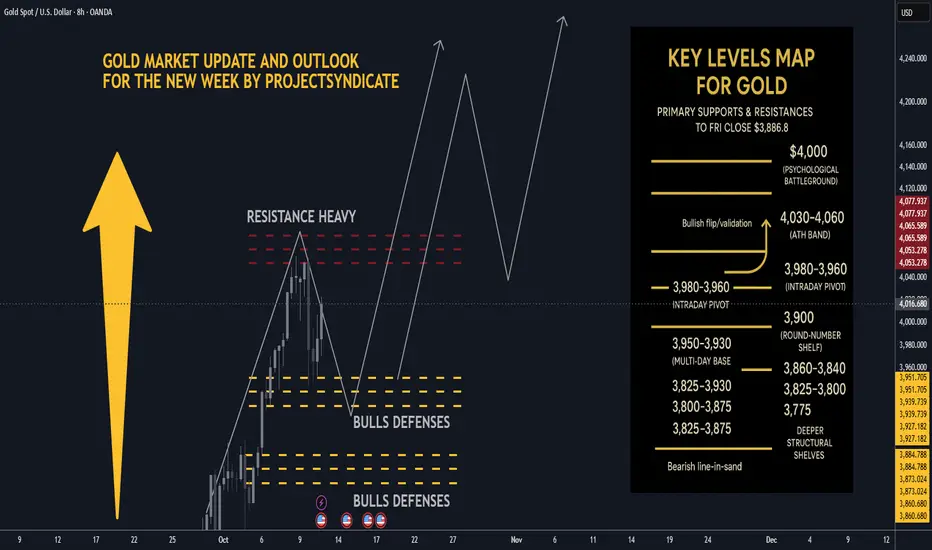
Gold next week: Key S/R Levels and Outlook for Traders🏆 Friday’s Close & Recent ATH:
Gold XAUUSD closed Friday around ~$3,990–$4,020/oz depending on venue most consolidated feeds show prints near $3.99–$4.02k at Friday close. The nearest recent intraday highs printed in the $4,030–$4,060 area across data providers this week, putting $4,000 as the imm
EURUSD: Downtrend will Continue in ChannelHello everyone, here is my breakdown of the current Euro setup.
Market Analysis
The price action has been clearly bearish, with the market being guided lower by a well-defined Downward Channel. This structure has been in place for some time, creating a series of lower highs and lower lows after

AUDUSD Eyes 0.64500 Support as Bullish Structure Holds FirmHey Traders,
In today’s session, we’re closely monitoring AUDUSD for a potential buying opportunity around the 0.64500 zone. The pair continues to trade within a broader uptrend, and the current pullback appears to be a healthy correction toward a key support and resistance confluence near 0.64500.

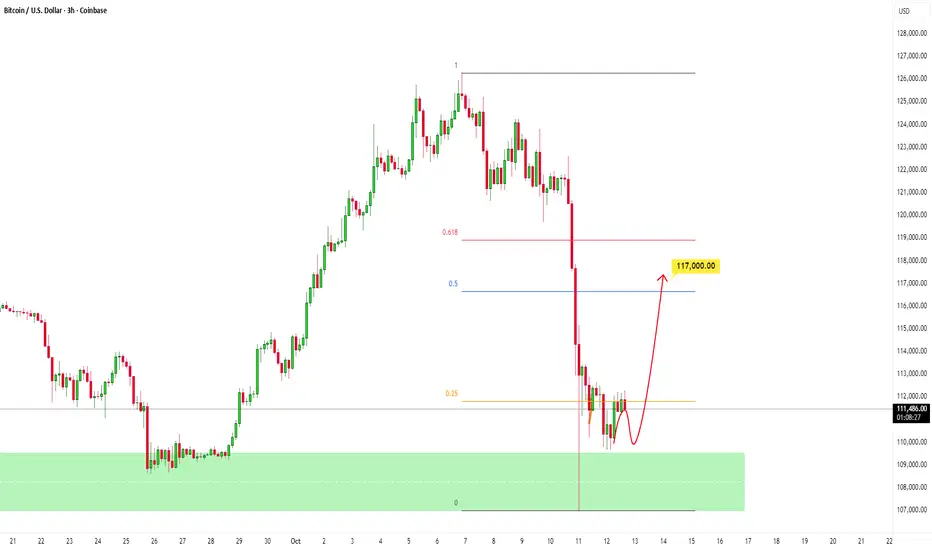
BTC to Retrace to Key Fibonacci level after Heavy SelloffPrice experienced a sharp and aggressive selloff and now, after a strong rejection from key level, the market is consolidating, showing early signs of stabilization as sellers begin to lose momentum.
If buyers can defend this area and push price higher, the next logical target lies around the Fibon
Will EU go up this time?Hi traders,
Last week EU started with a gap down and dropped to take the lower liquidity.
Next week we could see price come into the lower Daily FVG and reverse from there. It still looks like that the downmove is corrective and this pair goes up one more time to finish a big ending diagonal into

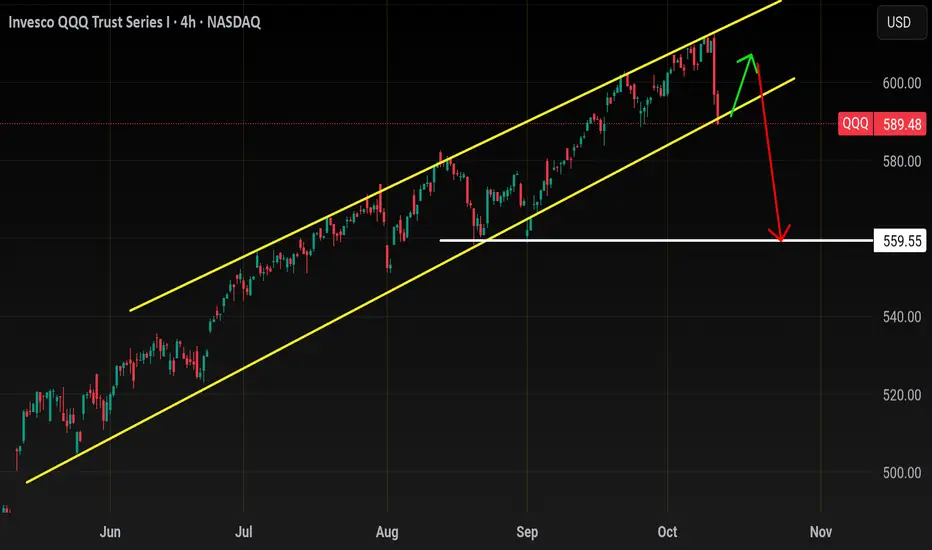
QqqBeen awhile since I went over Tech..
Let's start off with a bigger picture
Zooming out you can see that we've tagged our long term resistance since sept
Zooming in but staying on the weekly
You'll notice the reversal weekly bearish engulfing and also the volume..
The candle alone is is n
See all editors' picks ideas
Dynamic Equity Allocation Model"Cash is Trash"? Not Always. Here's Why Science Beats Guesswork.
Every retail trader knows the frustration: you draw support and resistance lines, you spot patterns, you follow market gurus on social media—and still, when the next bear market hits, your portfolio bleeds red. Meanwhile, institution

First Passage Time - Distribution AnalysisThe First Passage Time (FPT) Distribution Analysis indicator is a sophisticated probabilistic tool that answers one of the most critical questions in trading: "How long will it take for price to reach my target, and what are the odds of getting there first?"
Unlike traditional technical indicators

PongExperience PONG! The classic arcade game, now on your charts!
With this indicator, you can finally achieve your lifelong dream of beating the Markets. . . at PONG!
Pong is jam-packed with features! Such as:
2 Paddles
A moving dot
Floating numbers
The idea of a net
This indicator is solel

Options Max Pain Calculator [BackQuant]Options Max Pain Calculator
A visualization tool that models option expiry dynamics by calculating "max pain" levels, displaying synthetic open interest curves, gamma exposure profiles, and pin-risk zones to help identify where market makers have the least payout exposure.
What is Max Pain?
Max

Volume Profile 3D (Zeiierman)█ Overview
Volume Profile 3D (Zeiierman) is a next-generation volume profile that renders market participation as a 3D-style profile directly on your chart. Instead of flat histograms, you get a depth-aware profile with parallax, gradient transparency, and bull/bear separation, so you can see w

RiskMetrics█ OVERVIEW
This library is a tool for Pine programmers that provides functions for calculating risk-adjusted performance metrics on periodic price returns. The calculations used by this library's functions closely mirror those the Broker Emulator uses to calculate strategy performance metrics (

Simple Decesion Matrix Classification Algorithm [SS]Hello everyone,
It has been a while since I posted an indicator, so thought I would share this project I did for fun.
This indicator is an attempt to develop a pseudo Random Forest classification decision matrix model for Pinescript.
This is not a full, robust Random Forest model by any stretch o

Tick CVD [Kioseff Trading]Hello!
This script "Tick CVD" employs live tick data to calculate CVD and volume delta! No tick chart required.
Features
Live price ticks are recorded
CVD calculated using live ticks
Delta calculated using live ticks
Tick-based HMA, WMA, EMA, or SMA for CVD and price
Key tick levels (S

analytics_tablesLibrary "analytics_tables"
📝 Description
This library provides the implementation of several performance-related statistics and metrics, presented in the form of tables.
The metrics shown in the afforementioned tables where developed during the past years of my in-depth analalysis of various str

Adaptive Trend Classification: Moving Averages [InvestorUnknown]Adaptive Trend Classification: Moving Averages
Overview
The Adaptive Trend Classification (ATC) Moving Averages indicator is a robust and adaptable investing tool designed to provide dynamic signals based on various types of moving averages and their lengths. This indicator incorporates multipl

See all indicators and strategies
Community trends
Tesla (TSLA) — Momentum Reload or Major Cooldown?The Next $400–$450 Decision Zone!
🧭 Weekly Chart — Big Picture Momentum
Tesla has printed one of the cleanest BOS (Break of Structure) patterns on the weekly timeframe since the post-2023 recovery, confirming that the macro downtrend has flipped into a sustained bullish expansion. The stock ripped
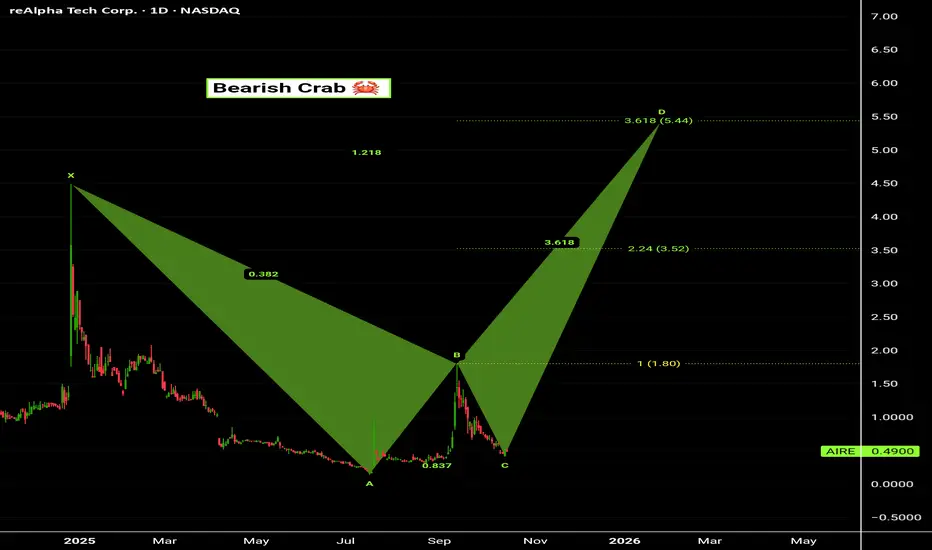
ReAlpha Tech Corp [ AIRE ]Updated Harmonic shap formation pattern .
Target prices between 3.52$ - 5.44$ ... it could go and Move up further depending on the Stock Maker.
The widely anticipated two global interest rate cuts this year will drive mortgage lending to record levels, contributing to a significant increase in st
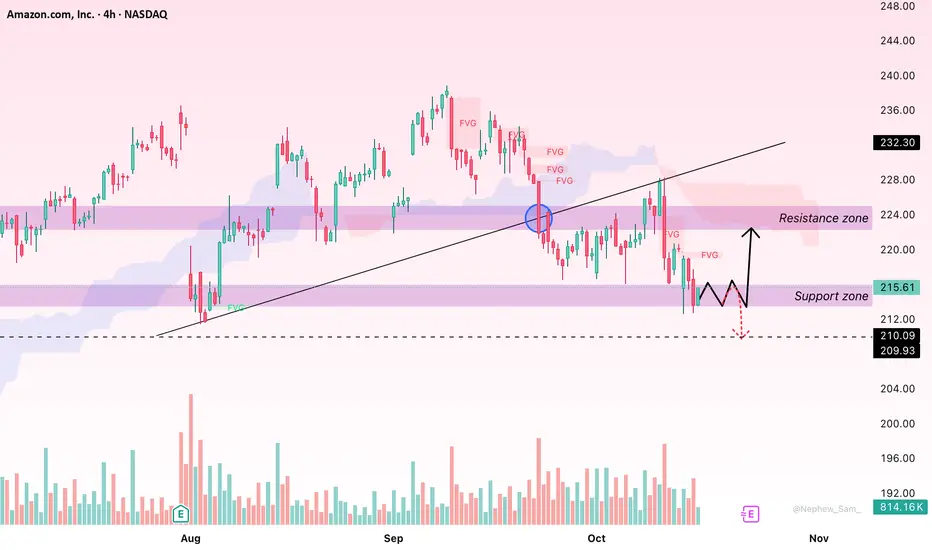
Amazon (AMZN): Pullback Pause or Start of a Deeper Correction?Hello everyone,
Amazon’s stock has drawn attention after sliding from the 220 USD peak to below 216 USD. Looking at the broader picture, this move reflects not only a technical correction but also investors’ growing caution amid mixed U.S. economic signals and uncertainty around the tech sector’s
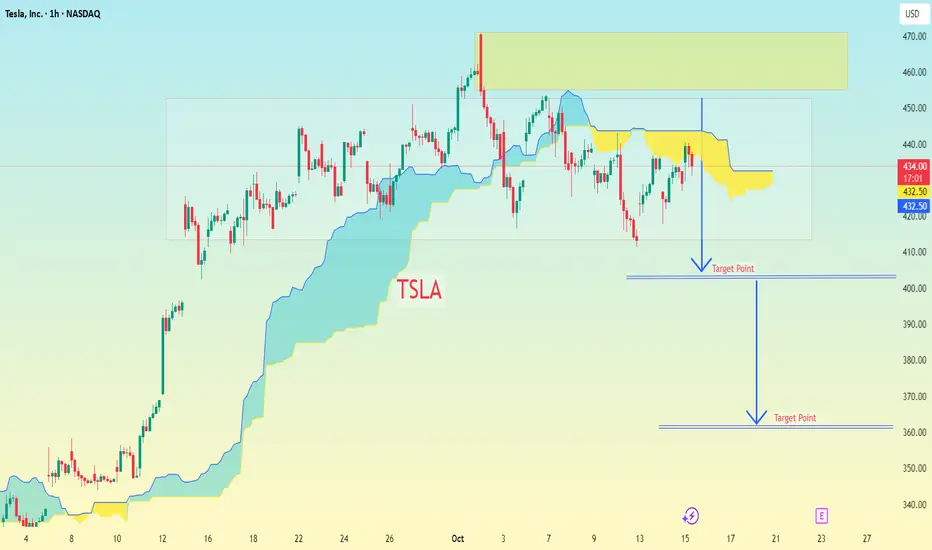
TSLA with Ichimoku Cloud...TSLA with Ichimoku Cloud and projected target points drawn below the current price.
Let’s break it down:
Current price on chart: around $434
Yellow zone (resistance): roughly $445–$465
First target line drawn: around $405–$410
Second (lower) target line drawn: around $365–$370
📊 Interpretatio
Amd - This is still not over yet!🚀Amd ( NASDAQ:AMD ) can rally another +25%:
🔎Analysis summary:
This month alone, Amd has been rallying another +50%. All of this happened because of an expected rejection at a major confluence of support. Looking at the rising channel pattern though, Amd can still rally another +25% before th

NVDA Oct. 15 2025NVDA trade idea based on current conditions. Its my first video and I'm learning to talk while recording. :P

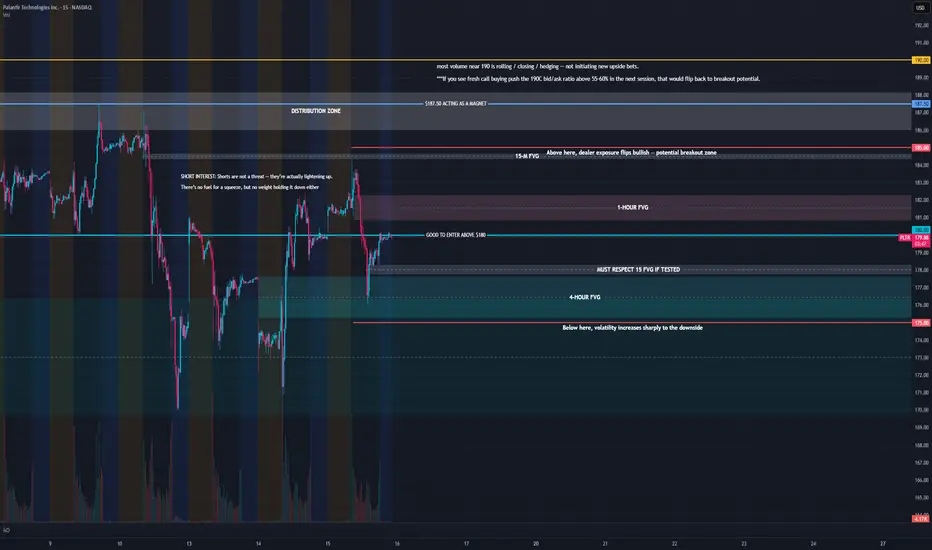
PLTR – Eyeing a Short-Term Push Into the 185–190 ZoneDescription
Been tracking PLTR’s short-term setup and the options flow is starting to paint a pretty clean picture.
Most of the call interest for this week is stacked between $185–$195, with the heaviest concentration around $185–$190 — basically forming a near-term “gamma magnet.” Dealers tend to
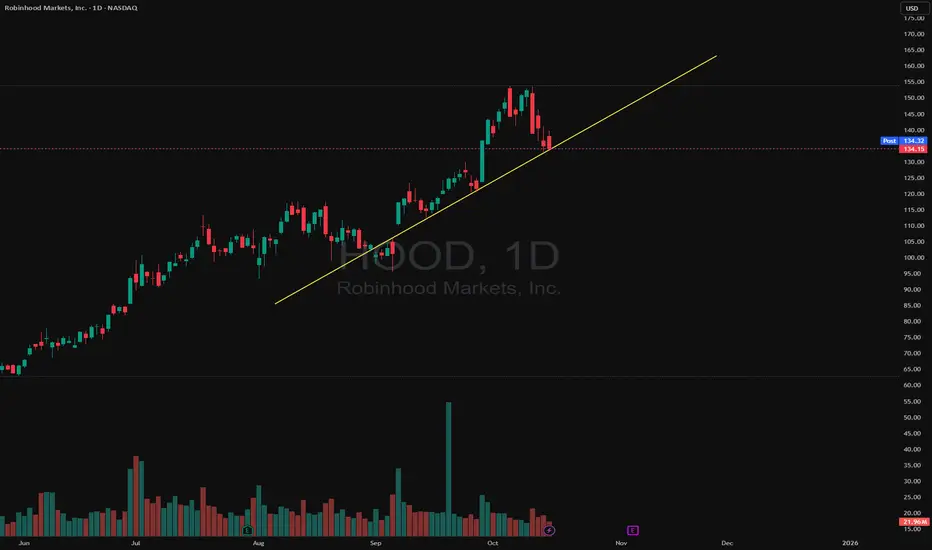
$HOOD by OceanNASDAQ:HOOD is retesting its ascending trendline after a strong rally. The stock continues to form higher highs and higher lows, keeping the uptrend intact.
It’s on high watch for next week —
Bullish scenario: A move above $140 could confirm momentum for a retest of the $155–$160 resistance zone.
Chimichurri Salsa will bring $CMG to $50NYSE:CMG Is at a great discount after rising 657% since 2020 to It's peak in June 2024. Since June, the Stock has fallen about 40% after mediocre results. Now, its around the $40-42 range, which in my opinion, is at a perfect discount. While earnings have been constant with the estimate, their reve

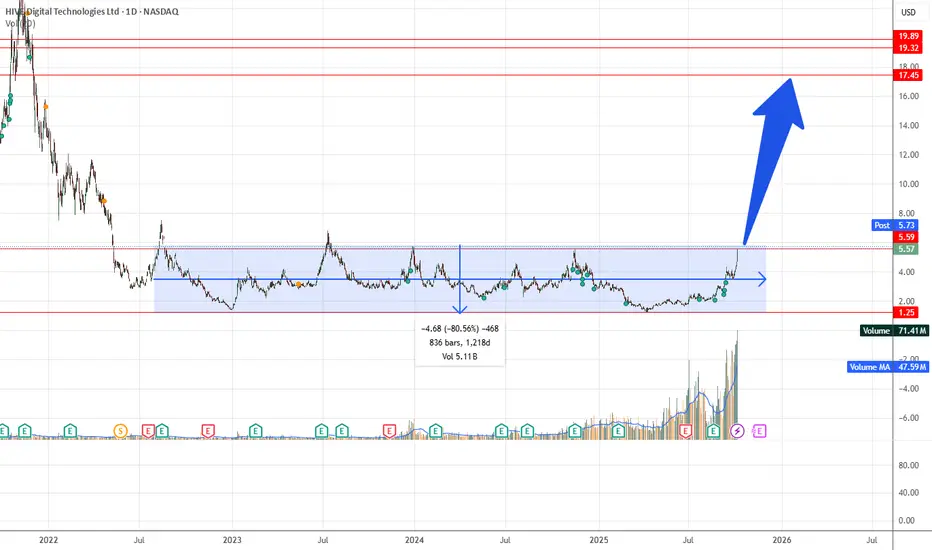
Hive coming out from strong consolidation zoneI believe HIVE has a decent chance of breaking out, especially if crypto markets are strong and positive news continues. The technicals are supportive, and the fundamental catalysts exist.
But I’m not super confident it’s a sure thing. I’d want confirmation (e.g. sustained move above resistance, st
See all stocks ideas
Today
MTBM&T Bank Corporation
Actual
4.82
USD
Estimate
4.43
USD
Today
CBSHCommerce Bancshares, Inc.
Actual
1.06
USD
Estimate
1.10
USD
Today
BKThe Bank of New York Mellon Corporation
Actual
1.88
USD
Estimate
1.76
USD
Today
KEYKeyCorp
Actual
0.41
USD
Estimate
0.38
USD
Today
SNASnap-On Incorporated
Actual
5.02
USD
Estimate
4.64
USD
Today
IIINInsteel Industries, Inc.
Actual
0.74
USD
Estimate
0.79
USD
Today
MMCMarsh & McLennan Companies, Inc.
Actual
1.85
USD
Estimate
1.78
USD
Today
USBU.S. Bancorp
Actual
1.22
USD
Estimate
1.13
USD
See more events
Community trends
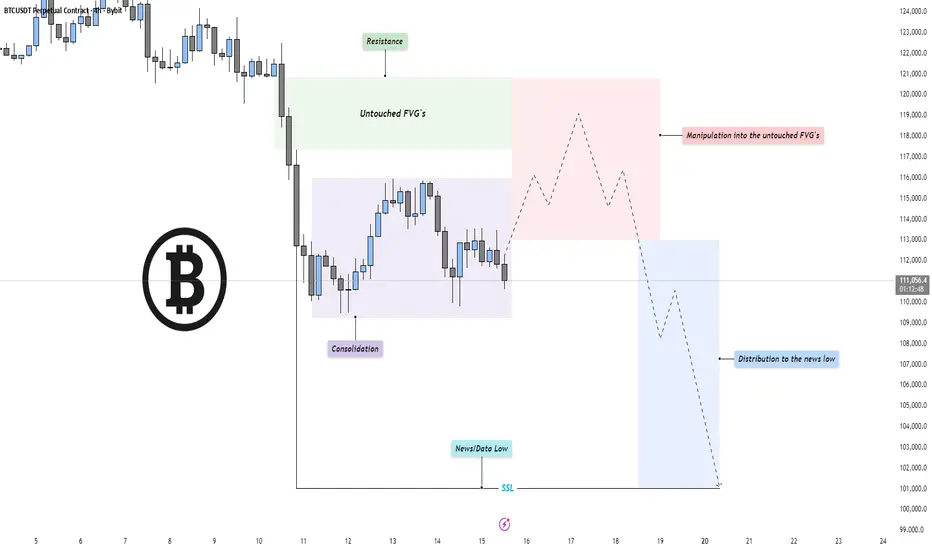
BTC - Perfect Power of 3 setup!Market Context
Bitcoin has entered a phase of compression after an extended bearish leg, with price currently consolidating near recent lows. The previous selloff created a clean structure of inefficiencies and untouched fair value gaps (FVGs) above, now acting as potential magnet zones for short-t
Bitcoin - This 2017 trendline predicts a huge crash below 60k!This long-term trendline 2017 - 2021 - 2025 worked perfectly on Bitcoin this year, because we saw 4 major rejections every time the price touched the trendline! Many people said that I must do analysis on the LOG scale only and that this trendline is not valid. Well, the opposite is truth - both lin

Bitcoin - First Signs of the Bear AwakeningBitcoin recently swept the previous all-time high, taking liquidity from the major external range. After that sweep, price reacted sharply downward, leaving behind a significant daily imbalance. This gap is now acting as resistance, with clear rejection seen on the daily timeframe. The move signals

Is a visit to $100k about to print for Bitcoin? - October 15thUp’October is widely expected, myself included. Statistically speaking the 2nd October post Halving is a strong green month. All the influencers are talking about it. That was until the largest forced liquidation event in the history of the asset class wiped out $19billion. What a number. One man, o

Bitcoin - Is the top already in?Introduction
This chart analyzes Bitcoin’s cyclical timing. The focus is on time, not price. It examines the number of days between structural moments such as cycle tops, cycle bottoms, and halvings. By comparing these intervals, we can understand rhythm and consistency. This helps determine whethe

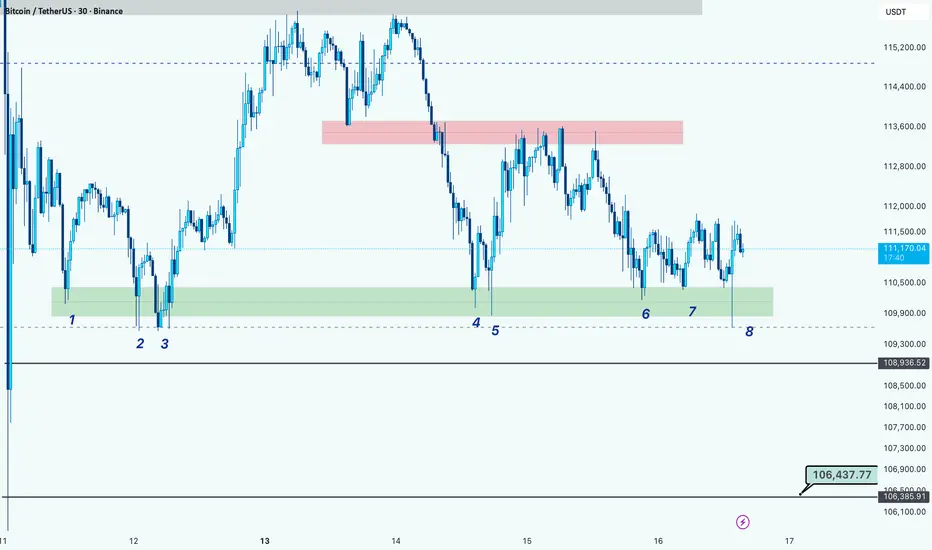
BTC Testing Key Support for the 8th Time, Breakdown Ahead?Hi guys!
BTC has tested the same support zone eight times around the $110,000 – $110,300 range (highlighted in green).
Repeated retests of a support level often signal weakening buyer strength, increasing the probability of a breakdown.
If the price manages to break below this zone, the next key
Bitcoin can Reverse Sharply After this CorrectionHello traders, I want share with you my opinion about Bitcoin. The market structure for Bitcoin has turned decidedly bearish in the short term, following a significant breakdown from its recent triangle consolidation pattern. This corrective phase began after a failed rally to a new all-time high ne

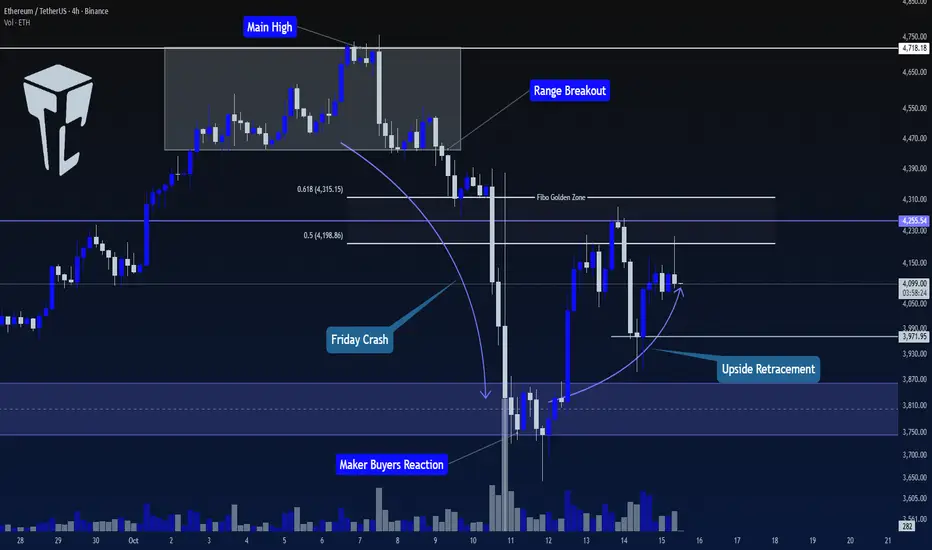
TradeCityPro | Ethereum: Break Key Levels for Bullish Momentum👋 Welcome to TradeCity Pro!
In this analysis, I want to examine Ethereum for you. The queen of the crypto market, with a $497 billion market cap, is ranked 2nd on CoinMarketCap.
⏳ 4-Hour Timeframe
This coin, in the 4-hour timeframe, after breaking the range box at the ceiling and moving towards the
BTC to Gold Cracking Lower! CAUTION!This could end up turning into a significant crack! for BTC relative to Gold. We have a fight on our hands between Speculation (BTC) and a Safe asset (Gold)
For over 4 years, speculation has not been able to outperform safety, and it is now starting to break lower.
CAUTION! is in order!
Click boo

Bitcoin’s Bloodbath Was a Setup Smart Money Knows ItBitcoin remains structurally bullish despite the recent market turmoil. The monthly chart clearly shows that the main ascending trendline continues to hold firm acting as the backbone of the current bull cycle.
The recent drop was nothing more than a controlled retest of this key support zone. As l

See all crypto ideas
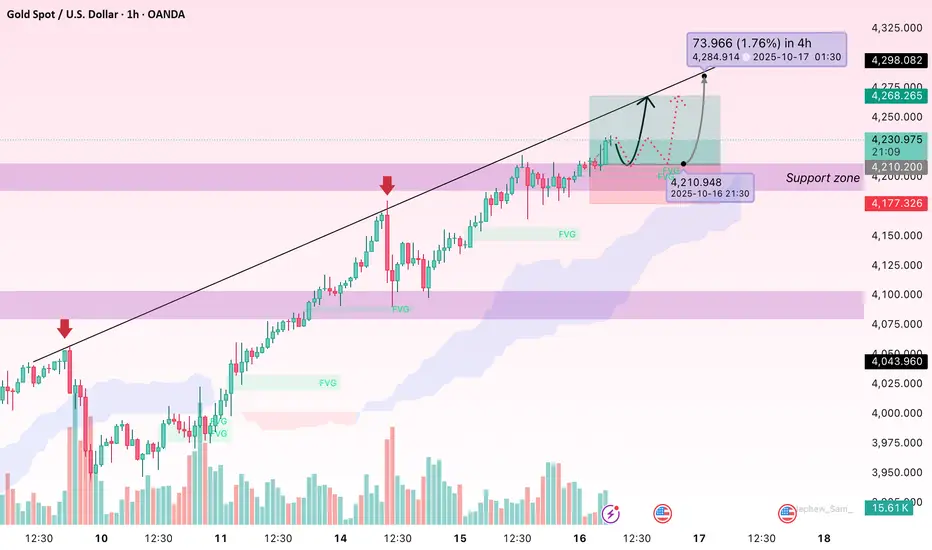
GOLD → After the pullback, growth may continue. 4250 - 4300?FX:XAUUSD continues to break records, approaching the $4,200 level amid escalating trade tensions and expectations of Fed policy easing. A correction is forming before the possible continuation of growth...
Key growth drivers: Trump is considering a ban on Chinese vegetable oil imports, and th

New zone for xauusd Gold (XAU/USD) is showing strong bullish momentum, trading around 4164 with potential continuation toward the 4236 resistance. Price may retest the fair value zone near 4150 before pushing higher, while support remains around 4091.

XAUUSD – Favor the BULLISH scenario, trade the price channelMacro backs the bulls: Gold just broke above $4,200/oz on expectations of imminent Fed rate cuts, while geopolitics and renewed US–China trade tensions are sending flows back into safe havens. Such capital typically doesn’t “flip” quickly, so the uptrend still has room.
H1 technicals: Price is movi

When Everyone’s Buying, I’m Watching for the TopAs we’ve grown used to by now, Gold sets a new ATH almost every day — and by the time we, in Europe, wake up, it’s already 300–400 pips higher.
Yet despite the strong bullish momentum, speculative trading remains extremely difficult. Sudden drops of hundreds of pips can easily hit your stop loss if

XAUUSD Maintains Uptrend – Potential Retest AheadHello everyone,
Today, observing the H1 gold chart, I notice that buying pressure remains strong, but recent minor pullbacks indicate the market is seeking balance before the next move. XAUUSD continues a clear uptrend with higher highs and higher lows, alongside multiple Fair Value Gaps (FVGs) fo
Gold Breaks New Records: Unstoppable Momentum ContinuesGold Breaks New Records: Unstoppable Momentum Continues
It was a big surprise that gold seems unstoppable and from all perspectives remains on the rise. I have not seen anything like this before in one of the most tradable assets.
All this upward momentum remains unclear. In my opinion, it is no

Gold (xauusd): still bullishHello guys!
Gold (XAU/USD) is showing a strong bullish trend on the 30-minute chart, but we can see that the upward trendline has recently been broken. Despite this, the price is approaching a key support zone between 4,086 and 4,058 (highlighted in blue), which has held as a strong buying area in

“I Am Become Meme, Destroyer of Short-Sellers”: Gold at $4,200Remember those days where you could short gold and turn a profit? They’re gone. The precious metal is relentlessly pushing higher, breaking every short-seller’s dreams and portfolio.
It’s official — gold has gone full meme. The shiny metal that your grandparents swore by is now trending on Reddit
THE KOG REPORT - UpdateEnd of day update from us here at KOG:
Hmm, a decent day and a frustrating end of the day! We managed to complete our Excalibur targets on gold hitting 4 in a row and then started this range and witnessed a 400pip candle. We decided earlier we're not going to attempt any longs up here now unless

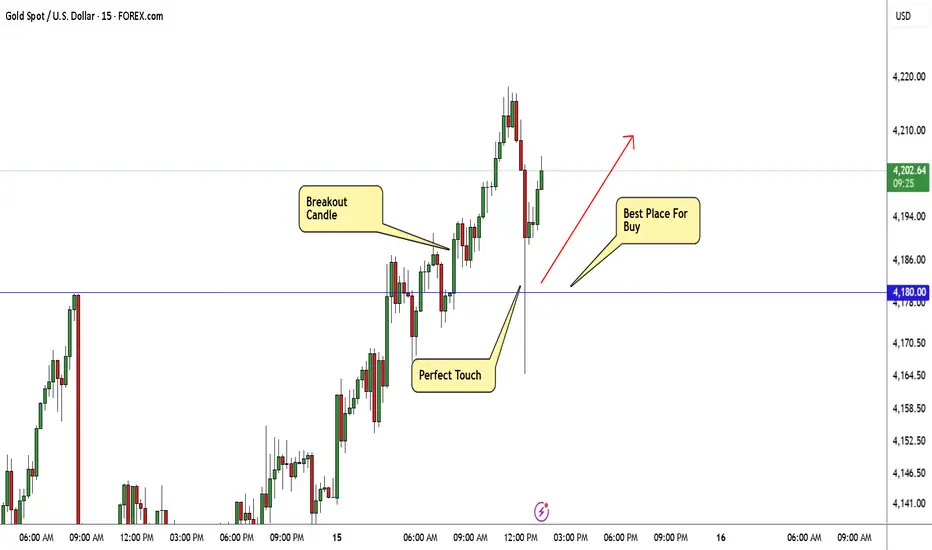
GOLD Breakout Done , Long Setup Valid To Get 300 Pips !Here is My 15 Min Gold Chart , and here is my opinion , the price going up very hard without any correction so we should move with it and we have a 4H Candle closure above our Res 4180.00 And Perfect Breakout and this give us a very good confirmation , so we have a good confirmation now to can buy a
See all futures ideas
EURUSD 30-Min — Volume Reversal Triggered by Institutional Flow🩸 Key Technical / Direction (Bullish Reversal Scenario)
Type: Mid-Term Reversal / Volume-Based Entry
———————————
Bullish Reversal Zone:
Price Range: 1.16150
☄️Reasons for Entry:
➕Volume Cluster Support (2+ sessions confirmed)
➕Missing POC Retest from Previous Range
➕Delta Imbalance Shows Buyer Ab

GBP/JPY | Breakout Alert! (16.10.2025)The GBP/JPY pair on the M30 timeframe presents a Potential Buying Opportunity due to a recent Formation of a Wedge Breakout Pattern.
This suggests a shift in momentum towards the upside and a higher likelihood of further advances in the coming hours.
Possible Long Trade:
Entry: Consider Entering

USDJPY I Monthly CLS I Stop hunt I ReversalHi friends, new range created. As always we are looking for the manipulation in to the key level around the range. Don't forget confirmation switch from manipulation phase to the distribution phase to make the setup valid. Stay patient and enter only after change in order flow. If price reaches 50%

EUR/USD bullish setupEUR/USD is forming a bullish setup. Price is expected to retrace to the demand zone near 1.1650–1.1660 before moving upward toward the target zone at 1.1712–1.1743. Stop loss is set below 1.1609.

EUR/USD | EURUSD Breakdown Alert: Could It Drop Toward 1.1565?By analyzing the EUR/USD chart on the 2-hour timeframe, we can see that the price is currently trading around 1.162 .
If it manages to hold below the 1.164 level, we could expect further downside movement from the Euro.
The next potential bearish targets are 1.160, 1.158, and 1.1565 .
Please s

#EURAUD: Big +1200 PIPS Swing Buy In Making! Comment Your Views!
OANDA:EURAUD
The EURAUD price is currently accumulating and on the verge of distribution. We recommend waiting for the price to break through the trading trend line before considering a buy entry. Our target is 1.90, a significant move that will take time to reach. We suggest conducting your o

AUDUSD Eyes 0.64500 Support as Bullish Structure Holds FirmHey Traders,
In today’s session, we’re closely monitoring AUDUSD for a potential buying opportunity around the 0.64500 zone. The pair continues to trade within a broader uptrend, and the current pullback appears to be a healthy correction toward a key support and resistance confluence near 0.64500.
EUR/AUD: Important Breakout! With a robust bullish rally, 📈EURAUD broke and closed above a key daily resistance cluster yesterday.
The broken structure and an ascending trend line now constitute a significant demand zone.
A bullish continuation is anticipated.
The subsequent resistance level is projected at 1.8075.

GBP/JPY (30-minute chart) with Ichimoku...GBP/JPY (30-minute chart) with Ichimoku and trendline breakout setup:
Current price: around 202.50
Breakout zone: near 202.20–202.40
Targets marked on chart:
First Target: ≈ 203.50
Second Target: ≈ 205.00
🎯 Analysis Summary
Price has broken above the descending trendline and is currently te

EURUSD: Down Trend will Continue in ChannelHello everyone, here is my breakdown of the current Euro setup.
Market Analysis
EURUSD has shifted to a bearish structure. This happened after a 'fake breakout' to a new All-Time High was aggressively sold off, leading to a sharp reversal. This sell-off has since been contained within a well-de

See all forex ideas
| - | - | - | - | - | - | - | ||
| - | - | - | - | - | - | - | ||
| - | - | - | - | - | - | - | ||
| - | - | - | - | - | - | - | ||
| - | - | - | - | - | - | - | ||
| - | - | - | - | - | - | - | ||
| - | - | - | - | - | - | - | ||
| - | - | - | - | - | - | - |
Trade directly on the supercharts through our supported, fully-verified and user-reviewed brokers.


