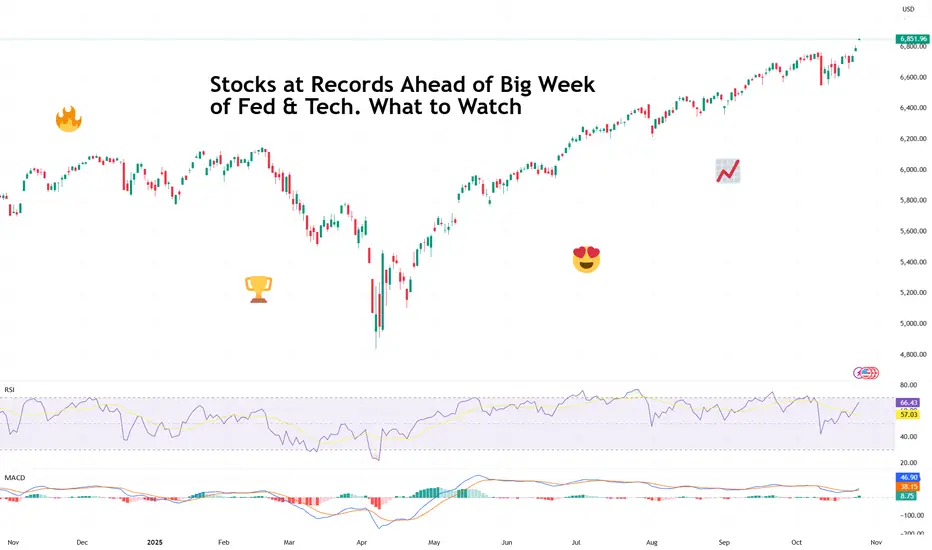
Stocks at Records Ahead of Big Week of Fed & Tech. What to WatchRecord highs, rate-cut optimism, five tech giants on deck — what a time to be a market participant!
It’s Monday, and Wall Street is back doing what it does best — setting new records and pretending not to worry about what comes next.
After a cooler-than-expected inflation print and some diplomat

The best trades require research, then commitment.
Get started for free$0 forever, no credit card needed

Scott "Kidd" PoteetThe unlikely astronaut

Where the world does markets
Join 100 million traders and investors taking the future into their own hands.
BTCUSDT – When the Bullish Wave ReturnsBitcoin is showing a notable recovery phase after a series of previous corrections. On the daily timeframe, price continues to move within an ascending channel that has been forming since the beginning of Q3.
Currently, BTC is approaching the midline of the channel around 115,000–116,000 USD , w

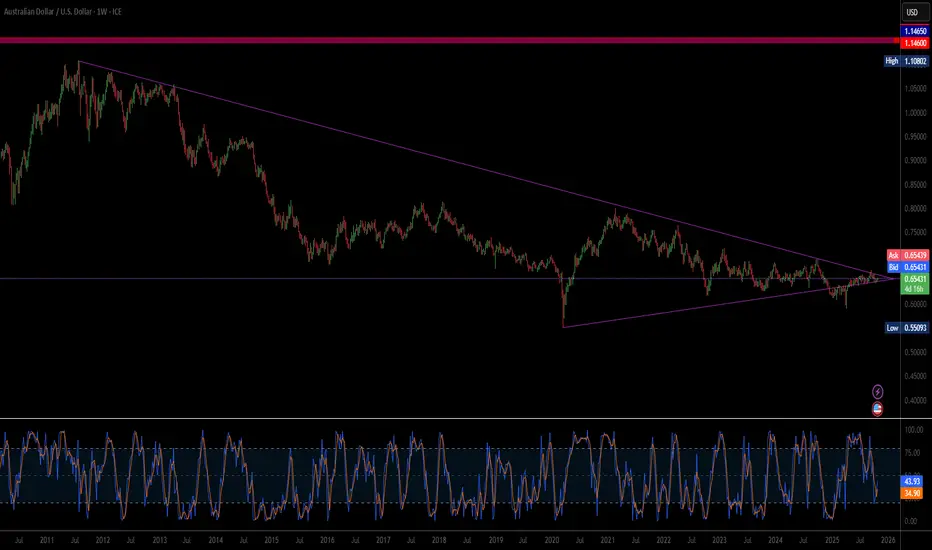
Is Geopolitical Re-Alignment the New AUD Catalyst?The Australian Dollar's (AUD) sharp surge against the US Dollar (USD) is driven by a powerful synergy of geopolitical de-escalation and structural economic realignment. Near-term momentum stems from optimism surrounding an imminent US-China trade deal. As a primary commodity exporter and a financial
Can WTI’s 8% Rally Hold After Trump-Putin Summit Collapse?WTI just staged its biggest two-day rally since June, as hopes for a Trump-Putin summit were dashed, leading to new US sanctions on Russian oil exports.
Here’s what’s fuelling the move and what traders should watch next:
- US sanctions on Russia’s top oil producers after failed Budapest summit tr

XAUUSD-seeking $4,000 region?As my H4 chart shows, gold did make a double top a few days ago and then crashed. You can give credit for this massive 3,800 points move to profit taking or economic uncertainty or any technical reason, maybe a combination but it really does not matter.
What does matter is that we now have a double

BTCUSDT: Bounce from Support Could Ignite Rally Toward $114KHello everyone, here is my breakdown of the current Bitcoin setup.
Market Analysis
Bitcoin (BTCUSDT) has recently transitioned from a bearish phase to a bullish structure after breaking out of a prolonged downward channel. The market had been forming a sequence of lower highs and lower lows until

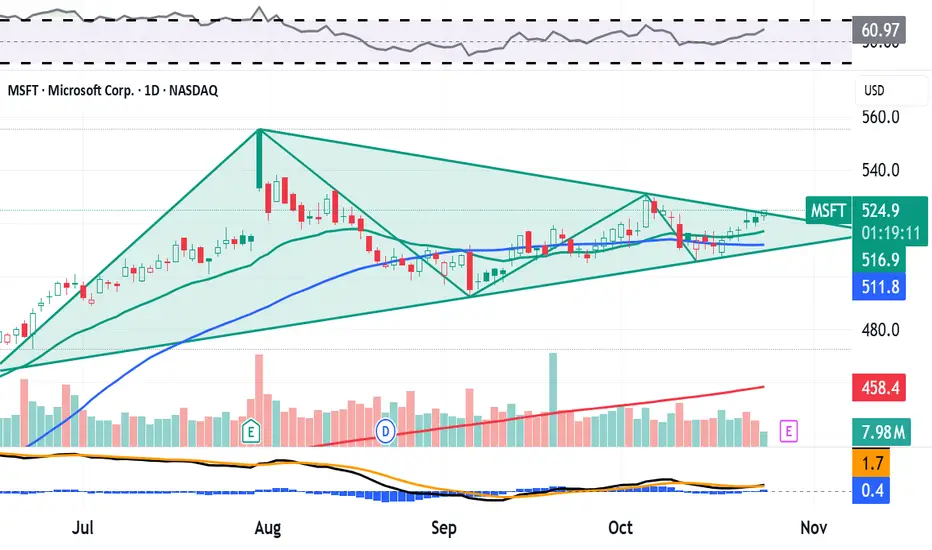
Here's What Microsoft's Chart Says Heading Into EarningsMicrosoft NASDAQ:MSFT , which will release earnings next week, is beating the S&P 500 SP:SPX year to date -- up 24.4% vs. about 15.7% for the SPX. MSFT has also gained roughly 112% over the past three years, while the S&P 500 has added just 78.9%. What does the company's chart show us ahead of e
Tesla Stock Wobbles as Profit Dives 37%, Revenue Pops. Now What?Tesla NASDAQ:TSLA posted a 12% jump in revenue on Wednesday, reaching $28.1 billion, well above Wall Street’s $26.37 billion estimate. And yet, the stock slipped nearly 1% on the day before paring back that loss with a 2.3% Thursday gain.
Why? Because profits fell faster than Cybertruck’s reput

Gold 1979 vs 2025 — When History Whispers and Markets Listen
🌕 1. The Echo of 1979
In 1979, the world watched Gold do the impossible. The metal surged from $226 to over $850 per ounce in less than a year, a 275% explosion that turned fear into fortune.
The triggers were seismic.
🇮🇷 The Iranian Revolution disrupted global oil flows.
🏛️ The U.S. Embassy host

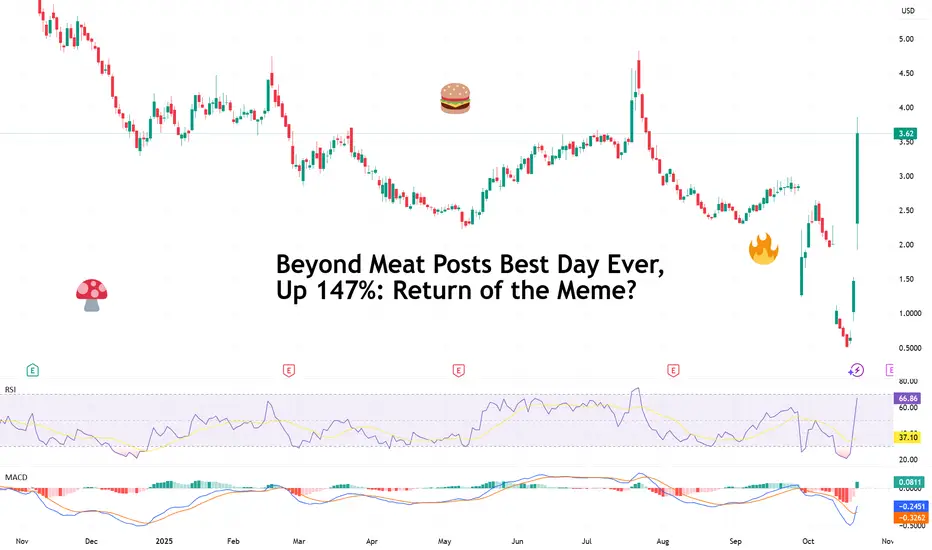
Beyond Meat Posts Best Day Ever, Up 147%: Return of the Meme?🔥 A Sizzling Comeback or Just Froth?
Beyond Meat NASDAQ:BYND , once the darling of the plant-based revolution and later the focus of every “overcooked IPO” joke, just got on everyone’s radar: a 147% single-day surge, its best performance ever.
For a company that was trading at just 65 cents las
See all editors' picks ideas
Fair Value Gaps by DGTFair Value Gaps
A refined, multi-timeframe Fair Value Gap (FVG) detection tool that brings institutional imbalance zones to life directly on your chart.
Designed for precision, it visualizes how price delivers into inefficiencies across chart, higher, and lower (intrabar) timeframes — offering a fl

TASC 2025.11 The Points and Line Chart█ OVERVIEW
This script implements the Points and Line Chart described by Mohamed Ashraf Mahfouz and Mohamed Meregy in the November 2025 edition of the TASC Traders' Tips , "Efficient Display of Irregular Time Series”. This novel chart type interprets regular time series chart data to create an ir

Simplified Percentile ClusteringSimplified Percentile Clustering (SPC) is a clustering system for trend regime analysis.
Instead of relying on heavy iterative algorithms such as k-means, SPC takes a deterministic approach: it uses percentiles and running averages to form cluster centers directly from the data, producing smoo

Adaptive Volume Delta Map---
📊 Adaptive Volume Delta Map (AVDM)
What is Adaptive Volume Delta Map (AVDM)?
The Adaptive Volume Delta Map (AVDM) is a smart, multi-timeframe indicator that visualizes buy and sell volume imbalances directly on the chart.
It adapts automatically to the best available data resolution

Dynamic Equity Allocation Model"Cash is Trash"? Not Always. Here's Why Science Beats Guesswork.
Every retail trader knows the frustration: you draw support and resistance lines, you spot patterns, you follow market gurus on social media—and still, when the next bear market hits, your portfolio bleeds red. Meanwhile, institution

First Passage Time - Distribution AnalysisThe First Passage Time (FPT) Distribution Analysis indicator is a sophisticated probabilistic tool that answers one of the most critical questions in trading: "How long will it take for price to reach my target, and what are the odds of getting there first?"
Unlike traditional technical indicators

PongExperience PONG! The classic arcade game, now on your charts!
With this indicator, you can finally achieve your lifelong dream of beating the Markets. . . at PONG!
Pong is jam-packed with features! Such as:
2 Paddles
A moving dot
Floating numbers
The idea of a net
This indicator is solel

Options Max Pain Calculator [BackQuant]Options Max Pain Calculator
A visualization tool that models option expiry dynamics by calculating "max pain" levels, displaying synthetic open interest curves, gamma exposure profiles, and pin-risk zones to help identify where market makers have the least payout exposure.
What is Max Pain?
Max

Volume Profile 3D (Zeiierman)█ Overview
Volume Profile 3D (Zeiierman) is a next-generation volume profile that renders market participation as a 3D-style profile directly on your chart. Instead of flat histograms, you get a depth-aware profile with parallax, gradient transparency, and bull/bear separation, so you can see w

RiskMetrics█ OVERVIEW
This library is a tool for Pine programmers that provides functions for calculating risk-adjusted performance metrics on periodic price returns. The calculations used by this library's functions closely mirror those the Broker Emulator uses to calculate strategy performance metrics (

See all indicators and strategies
Community trends
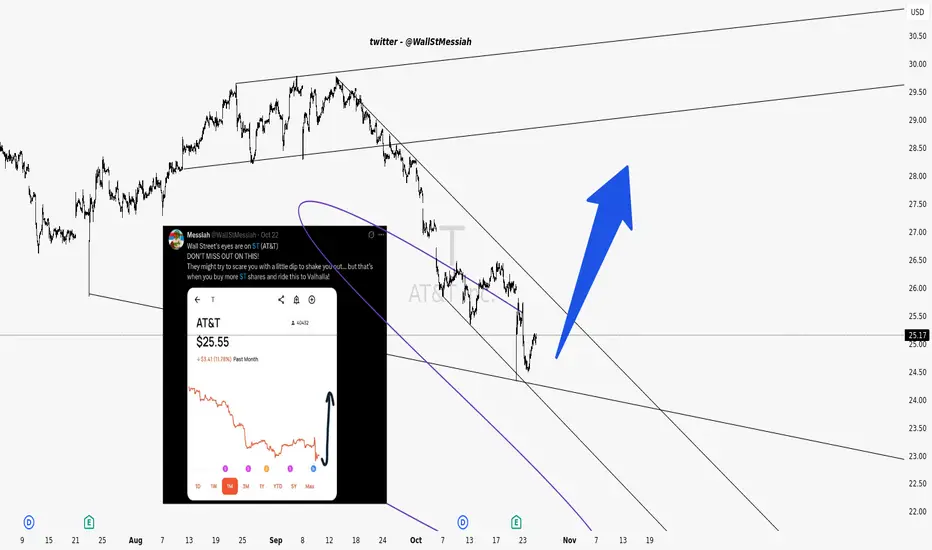
AT&T (T) — Bullish Breakout Setup Forming! Don’t Miss This MoveWall Street’s been sleeping on $T for too long…
After weeks in a clear downtrend, AT&T is showing serious signs of a **reversal setup** within this falling channel.
👀 Watch how price is bouncing off the lower trendline with strong volume support — a classic accumulation signal.
💪 Break above this d
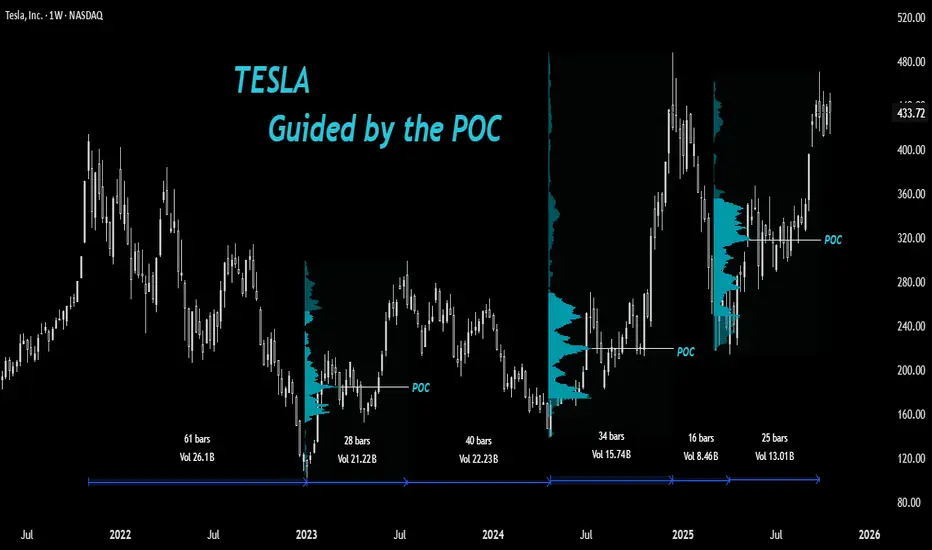
Tesla: Guided by the Point of Control🔎Understanding How Stocks React at Key Volume Profile Levels
In this post, let’s study how a stock can react around important Volume Profile levels and how we, as traders, can take advantage of this behavior.
🔘 A Quick Look at Volume Profile
The Volume Profile shows how much trading took place
do you want your CAKE and eat it too?just want to put this one on everyones radar
theres a ton of reversal signals, EMA's flipping, lagging line cracking the price action, trend going above.
if you want a risky play you buy in now
if you want safe, buy when price cracks out of the colored span.

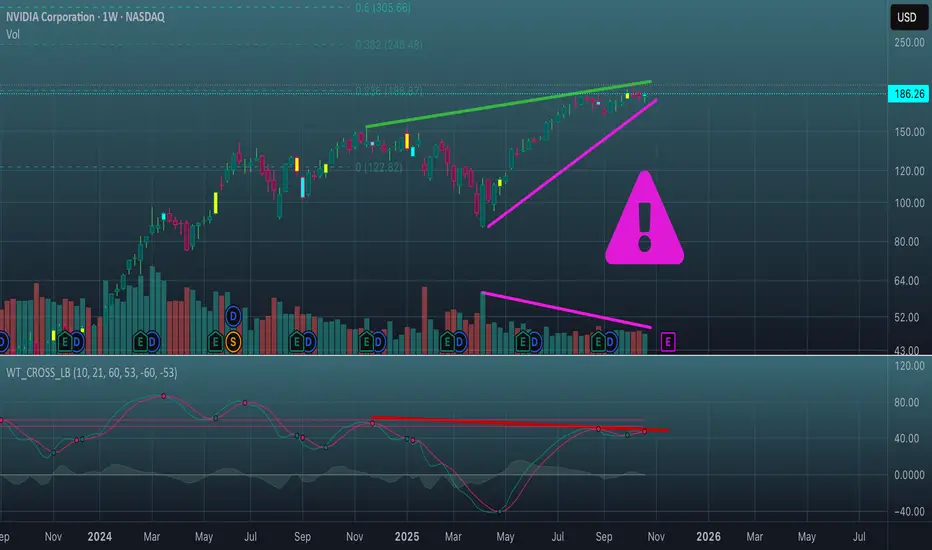
Elliott Waves Don’t Lie: NVDA’s Path to $26,000Summary: “Elliott Waves, Fibonacci, and Smart Money align perfectly — NVIDIA’s long-term chart points to an AI-powered Supercycle with massive upside." 💎📊
🚀 NVDA | The Supercycle of the AI Era! 💚
🌀 Elliott Wave Supercycle Breakdown
NVIDIA’s price action over the past two decades is a textbo

Recovery is needed.Damn, the picture looks like a carbon copy TSLA.
There may be a few more sideways candles,
but the overall picture points to a correction.
GameStop's Bullish Momentum Suggests Upside Before Holiday SeasoCurrent Price: $23.3
Direction: LONG
Targets:
- T1 = $26.5
- T2 = $29.0
Stop Levels:
- S1 = $22.0
- S2 = $20.5
**Wisdom of Professional Traders:**
This analysis synthesizes insights from thousands of professional traders and market experts, leveraging collective intelligence to

Bullish momentum for BYND (Reminds me of the the one who shall nIn the five years of trading i've come across many setups like this and 8/10 print money. Trade with caution though, make sure you have an exit on both side of the trade.
Happy hunting
L.M.

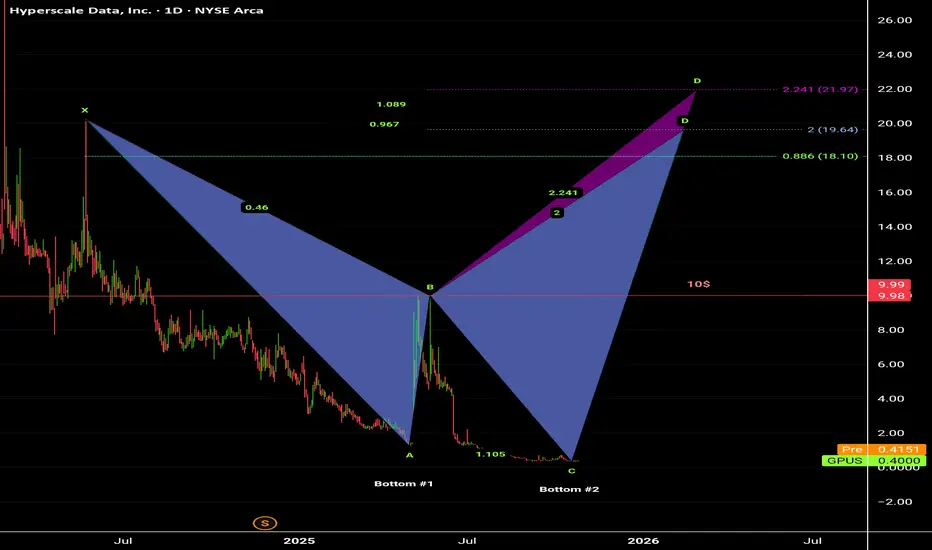
Hyperscale Data, Inc. Common Stock (GPUS)Stock expected to go through a Harmonic pattern formation as shown on the chart, where it leads to very , and in my opinion as an analyst the ranging target prices after breaking up Resistance level $10 will be between $18.10 and $22 in the coming months due to the successive constantly positive new
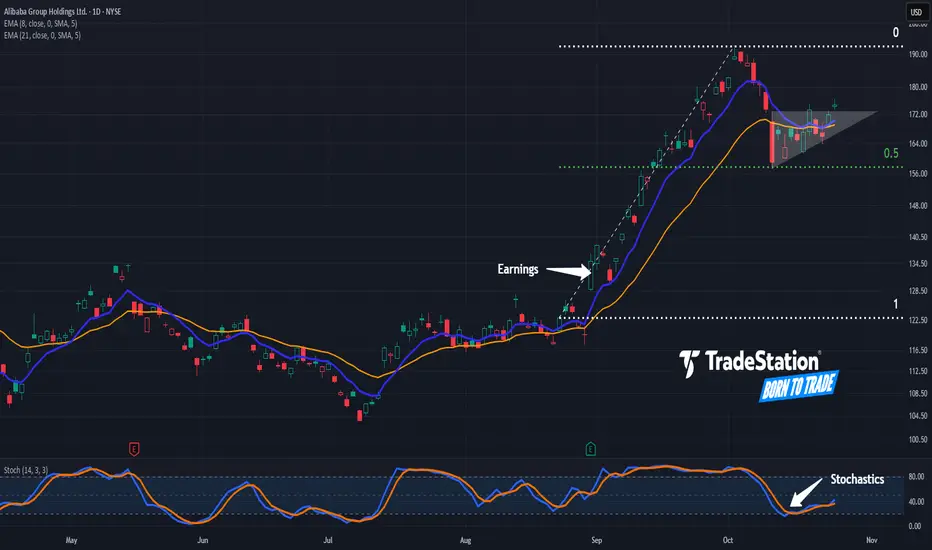
Potential Continuation Patterns in AlibabaAlibaba rallied in September. Now, after a pullback, some traders may see potential for continuation.
The first pattern on today’s chart is the advance between August 22 and October 2. The Chinese e-commerce giant stabilized after retracing half the move, which may suggest its direction remains upw
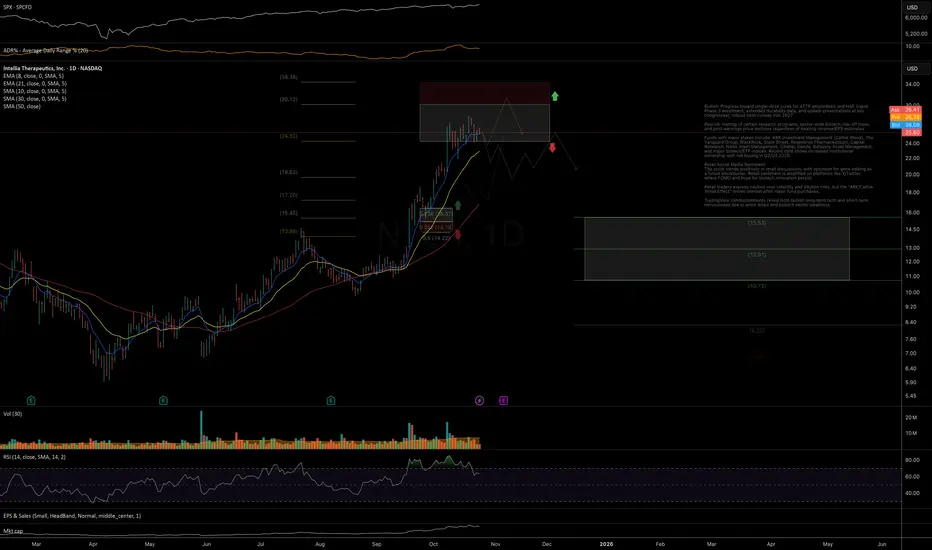
NTLA: reached key resistance zonePrice has followed through strongly from the mid-term support outlined in the September update, moving directly into the target mid-term resistance zone.
As long as the price remains below 30, I expect a near-term pullback below the 21dEMA to complete the first leg of decline.
If, however, the pri
See all stocks ideas
Today
RVTYRevvity, Inc.
Actual
1.18
USD
Estimate
1.14
USD
Today
CRICarter's, Inc.
Actual
0.74
USD
Estimate
0.73
USD
Today
KDPKeurig Dr Pepper Inc.
Actual
0.54
USD
Estimate
0.54
USD
Today
BOHBank of Hawaii Corporation
Actual
1.20
USD
Estimate
1.17
USD
Today
LKFNLakeland Financial Corporation
Actual
1.03
USD
Estimate
1.04
USD
Today
FNWBFirst Northwest Bancorp
Actual
0.09
USD
Estimate
0.19
USD
Today
ARLPAlliance Resource Partners, L.P.
Actual
0.73
USD
Estimate
0.64
USD
Today
ATLXAtlas Lithium Corporation
Actual
—
Estimate
−0.64
USD
See more events
Community trends
BTCUSDT: Bounce from Support Could Ignite Rally Toward $114KHello everyone, here is my breakdown of the current Bitcoin setup.
Market Analysis
Bitcoin (BTCUSDT) has recently transitioned from a bearish phase to a bullish structure after breaking out of a prolonged downward channel. The market had been forming a sequence of lower highs and lower lows until
BTCUSDT – When the Bullish Wave ReturnsBitcoin is showing a notable recovery phase after a series of previous corrections. On the daily timeframe, price continues to move within an ascending channel that has been forming since the beginning of Q3.
Currently, BTC is approaching the midline of the channel around 115,000–116,000 USD , w
BTC Accumulates Before Breakout – Market Tension BuildingHello everyone, Bitcoin is trading around $110,965 – down slightly by 0.05%, but the price structure indicates this is not a sign of weakness; rather, it is an accumulation phase before the market chooses its next direction. Narrow ranges in recent sessions reflect a waiting mindset – the market is

Bitcoin broke the falling trendline and now Pump ahead As observed on the chart, the price is currently testing a major daily support zone. Furthermore, the area below $108K is considered one of the most favorable accumulation zones for institutional investors ("whales"). Concurrently, as evident on lower timeframes, the price has executed a decisive br

Lingrid | SUIUSDT Bearish Trend Shorting OpportunityBINANCE:SUIUSDT is rebounding from the channel’s lower boundary after forming a solid bottom near the support level. The structure still respects a broad descending channel while holding above a minor range base. A break above 2.71 would confirm short-term continuation toward mid-range resistance a

Bitcoin Rally Heating Up – Watch This Zone Carefully!As the new week kicked off, Bitcoin ( BINANCE:BTCUSDT ) started to climb, fueled by a pump in the S&P500 index ( SP:SPX ) and the creation of a gap in the S&P500 index.
It seems Bitcoin has successfully broken above the 100_SMA(Daily) and 50_SMA(Daily) , as well as a Resistance zone($114

Bitcoin: There Are Better Prices To Buy.Bitcoin bounce to 113K resistance, which I previously described as a more relevant area to watch for being that it is in the middle of the range. IF momentum continues from here, the 116K to 118K area resistance is the next potential inflection point to prepare for. IF price confirms a bearish rever

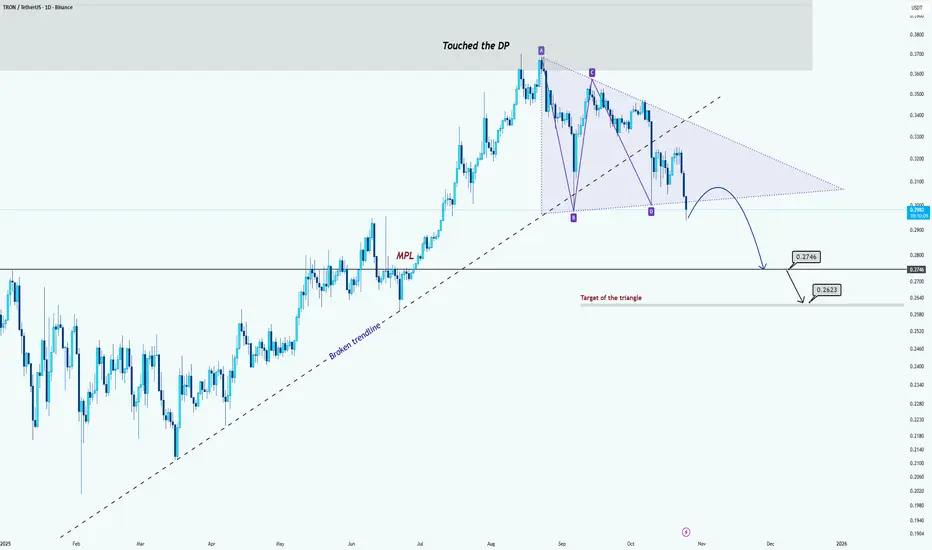
TRON Consolidating Before Potential Drop Toward 0.27–0.26 ZoneHi guys!
TRON touched the Decision Point (DP) and has been consolidating inside a descending triangle pattern. After the triangle’s support line was tested several times, the price broke below the broken ascending trendline, confirming weakness in bullish momentum.
Currently, the market seems to b
BTCUSD – Long-Term Uptrend Still Intact👋Hello everyone! What’s your view on BITSTAMP:BTCUSD right now?
In this analysis, I’ll share my long-term perspective on Bitcoin.
Currently, BTC is trading around $111,600. Although the market has seen some short-term pullbacks, the overall weekly structure still shows a strong medium- to long-t

Avax next big move 25% gain toward 26$Hi the support and resistances on the chart are based on the previous data and weekly candlesticks if BINANCE:AVAXUSDT holds this last support the potential of 25% gain is logical toward 26$

See all crypto ideas
XAUUSDHello Traders! 👋
What are your thoughts on Gold?
Gold experienced a sharp decline last week, but found support around the $4,000 zone, leading to a modest rebound.
Since then, the price has entered a range-bound phase, oscillating between key support and resistance levels.
Current Outlook:
The nex

Gold Preparing to Continue Its Bullish Move After ConsolidationHello traders, I want share with you my opinion about Gold. Gold has maintained a strong bullish structure over the recent period, forming a clear ascending channel that has been respected multiple times. Each correction has been followed by strong bullish impulses, confirming that buyers remain in

Lingrid | GOLD Weekly Price Analysis: Parabolic Pause or Peak?OANDA:XAUUSD experienced significant turbulence this week, initially pushing higher before encountering firm resistance and subsequently breaking down sharply toward the critical $4,000 psychological support level. This aggressive pullback, fueled by rising volume, signals a potential exhaustion of

XAUUSD: Healthy Pullback or the Start of a Downtrend?👋Hello everyone! What do you think about the current trend of OANDA:XAUUSD ?
Looking at last week’s movement, gold experienced a pullback after nine consecutive weeks of gains. By the end of Friday’s session, price action remained relatively calm, consolidating around the $4115 area while mainta

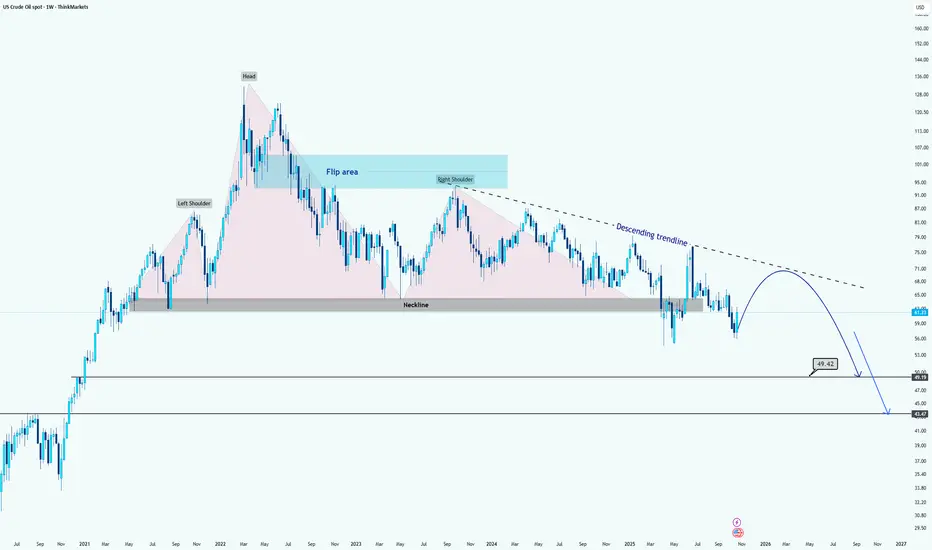
WTI Crude Oil Forms Major Head and Shoulders BreakdownHi guys.
WTI has formed a massive Head and Shoulders pattern on the weekly timeframe, signaling a potential long-term bearish reversal structure.
After the right shoulder completed, price decisively broke below the neckline around the $67–$70 range, confirming the pattern breakdown. This neckline
GOLD 1H CHART ROUTE MAP UPDATE & TRADING PLAN FOR THE WEEKHey Everyone,
Please see our updated 1h chart levels and targets for the coming week.
We are seeing price play between two weighted levels with a gap above at 4134 and a gap below at 4090. We will need to see ema5 cross and lock on either weighted level to determine the next range.
We will see le

Gold Rebound SetupGold (XAU/USD) is testing the support trend line around 4030. If it holds, price may rebound toward resistance levels at 4160 and 4236, with a potential target near 4370. A break below the trend line could indicate further downside pressure.

THE KOG REPORTTHE KOG REPORT:
In last week’s KOG Report we said we would be looking at two levels as potential for the long trades and target for the short trades. We ideally wanted price to push upside and complete the long target before turning and then completing the short target. During the early part of t

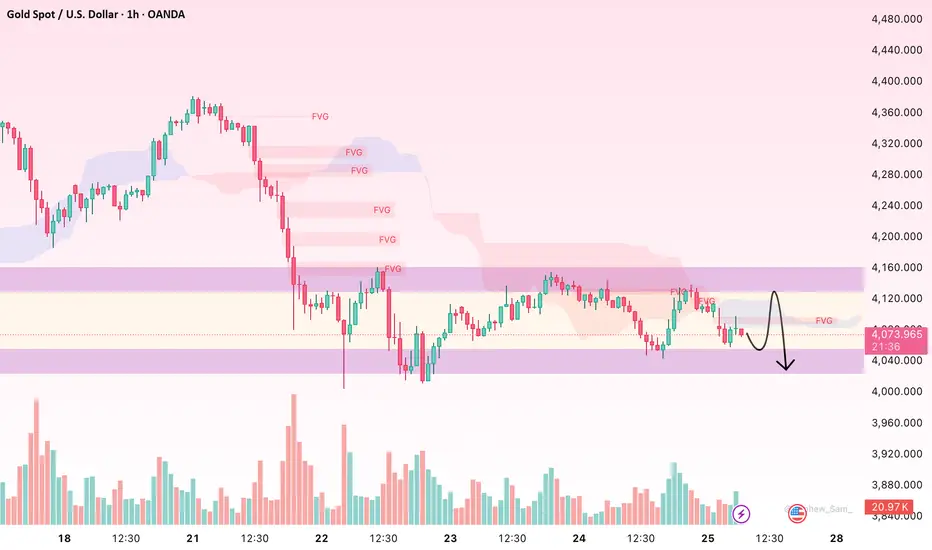
XAUUSD-seeking $4,000 region?As my H4 chart shows, gold did make a double top a few days ago and then crashed. You can give credit for this massive 3,800 points move to profit taking or economic uncertainty or any technical reason, maybe a combination but it really does not matter.
What does matter is that we now have a double
Gold consolidates after sharp decline – key levels aheadHello everyone, gold (XAU/USD) is trading around $4,080 after a drop of nearly 7.6% from the $4,380 peak. The decline has paused and the market has moved into a narrow consolidation zone between $4,050 – $4,120, reflecting cautious sentiment before choosing the next direction.
On the 1H chart, we
See all futures ideas
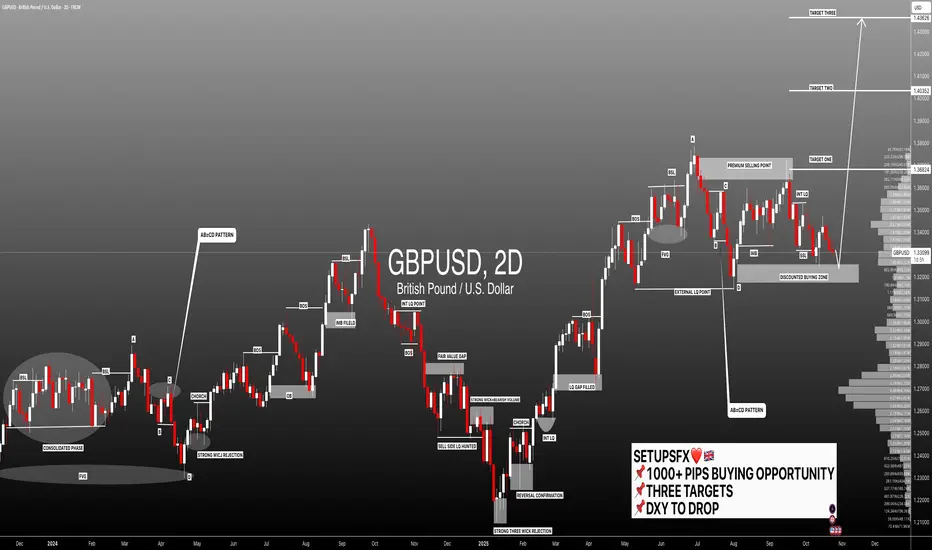
#GBPUSD:+1000 Pips Highly Probable Target! Agree with the idea? GBPUSD is currently trading at a highly probable point where we may see a strong bullish volume emerge in the market. This key level is only valid if the US dollar declines further, as a weak dollar will push our prices towards our target zones, helping us gain a higher risk-to-reward trade setup. P
EURUSD Short: Retest of Resistance Before Next Leg DownHello traders! The overall market structure for EURUSD continues to favor the bears, following a sharp rejection from the 1.1720 supply zone. This area marked a strong pivot point where the price failed to sustain any further bullish momentum and began forming a clear descending channel, establishin

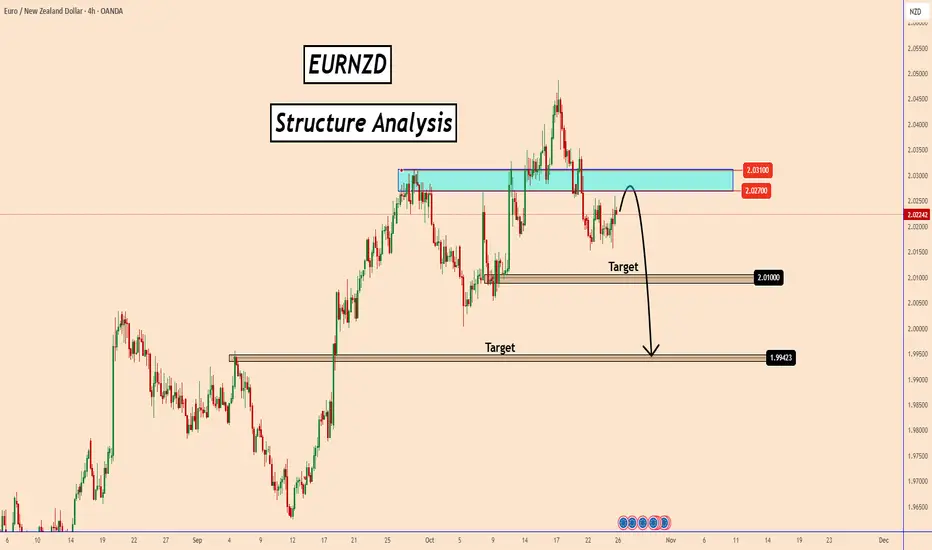
EURNZD Structure Signals Potential Downside MoveEURNZD Structure Signals Potential Downside Move
EURNZD is currently testing a key resistance zone between 2.0270 and 2.0310, an area that has acted as a strong supply zone in the past. The pair has shown multiple rejections around this level, suggesting that buyers are losing momentum and sellers
AUD/USD Breakout Bullish continuation AUD/USD price had been consolidating for a while, buyers were slowly building pressure, forming higher lows.
Each new push from buyers showed more strength, and each rejection from sellers grew weaker, momentum was clearly shifting.
Finally, buyers broke with conviction, showing strong bullish inte

EURUSD Breakdown Looms: Sellers Target 1.1560 Support ZoneHello traders, I want to share my opinion about the current EURUSD setup. After an extended bearish movement, EURUSD continues to trade within a descending channel, clearly defined by a Resistance Line connecting recent lower highs and a Support Line connecting the local lows. This structure outline

EURUSD – When the Green Light Begins to ShineHello traders,
On the 4-hour chart, EURUSD is showing signs of shifting from a consolidation phase to a clearer mild uptrend . The price has found a solid base near the 1.1595–1.1600 area, rebounding from the ascending trendline and now aiming for resistance around 1.1710 — a level where a stronger

EURUSD – Trapped in a Falling Channel👋 Hello everyone , great to see you again in today’s market discussion!
At the moment, FX:EURUSD is trading around 1.1620, continuing to follow its short-term bearish trend within a well-defined descending channel. After a brief rebound to retest the upper resistance zone near 1.1700, the pair fa

Lingrid | EURUSD Potential Bearish Momentum From Resistance ZoneThe price perfectly fulfilled my previous idea . FX:EURUSD is hovering just below the descending trendline after multiple failed attempts to reclaim resistance, showing clear weakness near 1.16675. The pair remains confined within a broad descending channel structure, with sellers defending each

UsdjpyUsdjpy M formation approaching Dxy has weakening a lil if I go base market structure I’ll say it’s looking like a perfect sell waiting on the 4h TF to close so our confirmation is Official zone to watch 151.378

EURUSD rebounds strongly – ready to break higherAfter several days of sideways trading, EURUSD is regaining its momentum , driven by two golden catalysts: a weaker USD following softer U.S. CPI data, and a stronger-than-expected recovery in Germany’s economy. This combination has triggered a broad “risk-on” wave across global markets, pulling

See all forex ideas
| - | - | - | - | - | - | - | ||
| - | - | - | - | - | - | - | ||
| - | - | - | - | - | - | - | ||
| - | - | - | - | - | - | - | ||
| - | - | - | - | - | - | - | ||
| - | - | - | - | - | - | - | ||
| - | - | - | - | - | - | - | ||
| - | - | - | - | - | - | - |
Trade directly on the supercharts through our supported, fully-verified and user-reviewed brokers.


