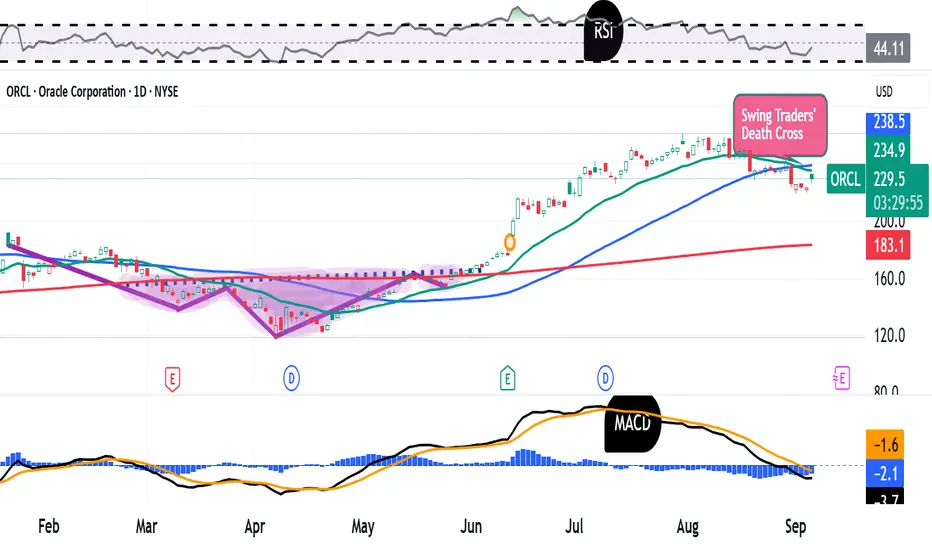
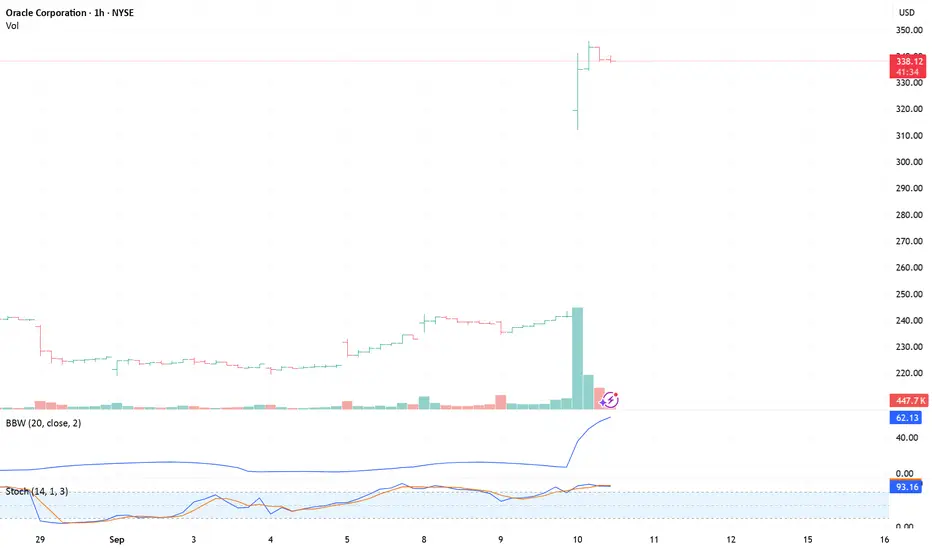
Oracle Is Up 80% Since April. What Does Its Chart Tell Us?Oracle NYSE:ORCL will release fiscal Q1 results next week at a time when the tech giant's stock has risen more than 80% from its April lows, but also given back some 15% since hitting a 52-week high in late July. Let's see what the stock's technical and fundamental analysis can tell us.
Oracle's

The best trades require research, then commitment.
Get started for free$0 forever, no credit card needed

Scott "Kidd" PoteetThe unlikely astronaut

Where the world does markets
Join 100 million traders and investors taking the future into their own hands.
Major indices
Long bond bulls’ eye bigger breakoutThe bullish move in U.S. ultra-long bond futures anticipated last week has played out nicely, with the contract surging higher over the subsequent days, taking out a key topside hurdle comprising the 200DMA and horizontal resistance at 119’19. The move has now stalled at a downtrend from the highs s

Downtrend in Dell?Dell Technologies has lagged the market for months, and some traders may see further downside in the maker of computer hardware.
The first pattern on today’s chart is the bearish gap on August 29 following quarterly results. While earnings and revenue beat estimates, investors focused on weaker mar

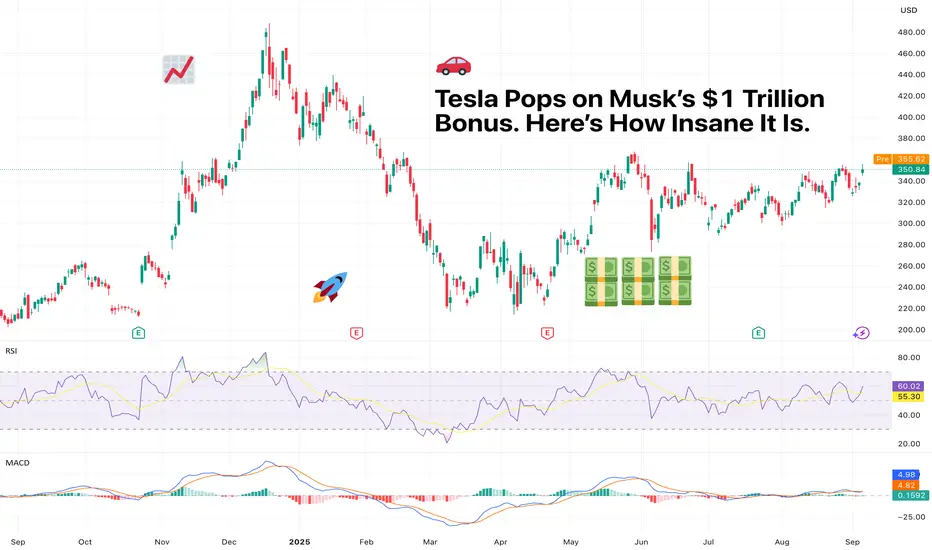
Tesla Pops on Musk’s $1 Trillion Bonus. Here’s How Insane It Is.The mother of all KPIs.
Elon Musk has a new carrot dangling in front of him, and it’s not a Mars colony or a flamethrower.
Tesla’s board is asking investors to approve a bonus so massive, so absurd, so galaxy-brained, that it makes past compensation packages look like pocket change.
Ready? We
NFP "Goldilocks" playbook? EURUSD triggers revealed!Markets are optimistic and consolidating ahead of the Non-Farm Payrolls (NFP) report, with EUR/USD poised for a breakout, plus a quick technical overview of gold, GBP/USD, and USD/JPY.
Mood : Buoyant—risk assets and equities are near weekly highs, bond yields are easing.
Consensus : A "Goldilocks

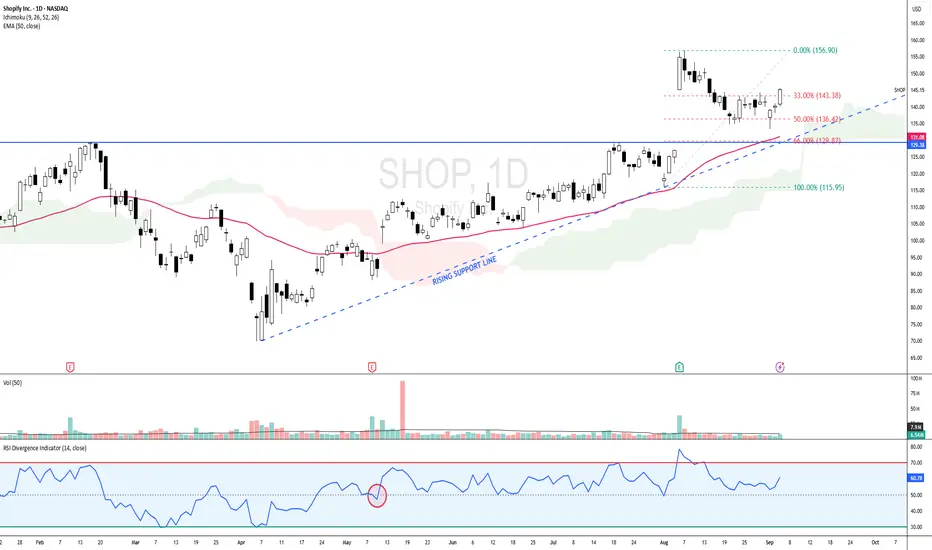
SHOP - BULLISH SCENARIO since 12 MAY 2025 SHOP - CURRENT PRICE : 145.15
SHOP is bullish as the share price is above 50-day EMA. Price action on 12 MAY 2025 is considered starting of bullish scenario because supported by several key indicators :
Share price gap up
Price broke out 50-day EMA
Price moving above ICHIMOKU CLOUD
RSI movin
TradingView Storytellers: Share Your Videos, Inspire TradersCalling all creators, chart wizards, and video storytellers.
👋 Hey traders !
We know many of you aren’t just analyzing the markets and trading — you’re teaching, creating, and inspiring others. We see you!
And now's your chance to get your content in the spotlight — share your best work with us
Bitcoin Rally Fades as Prices Nosedive. End of Bullish Cycle?Technical analysis will tell you that maybe it’s time for a pullback. But then again, this is crypto. It’s the wild west, where predictions are polite suggestions at best. Here’s what we know about where we are.
📉 Bitcoin Takes a Breather
Bitcoin BITSTAMP:BTCUSD started the week on a quieter n

Why Ethereum is Outperforming Bitcoin? | FX ResearchWhile Bitcoin did manage to push to a fresh record high, the broader august trend reflected cautious investor sentiment, supported by modest momentum and ongoing macro uncertainty. The narrative suggests price resilience, but without the forcefulness needed for the next wave of bullish momentum.
I

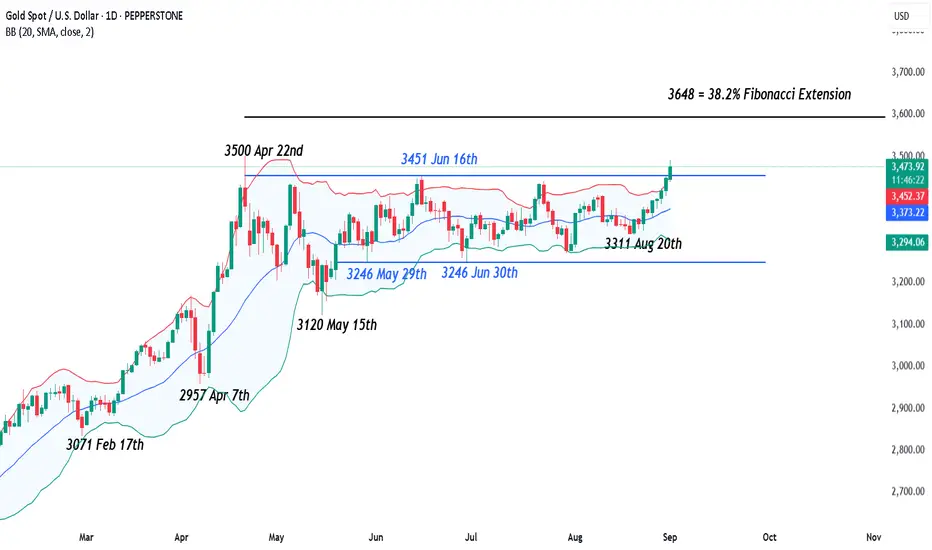
Gold – Breaking Out or Faking Out to Start September?Gold has been trading in a 3250-3450 range since the middle of May, but events last week saw prices test and close right at the top of that range on Friday. The drivers impacting this push higher in Gold, which could remain in play for traders in the first week of September, were numerous. These inc
See all editors' picks ideas
VWAP Price ChannelVWAP Price Channel cuts the crust off of a traditional price channel (Donchian Channel) by anchoring VWAPs at the highs and lows. By doing this, the flat levels, characteristic of traditional Donchian Channels, are no more!
Author's Note: This indicator is formed with no inherent use, and serves

Fibonacci Sequence Circles [BigBeluga]🔵 Overview
The Fibonacci Sequence Circles is a unique and visually intuitive indicator designed for the TradingView platform. It combines the principles of the Fibonacci sequence with geometric circles to help traders identify potential support and resistance levels, as well as price expansio

ATAI Volume Pressure Analyzer V 1.0 — Pure Up/DownATAI Volume Pressure Analyzer V 1.0 — Pure Up/Down
Overview
Volume is a foundational tool for understanding the supply–demand balance. Classic charts show only total volume and don’t tell us what portion came from buying (Up) versus selling (Down). The ATAI Volume Pressure Analyzer fills that g

Market Cap Landscape 3DHello, traders and creators! 👋
Market Cap Landscape 3D. This project is more than just a typical technical analysis tool; it's an exploration into what's possible when code meets artistry on the financial charts. It's a demonstration of how we can transcend flat, two-dimensional lines and step into

ZigzagLiteLibrary "ZigzagLite"
Lighter version of the Zigzag Library. Without indicators and sub-component divisions
method getPrices(pivots)
Gets the array of prices from array of Pivots
Namespace types: Pivot
Parameters:
pivots (Pivot ) : array array of Pivot objects
Returns: array array

ZigzagLibrary "Zigzag"
Zigzag related user defined types. Depends on DrawingTypes library for basic types
method tostring(this, sortKeys, sortOrder, includeKeys)
Converts ZigzagTypes/Pivot object to string representation
Namespace types: Pivot
Parameters:
this (Pivot) : ZigzagTypes/Pivot

Angled Volume Profile [Trendoscope]Volume profile is useful tool to understand the demand and supply zones on horizontal level. But, what if you want to measure the volume levels over trend line? In trending markets, the feature to measure volume over angled levels can be very useful for traders who use these measures. Here is an att

MathEasingFunctionsLibrary "MathEasingFunctions"
A collection of Easing functions.
Easing functions are commonly used for smoothing actions over time, They are used to smooth out the sharp edges
of a function and make it more pleasing to the eye, like for example the motion of a object through time.
Easing function

Treasury Yields Heatmap [By MUQWISHI]▋ INTRODUCTION :
The “Treasury Yields Heatmap” generates a dynamic heat map table, showing treasury yield bond values corresponding with dates. In the last column, it presents the status of the yield curve, discerning whether it’s in a normal, flat, or inverted configuration, which determined by us

Time & Sales (Tape) [By MUQWISHI]▋ INTRODUCTION :
The “Time and Sales” (Tape) indicator generates trade data, including time, direction, price, and volume for each executed trade on an exchange. This information is typically delivered in real-time on a tick-by-tick basis or lower timeframe, providing insights into the traded size

See all indicators and strategies
Community trends
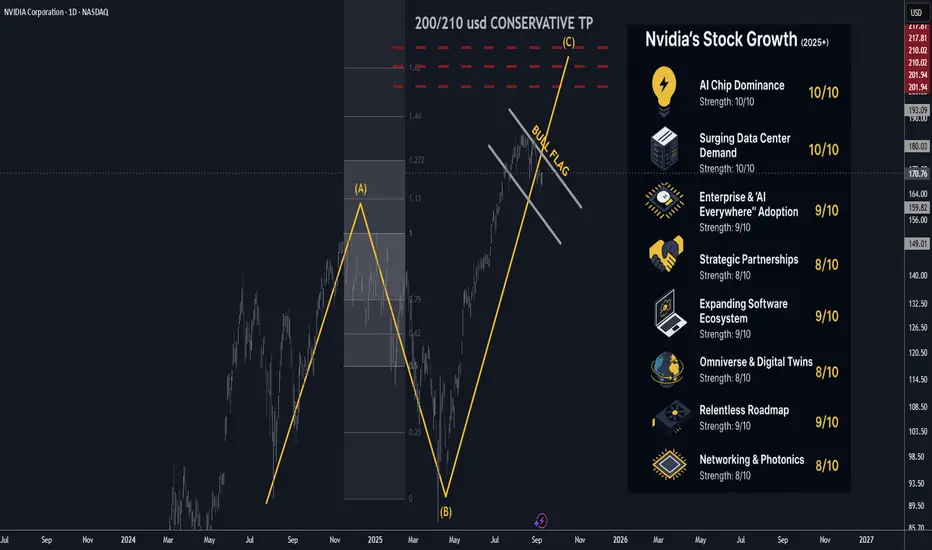
Nvidia (NVDA) 2025+ Catalysts Updated: Analyst Views September🚀 Nvidia (NVDA) 2025+ Catalysts & Risks: Analyst Views — Updated September 2025
________________________________________
📝 Summary Outlook (September 2025)
Nvidia remains at the center of the global AI boom, with dominant GPU share, a strengthening networking/software moat, and multi-year sovere
AAPL Eyes $300—Bullish Breakout in PlayAAPL Eyes $300—Bullish Breakout in Play
AAPL could reach $300 in the coming months.
Since our last update, the stock has climbed nearly 20%, rising from $200 to $240.
It recently broke out of a small triangle pattern, showing strong bullish momentum. This breakout suggests the rally may continu

IREN - BULLISH RISING WINDOW at ALL TIME HIGH ZONEIREN - CURRENT PRICE : 27.00 - 28.00
The stock is bullish as the share price is above 50-day SMA. This bullish scenario is strengthened by the rising support line. Yesterday the stock made a rising window with high trading activity - indicating bullish continuation trend.
In JAPANESE CANDLESTICK

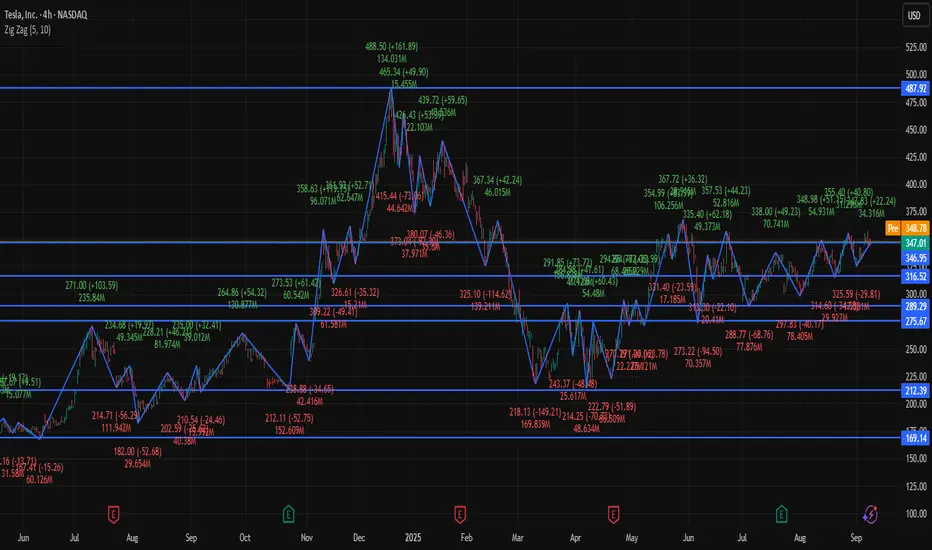
TSLA 4Hour Time frame 📊 Tesla (TSLA) Snapshot
Current Price: ~$346.97
Recent Range: ~$325 – $358
Intraday Change: Small gain (~+0.2%)
🔎 Key Levels (4H Focus)
Resistance: ~$347 – $351 (immediate ceiling)
Support: ~$325 – $330 (key downside buffer)
📉 Technical Indicators
RSI (14): ~57 → neutral with slight bullish
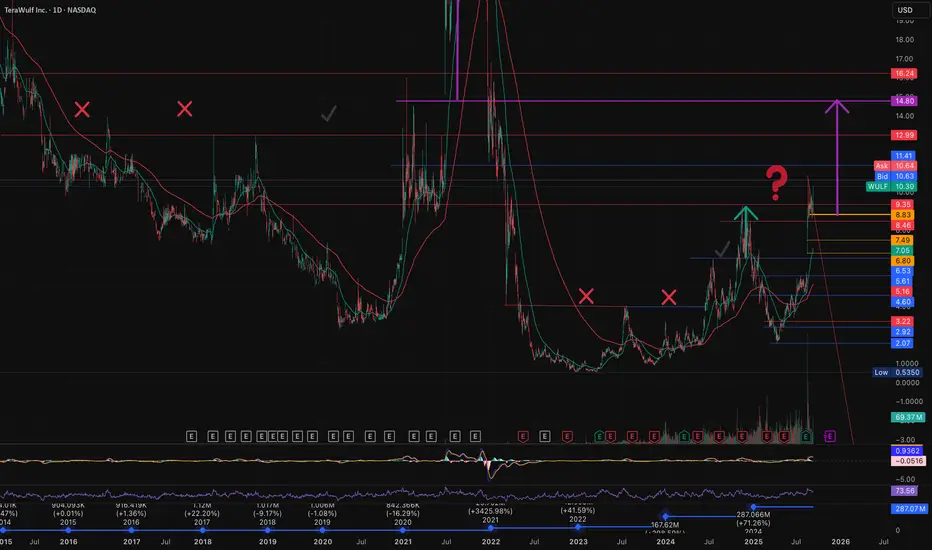
Cup&Handle on WULF pack for another 80% Over last 10years WULF formed at least 6 Cup&Handle patterns among which only Two attained successful results with 350% and 55% respectively to the up side, Four of the patterns were not successful and price headed downward or sideways.
When each of those patterns took One or Two years to complete,
Is Sofi about to pull of a Palantir to over $100 ?!🔹 Technical Structure
SoFi has built a multi-year rounded bottom base from $4.27 lows (2022–2023) to the $26 rim resistance (2025).
Pattern depth: ~$22.
Conservative measured move target: ~$48–50.
Supercycle stretch target: ~$100–150 (a repeat of the 500% magnitude move from the base, similar to Pal

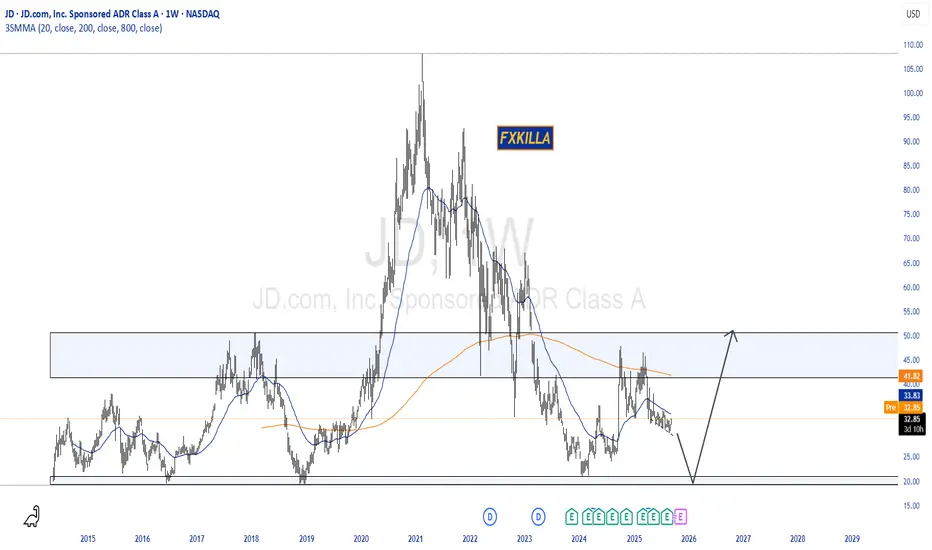
JD HIGH PROBABILITY SETUP SOON!!!🚨 JD HIGH PROBABILITY SELL/BUY SETUP 🚨
* Here We Can See Clearly The Next Potential Moves For JD Coming Hours/Days.
* Keep Your Eyes Close On Your Trading Positions.
* Happy PIP Hunting Traders.
FXKILLA.
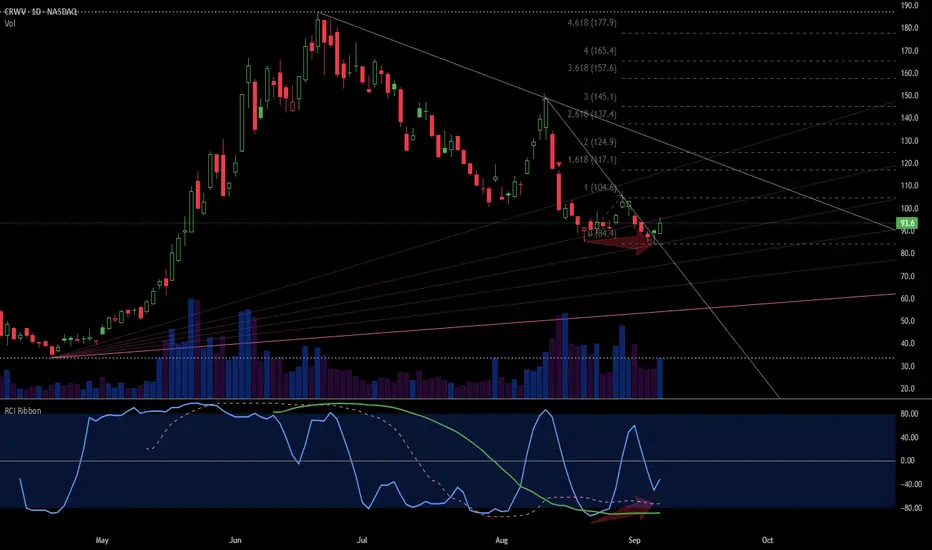
$CRWV: a classic "calm before the storm" setupThe prior markdown has been halted (Phase A), and now the stock is in a low-volatility consolidation range; an early Sign of Strength (SOS) could be forming.
Directional Bias: Neutral with a Tentative Bullish Tilt.
Target 1: $110.00
Target 2: $120.00
#RIOT and the miners pumping = AltseasonThe Bitcoin miners have quietly entered a Bull market since April, without much attention.
This indicates that investors are looking for additional risk beyond #BTC as they prepare for an exciting Altseason.
Their reasoning might arise from the perception that Bitcoin can provide only a limited re

ORCL - Clear Signs of TOO MUCH MONEY in the pipesI shorted this at 143. 70 PE, poor earnings report. Pie in the sky future guidance. Somehow, someway, this is going to end and it won't be pretty. Unfortunately, it might not happen in my lifetime, especially with the Fed poised to start cutting already low interest rates.
See all stocks ideas
Today
HOFTHooker Furnishings Corporation
Actual
—
Estimate
−0.12
USD
Today
KALVKalVista Pharmaceuticals, Inc.
Actual
—
Estimate
−0.95
USD
Today
LOVEThe Lovesac Company
Actual
—
Estimate
−0.71
USD
Today
TBHCThe Brand House Collective, Inc
Actual
—
Estimate
−0.70
USD
Today
LPTHLightPath Technologies, Inc.
Actual
—
Estimate
−0.04
USD
Today
KEQUKewaunee Scientific Corporation
Actual
—
Estimate
—
Today
HSCSHeartSciences Inc.
Actual
—
Estimate
−1.88
USD
Today
BNEDBarnes & Noble Education, Inc
Actual
—
Estimate
—
See more events
Community trends
BTC - Are the bulls looking for a liquidity grab?Market Context
Bitcoin is holding strong after bouncing from a higher support zone and is now pressing into an area packed with liquidity. The recent bullish price action has carved out multiple fair value gaps on the way up, each serving as confirmation of demand and strengthening the bullish stru

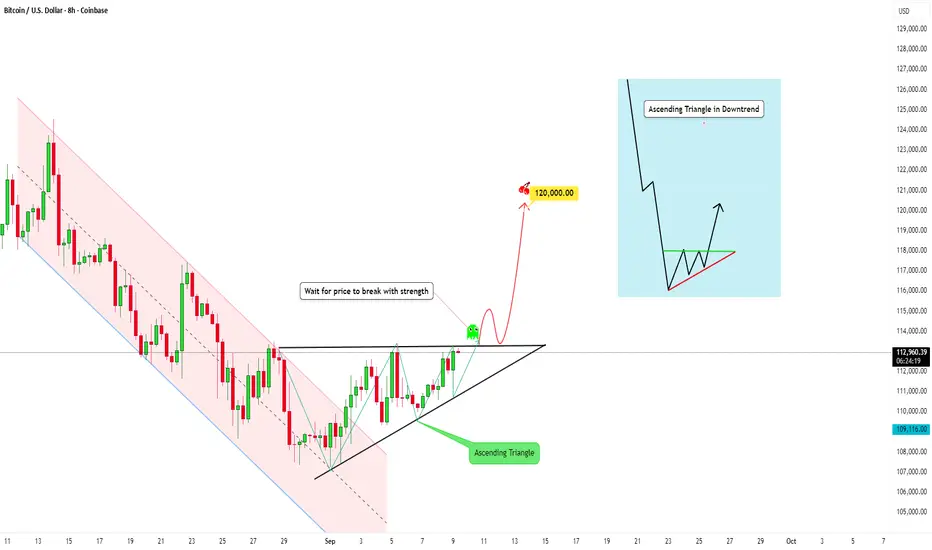
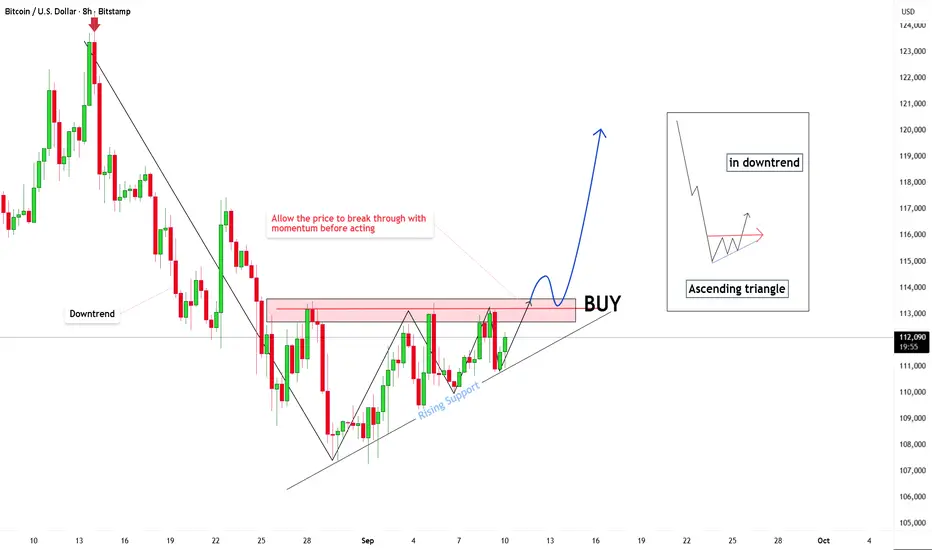
BTC has formed an Ascending Triangle in a DowntrendWhat is Happening Here?
If we take a look at Bitcoin, it's pretty interesting right now: we can observe an ascending triangle just formed. But this pattern took shape after a sharp drop in price.
An ascending triangle is a bullish continuation pattern:
- The resistance line stays horizontal (flat
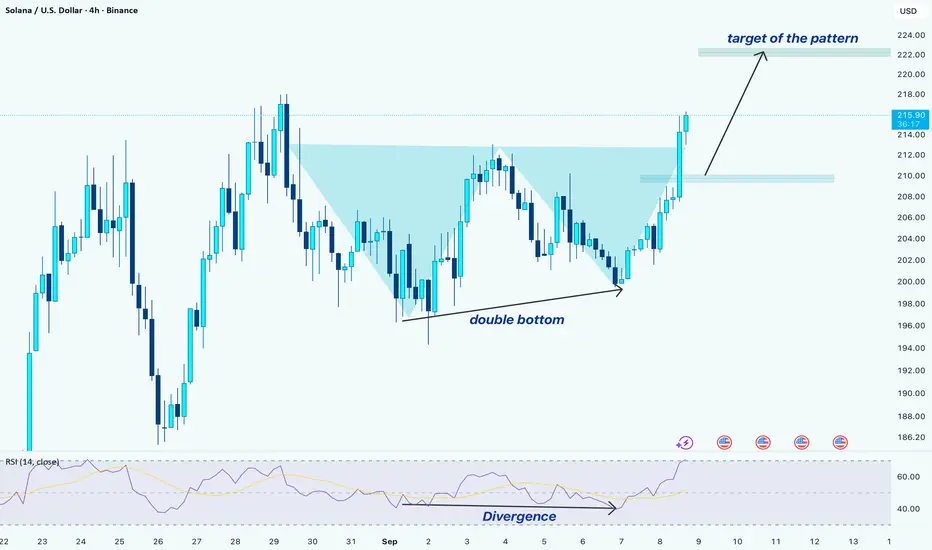
SOL/USDT –> Double Bottom Breakout with Bullish DivergenceHello guys!
Solana has completed a double bottom pattern and broken above the neckline, signaling bullish momentum. Here’s the breakdown:
1-Pattern Formation
A clear double bottom has formed around the $200 zone.
The neckline breakout happened at ~$213–214, confirming the reversal.
2- Moment
PPI Shock Pushes Bitcoin Higher – Fake Pump Before Drop?Bitcoin ( BINANCE:BTCUSDT ) has been making high momentum Sharpe moves over the last few days , which has made it a little difficult to trade, which is why I am still sticking to my previous analysis , and this analysis is an update of targets and even new entry points .
Bitcoin is current

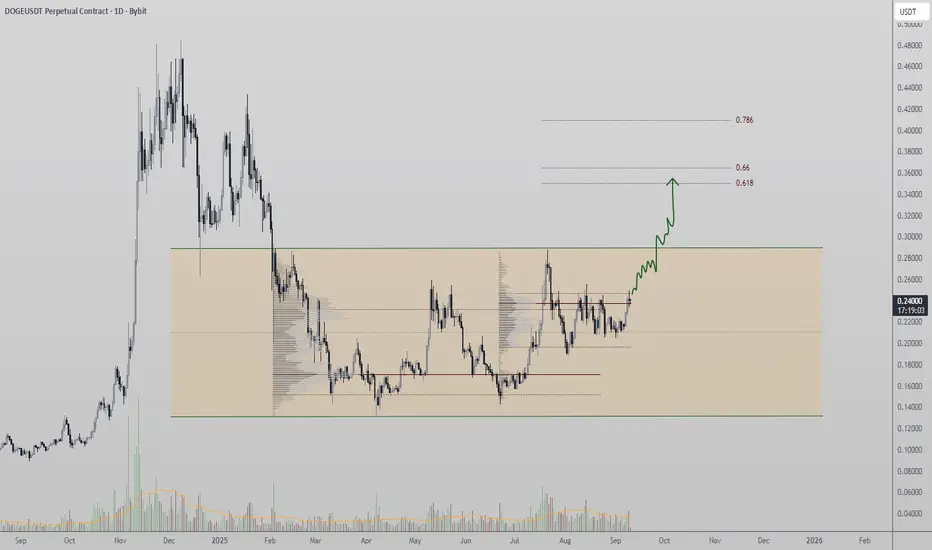
DOGE Retests Point of Control With Bullish ReactionDOGE is attempting to reclaim its local point of control, a major volume resistance. A close above this level with volume support could trigger upside continuation.
DOGE has shown a bullish reaction at the main trend point, with buyers stepping in to defend the structure. The key test now lies at t
Bitcoin - Important Breakout!Hello Traders!
The Bitcoin price failed to create a new lower low!
The market formed an ascending triangle pattern.
Currently, the resistance level is broken!
So, I expect a bullish move📈
TARGET 1: 116900🎯
TARGET 2: 119000🎯

Unlocking the Power of Ascending Triangles in Bitcoin Trading!Hello everyone! 👋
In this analysis, we will explore a popular technical pattern in Bitcoin trading called the Ascending Triangle 🔺 . This is a useful tool that helps us identify potential trading opportunities, especially when the market is in a consolidation phase. Let's dive deeper! 🚀
1. Ascen
BTC – Base Before Break?After the ATH at 125k on 25 Aug, BTC pulled back to 107k and has been consolidating. The latest structure looks more like a base for reversal than a continuation pattern: price is back into the 113.3k zone, which coincides with resistance, and we’ve printed a sequence of higher lows—a classic pressu

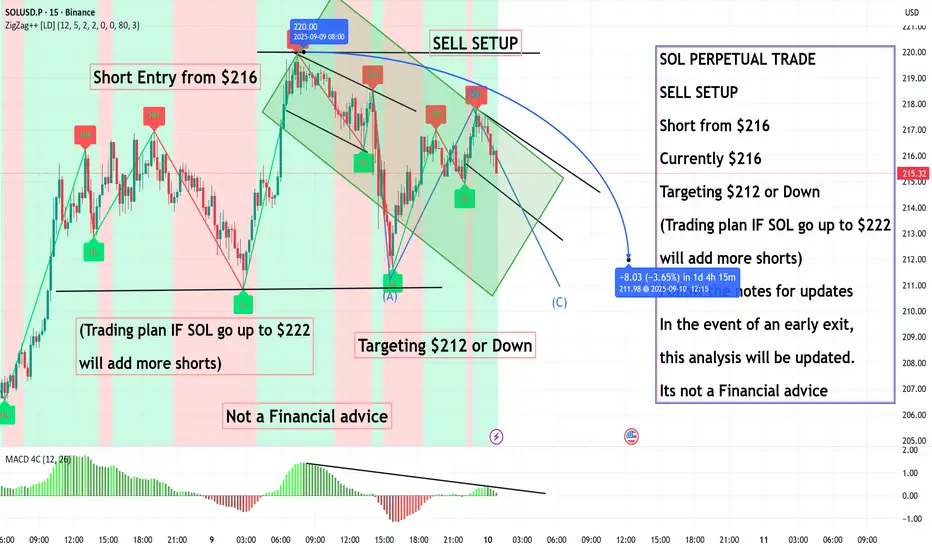
SOL PERPETUAL TRADE SELL SETUP Short from $216SOL PERPETUAL TRADE
SELL SETUP
Short from $216
Currently $216
Targeting $212 or Down
(Trading plan IF SOL go up to $222
will add more shorts)
Follow the notes for updates
In the event of an early exit,
this analysis will be updated.
Its not a Financial advice
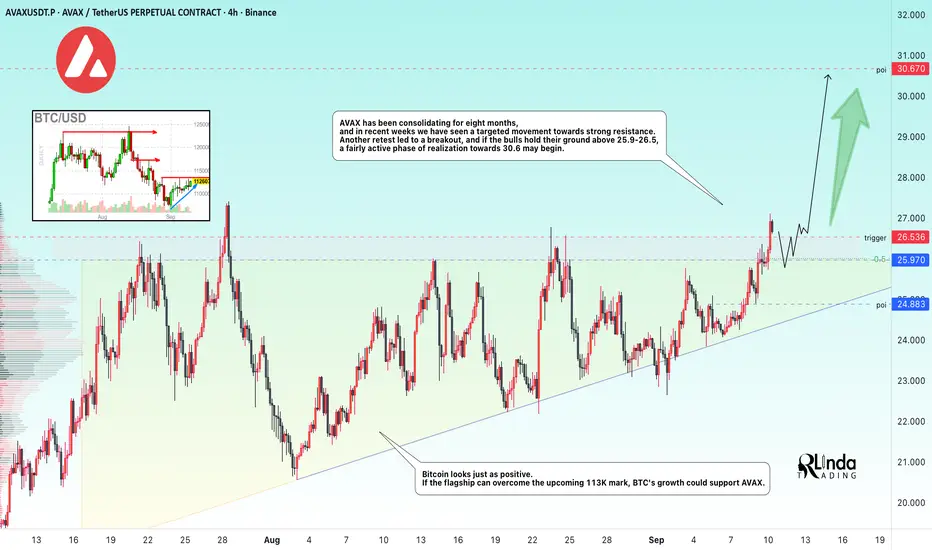
AVAXUSDT → Distribution of 8-month accumulationBINANCE:AVAXUSDT is testing the resistance of an 8-month consolidation. The market is showing positive signs that may indicate a possible rally...
Bitcoin looks positive. If the flagship can overcome the upcoming 113K mark, BTC's growth could support altcoins, including Avalanche.
AVAX has bee
See all crypto ideas
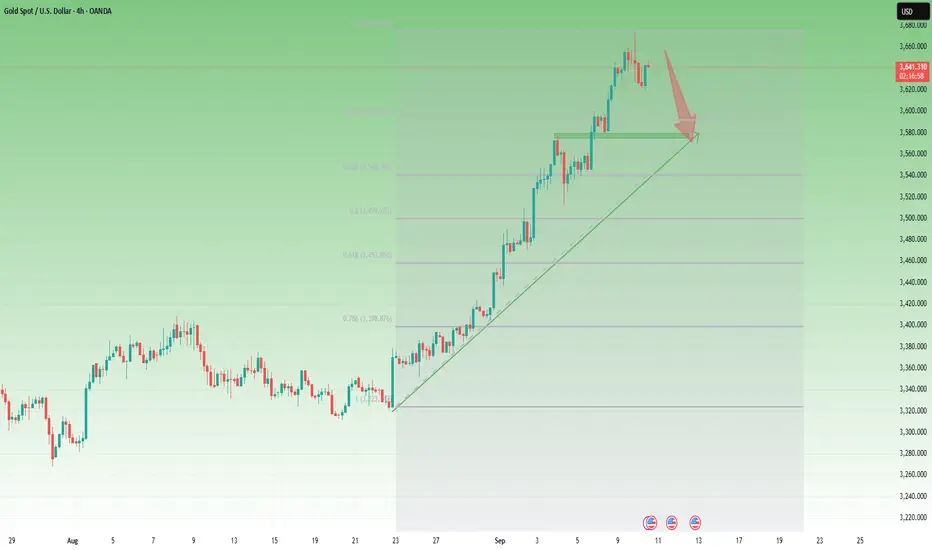
GOLD → Consolidation before continued growth FX:XAUUSD is undergoing a correction amid revised unemployment data, but this has not disrupted the overall technical situation. The market is still anticipating an aggressive reduction in interest rates...
The price resumed its growth on Wednesday amid escalating geopolitical tensions and a w

GOLD: Israeli Airstrike Hits Hamas leaders in QatarGOLD: Israeli Airstrike Hits Hamas leaders in Qatar
🚨 Breaking NEWS:
Several blasts heard in Qatar’s capital after Israeli airstrike on Hamas leadership
The Israel Defence Forces (IDF) said it had carried out a targeted attack on Hamas officials, shortly after the militant group claimed responsi

Gold Pushing Higher!Price pushed in a clear ascending channel. It broke above the most recent resistance, then came back to retest the level. Classic break and retest.
Price rejected off that level, which turned it into new support. That’s a good signal to go long, targeting the top of the projected channel.

Gold 30Min Engaged ( Buy And sell Entry Detected )Time Frame: 30-Minute Warfare
Entry Protocol: Only after volume-verified breakout
🩸Bearish After Break : 3635
🩸Bullish Reversal : 3595
➗ Hanzo Protocol: Volume-Tiered Entry Authority
➕ Zone Activated: Dynamic market pressure detected.
The level isn’t just price — it’s a memory of where they moved

Gold Promises New Highs👋Hello everyone, what are your thoughts on OANDA:XAUUSD ?
Today, gold continues to hold a strong bullish trend, currently trading around 3,630 USD with a short-term pullback serving as momentum for the next move.
The key support zone is located around 3,600 – 3,580 USD. If this level holds, the

Gold Analysis – Correction Not Yet Over (IMO)Yesterday, after printing a new ATH at 3674, Gold sold off aggressively and overnight reached a low of 3620.
Now the key question: Is Gold done correcting?
👉 My answer: Not yet.
Here’s why:
1. The 550 pip drop from the top is barely scratching the surface compared to the 3500 pip rally in t
Another bullish move goldThis is a Gold Spot vs U.S. Dollar (XAU/USD) chart on the 1-hour timeframe from OANDA. At the current moment, the gold price is trading around $3,657.19, showing a gain of +21.345 points (+0.59%).
The chart highlights a bullish momentum, with the price consistently forming higher highs and higher l

GOLD WEEKLY CHART MID/LONG TERM ROUTE MAPWeekly Chart Update
Please see update on our weekly chart idea.
Sunday we stated that we had the weekly body close above the channel top at 3576 and now opened the door to the larger 3659 long-term gap target.
- this target is now complete
We will now look for a close above 3659 for a continu

XAUUSD Explodes: Strong Uptrend and Breakout OpportunityCurrently, XAUUSD is moving within a clear rising channel on the 2-hour chart. The bullish momentum of gold remains very strong, and we can see that the price is continuously breaking higher highs, pushing the trend upwards. However, it is important to note that the market is awaiting important

DeGRAM | GOLD rebounded from the support area📊 Technical Analysis
● XAU/USD staged a bullish takeover at 3,636 support, reclaiming the mid-range and establishing a higher low.
● Price is now pressing 3,650, with projections showing a push toward 3,654 before testing the 3,668–3,672 resistance area.
💡 Fundamental Analysis
● Gold demand is

See all futures ideas
AUD/USD - Bullish Channel (10.09.2025) The AUD/USD pair on the M30 timeframe presents a Potential Buying Opportunity due to a recent Formation of a Bullish Channel Pattern.
This suggests a shift in momentum towards the upside and a higher likelihood of further advances in the coming hours.
Possible Long Trade:
Entry: Consider Enter

EURUSDHello Hello Traders! 👋
What are your thoughts on EURUSD?
EUR/USD has been trapped in a sideways range for the past few weeks, showing choppy back-and-forth movements.
However, the recent break above the descending trendline suggests that a potential bullish breakout could be underway.
After some s

EURUSD - The Heat Is Still OnHello everyone, what do you think about the trend of FX:EURUSD ?
Today, EUR/USD is experiencing a slight pullback, currently hovering around the 1.169 level after approaching the resistance at 1.177. The first target is aimed at the support zone near 1.163, following a violation below the two EM

Lingrid | AUDUSD Major Resistance Short - Monthly LevelThe price perfectly fulfilled my previous idea . FX:AUDUSD has rallied strongly from the double-bottom formation near 0.6460 and is now testing the resistance zone around 0.6627. The market structure shows bullish momentum fueled by a breakout from the triangle pattern, lifting price toward prior

EUR/USD – Buyers Holding the Mid-Channel SupportHello guys!
EUR/USD is still moving inside a clean ascending channel on the 4H chart. Price just bounced off the 1.1690–1.1700 support zone, which also lines up with the channel’s midline; a pretty solid area for buyers to step in.
As long as this zone holds, the bias stays bullish. If momentum co

EURUSD: Price Exit from Triangle and Start FallHello everyone, here is my breakdown of the current Euro setup.
Market Analysis
From a broader perspective, EURUSD has been in a prolonged consolidation phase, forming a large symmetrical triangle. The price has been coiling between the major Support zone around the 1.1580 level and the key Res

EURUSD Pullback Toward 1.16700 as DXY Nears Key ResistanceHey Traders, in today's trading session we are monitoring EURUSD for a buying opportunity around the 1.16700 zone. The pair is trading in an uptrend, with price currently correcting toward this key support/resistance level.
Structure: The broader bias remains bullish, but price is retracing after r

EURUSD Short: Price Reverse and Start FallHello, traders! The price auction for EURUSD has been operating within a well-defined ascending channel for several weeks. This bullish structure has been confirmed by multiple pivot points, with buyers defending the ascending demand line and sellers consistently emerging at the upper supply zone ne

Waiting for a signal above 1.172, EURUSD ready to break outHello everyone,
On H1, EURUSD recently dropped to 1.169 before bouncing back with a long lower wick – a sign that buying support is still present. Price is now pressing the Ichimoku cloud edge, near the 1.170–1.171 balance zone. Above, there is a layered FVG supply from 1.172 → 1.176–1.178; below

NZDCAD: Short-Term Trading SetupNZDCAD: Short-Term Trading Setup
NZDCAD created a new price high indicating for a growth on the bullish momentum.
We are looking at for a short term bullish movement given that the trend is bullish since Friday.
The previous candles are all green and the breakuot should support further.
Key Targ

See all forex ideas
| - | - | - | - | - | - | - | ||
| - | - | - | - | - | - | - | ||
| - | - | - | - | - | - | - | ||
| - | - | - | - | - | - | - | ||
| - | - | - | - | - | - | - | ||
| - | - | - | - | - | - | - | ||
| - | - | - | - | - | - | - | ||
| - | - | - | - | - | - | - |
Trade directly on the supercharts through our supported, fully-verified and user-reviewed brokers.


