Silver just hit a record high but a double‑top signals pullback!After a strong rally to new records spurred by safe-haven demand and new entrants, silver is now testing critical support levels near $47‑$48 amid the recent Gaza ceasefire news, forming a classic double‑top pattern that may turn into a long-term Cup & Handle that could place price action in a handl

The best trades require research, then commitment.
Get started for free$0 forever, no credit card needed

Scott "Kidd" PoteetThe unlikely astronaut

Where the world does markets
Join 100 million traders and investors taking the future into their own hands.
Major indices

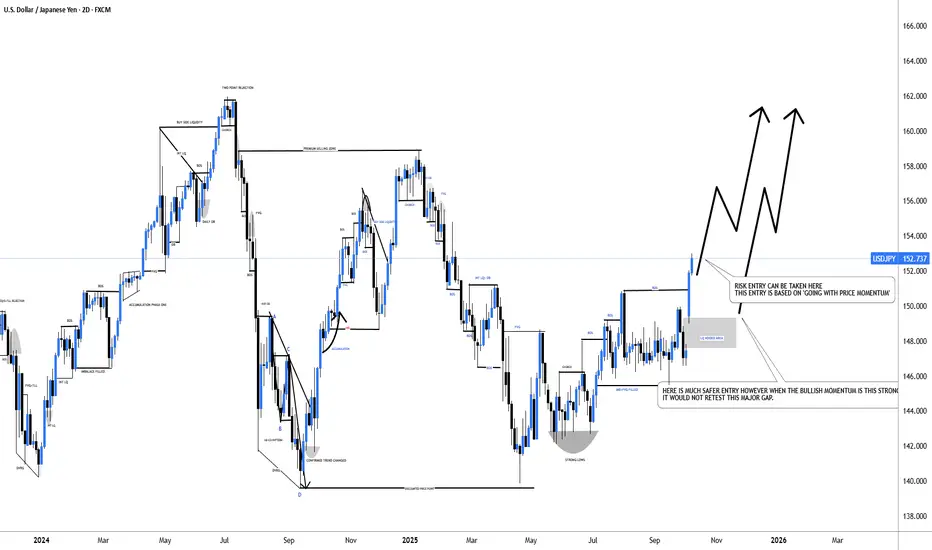
#USDJPY: From +1100 Pips To +1350 Pips A Possible Swing BuyDear Traders,
I hope you’re all having a great trading week!
The USDJPY is currently trading in a 152 price range and is experiencing extreme bullish momentum. The price is rallying without making any corrections, primarily due to the collapse of the Yen. We may see it fall further below. Given th
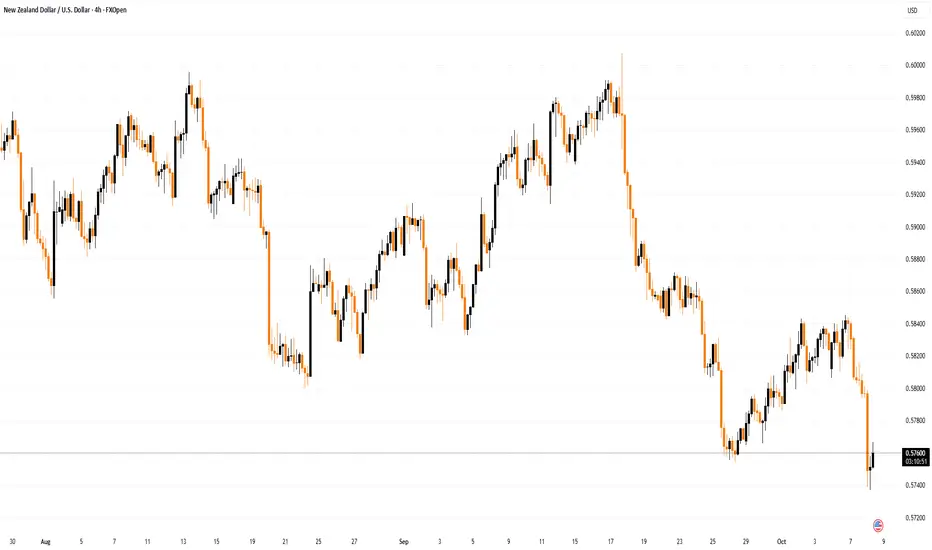
NZD/USD Rate Drops Sharply After Central Bank DecisionNZD/USD Rate Drops Sharply After Central Bank Decision
This morning, the Reserve Bank of New Zealand (RBNZ) cut its key interest rate. According to Forex Factory, the Official Cash Rate was reduced by 50 basis points from 3.0% to 2.5%, while most analysts had expected a smaller cut to 2.75%.
More
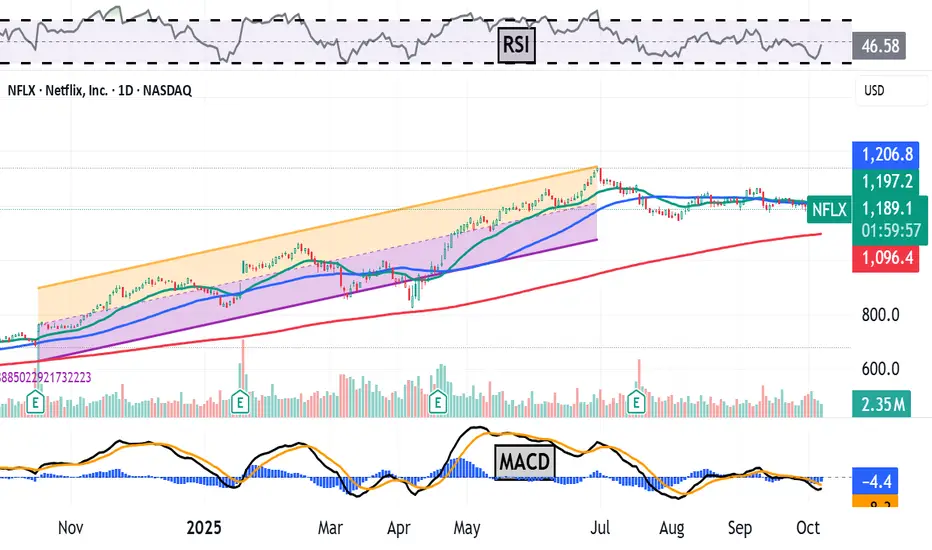
Netflix Is -11% Since June's All-Time High. What Its Chart SaysNetflix NASDAQ:NFLX has fallen more than 10% since hitting an all-time high in June, but the streaming giant is still beating the S&P 500 SP:SPX in the year-to-date, one-year and five-year periods. What does technical and fundamental analysis say is going on?
Let's take a look:
Netflix's Fund
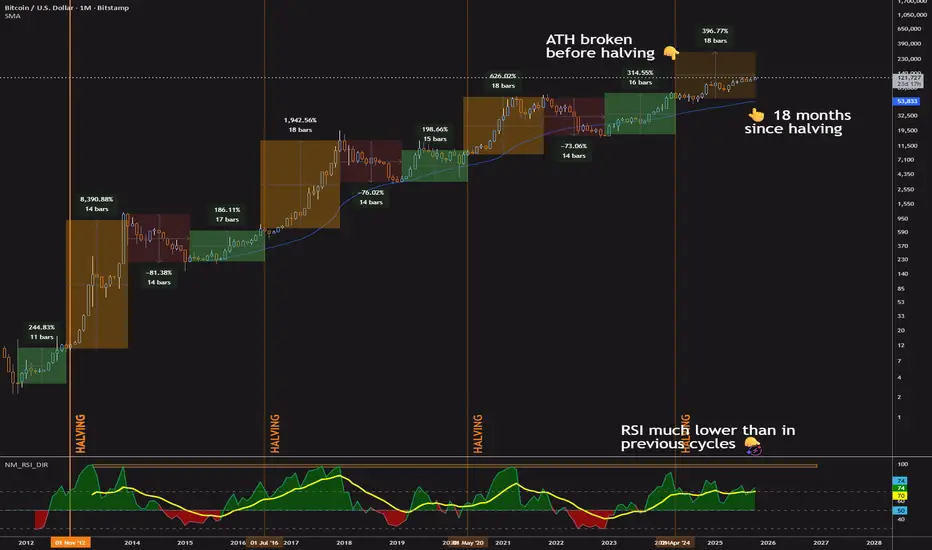
Is Bitcoin's 4-Year Cycle Over? Bitcoin’s 4-year cycle has been a go-to for traders, driven by halving events that spark price surges, sharp corrections, and recovery periods. But something’s off this time.
We’re 18 months into the post-2024 halving rally—hitting the historical peak for bull runs—yet there’s no sign of a crash,
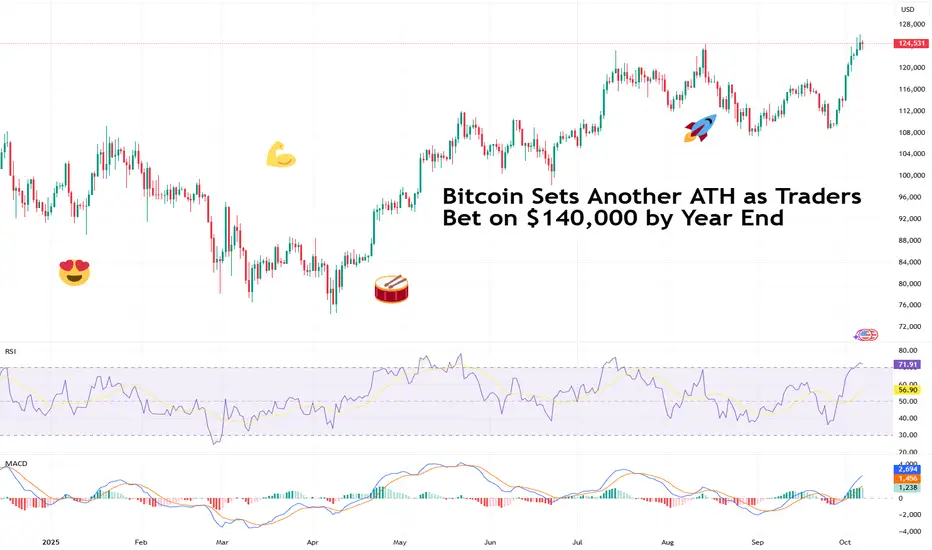
Bitcoin Sets Another ATH as Traders Bet on $140,000 by Year EndBlink and you’ll miss it. Bitcoin’s recent leg up caught lots of traders unprepared. After sinking below $110,000 few weeks back, the OG coin slingshotted to a fresh record high above $126,000 this week. Not a bad way to start October Uptober .
Now, traders are adding to bets that the price will
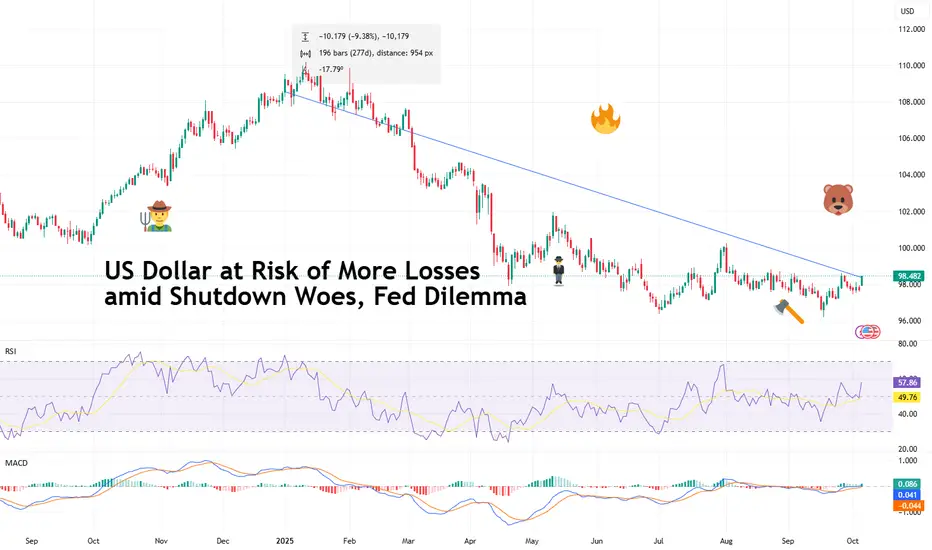
US Dollar at Risk of More Losses amid Shutdown Woes, Fed DilemmaThe US dollar TVC:DXY has been knocked by last week’s US government shutdown and the subsequent economic blackout. At the same time, the Federal Reserve can’t figure out what’s worse – inflation or job crunch.
After Congress failed to pass a funding bill, the government officially went dark at
Retro Editors' picks 2024Closing our retro EP selection , we present to you the last collection of additional scripts that have earned a spot in our Editors' picks, in this case from 2024.
These retrospective selections reflect our continued commitment to honoring outstanding contributions in our community, regardless of

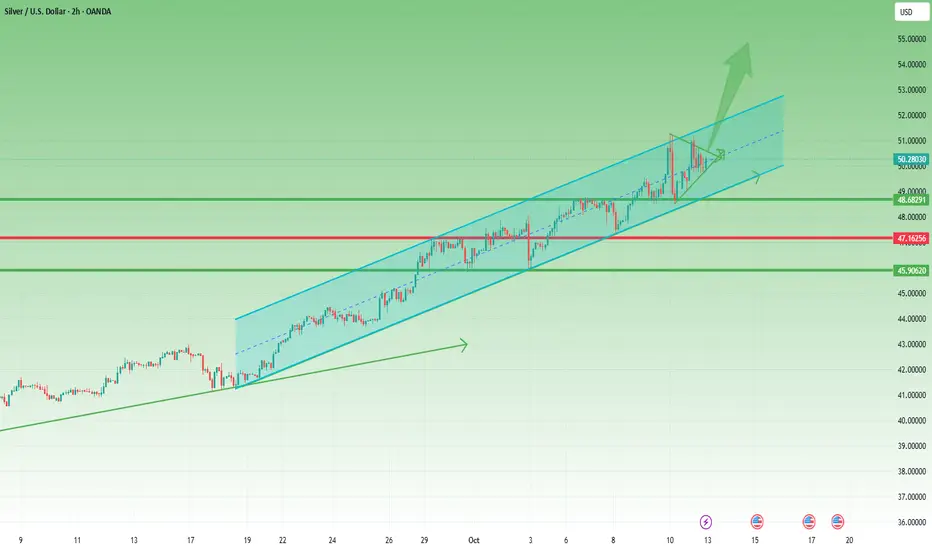
SILVER (XAG/USD): One More Bullish Wave is Coming?!⚠️ SILVER appears to be confined within a horizontal range, as observed on the 4-hour chart. The price is currently nearing the upper limit of this range.
Given the prevailing strong bullish trend, there is a considerable likelihood of a continued upward movement.
A breakout and a 4-hour candle cl

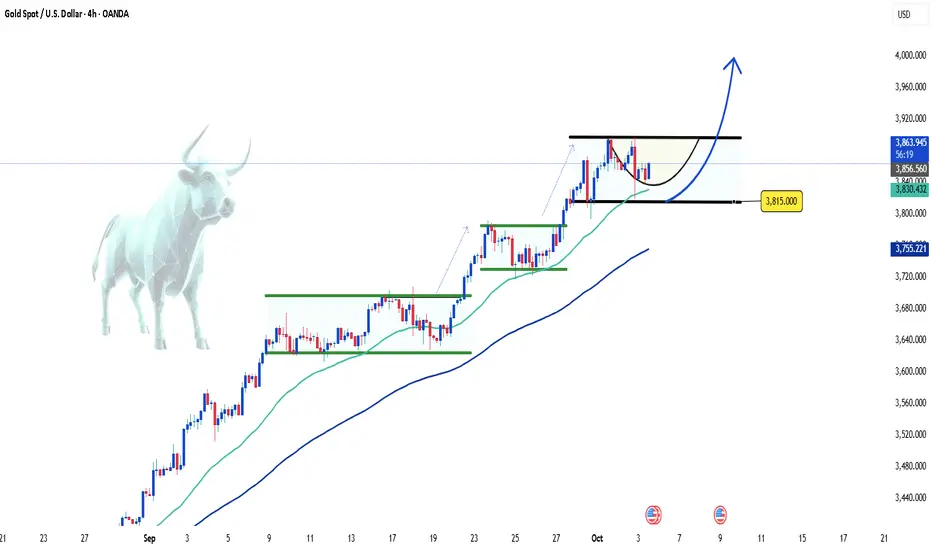
Gold Continues to Challenge Record Resistance Levels👋Hello everyone, what are your thoughts on OANDA:XAUUSD ?
As of this writing, gold continues its upward momentum, having reached new highs as investors increase their bets on the Federal Reserve cutting interest rates in the near future. The concerns over the U.S. government shutdown and global e
See all editors' picks ideas
Dynamic Equity Allocation Model"Cash is Trash"? Not Always. Here's Why Science Beats Guesswork.
Every retail trader knows the frustration: you draw support and resistance lines, you spot patterns, you follow market gurus on social media—and still, when the next bear market hits, your portfolio bleeds red. Meanwhile, institution

First Passage Time - Distribution AnalysisThe First Passage Time (FPT) Distribution Analysis indicator is a sophisticated probabilistic tool that answers one of the most critical questions in trading: "How long will it take for price to reach my target, and what are the odds of getting there first?"
Unlike traditional technical indicators

PongExperience PONG! The classic arcade game, now on your charts!
With this indicator, you can finally achieve your lifelong dream of beating the Markets. . . at PONG!
Pong is jam-packed with features! Such as:
2 Paddles
A moving dot
Floating numbers
The idea of a net
This indicator is solel

Options Max Pain Calculator [BackQuant]Options Max Pain Calculator
A visualization tool that models option expiry dynamics by calculating "max pain" levels, displaying synthetic open interest curves, gamma exposure profiles, and pin-risk zones to help identify where market makers have the least payout exposure.
What is Max Pain?
Max

Volume Profile 3D (Zeiierman)█ Overview
Volume Profile 3D (Zeiierman) is a next-generation volume profile that renders market participation as a 3D-style profile directly on your chart. Instead of flat histograms, you get a depth-aware profile with parallax, gradient transparency, and bull/bear separation, so you can see w

RiskMetrics█ OVERVIEW
This library is a tool for Pine programmers that provides functions for calculating risk-adjusted performance metrics on periodic price returns. The calculations used by this library's functions closely mirror those the Broker Emulator uses to calculate strategy performance metrics (

Simple Decesion Matrix Classification Algorithm [SS]Hello everyone,
It has been a while since I posted an indicator, so thought I would share this project I did for fun.
This indicator is an attempt to develop a pseudo Random Forest classification decision matrix model for Pinescript.
This is not a full, robust Random Forest model by any stretch o

Tick CVD [Kioseff Trading]Hello!
This script "Tick CVD" employs live tick data to calculate CVD and volume delta! No tick chart required.
Features
Live price ticks are recorded
CVD calculated using live ticks
Delta calculated using live ticks
Tick-based HMA, WMA, EMA, or SMA for CVD and price
Key tick levels (S

analytics_tablesLibrary "analytics_tables"
📝 Description
This library provides the implementation of several performance-related statistics and metrics, presented in the form of tables.
The metrics shown in the afforementioned tables where developed during the past years of my in-depth analalysis of various str

Adaptive Trend Classification: Moving Averages [InvestorUnknown]Adaptive Trend Classification: Moving Averages
Overview
The Adaptive Trend Classification (ATC) Moving Averages indicator is a robust and adaptable investing tool designed to provide dynamic signals based on various types of moving averages and their lengths. This indicator incorporates multipl

See all indicators and strategies
Community trends
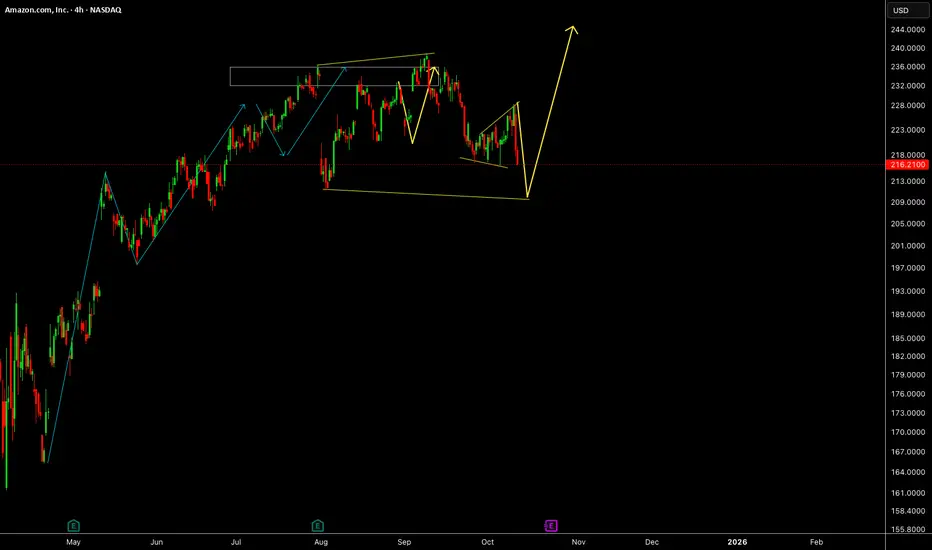
AmazonAmazon has given us small push up but slow last week, we will expect some more drop this week before a major push up.
Disclosure: We are part of Trade Nation's Influencer program and receive a monthly fee for using their TradingView charts in our analysis.
RIOT: Beginning of the end or not done with bull market yet?RIOT Platforms bull run has been an amazing one in 2025. Almost 300% in 6 months. Now markets are at a juncture of conflicting macro events that will shape the direction for the next move in a few weeks. Friday was particularly a bad day, and one for the history books for crypto.
For RIOT, we stil

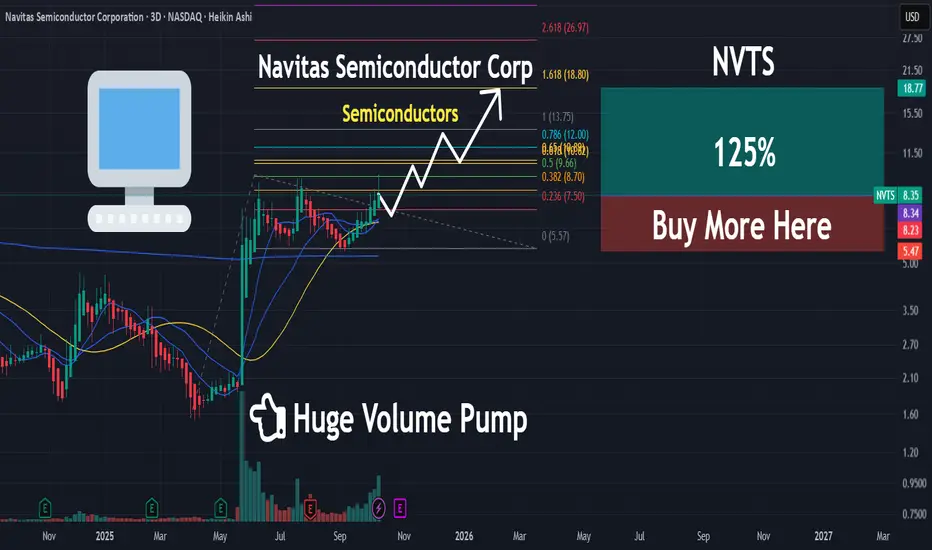
NVTS | The Next Semi To Run HARD | LONGNavitas Semiconductor Corp. engages in the development of ultra-efficient gallium nitride (GaN) semiconductors. Its GaN power ICs integrate GaN power with drive, control and protection to enable charging, power density, and energy savings for mobile, consumer, enterprise, eMobility and new energy ma
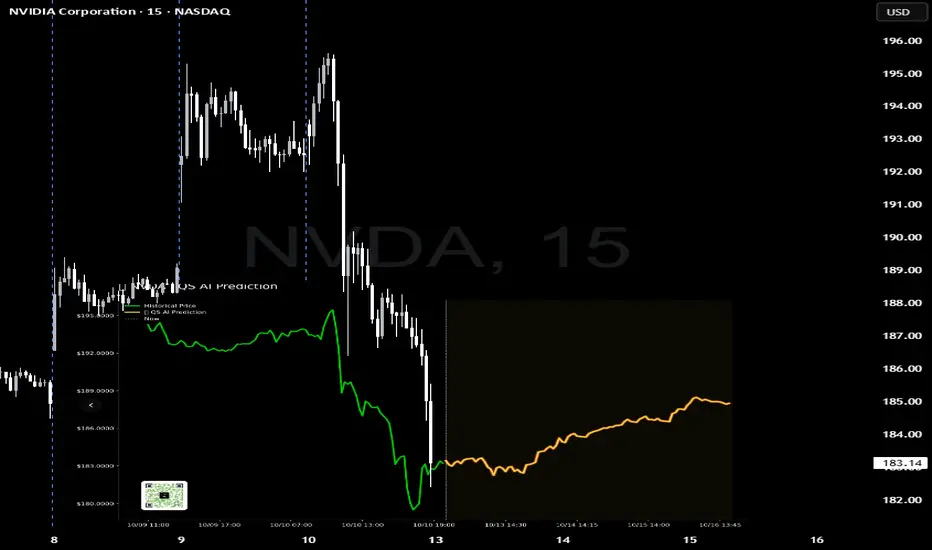
NVDA QuantSignals V3 Weekly 2025-10-11Trade Recommendation for NVidia (NVDA)
Direction: BUY PUTS Confidence: 40% (Below Minimum Threshold) Conviction: HIGHLY SPECULATIVE
Analysis Summary:
Katy AI Signal: Neutral with low confidence (50%). Weekly Momentum: Bearish (negative performance in the past week). Other Factors: Slightly more p
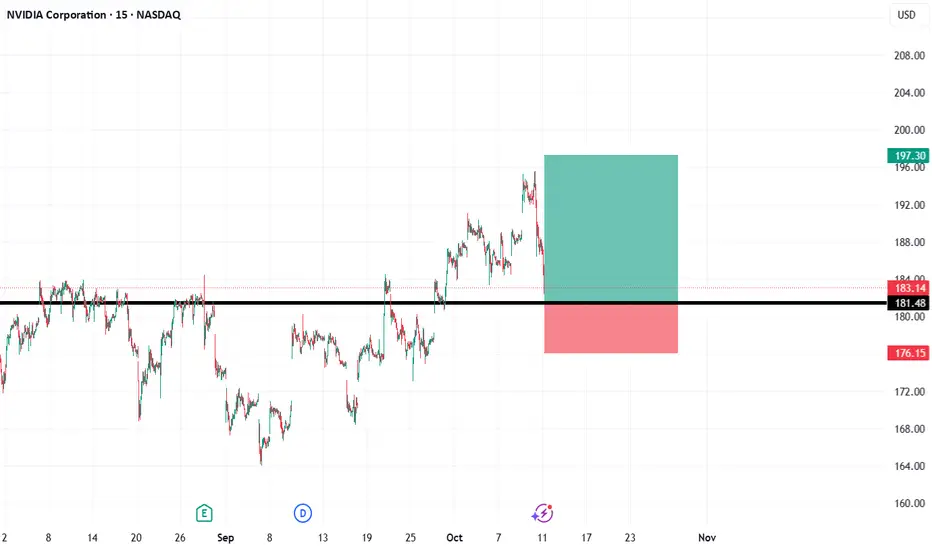
NVDA Long Setup: Retest of Former Resistance as SupportHello TradingView Community,
This post outlines a potential long trade setup for NVIDIA Corporation (NVDA) on the 15-minute chart.
Technical Analysis:
The chart highlights a key horizontal price level at approximately $181.48. This level previously acted as a significant resistance, capping the pric
MSTR It almost looks similar as past movements. 285 was expected and came yesterday.
In November and December MSTR will go up and upper. It completed correction and I am waiting Long on it.

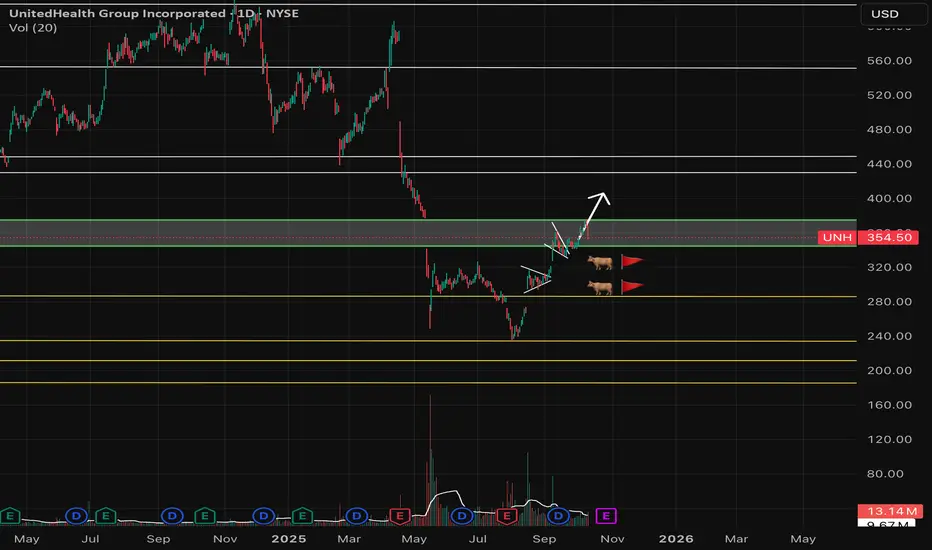
$UNH has nothing to do with China-US trade war.- NYSE:UNH has nothing to do with China-US trade war because all of its business is in US.
- Companies which will get hurt by China - US tensions would be MNCs ( multi national companies) , Chips related companies, Retail like clothing, beauty products and some healthcare which get raw materials
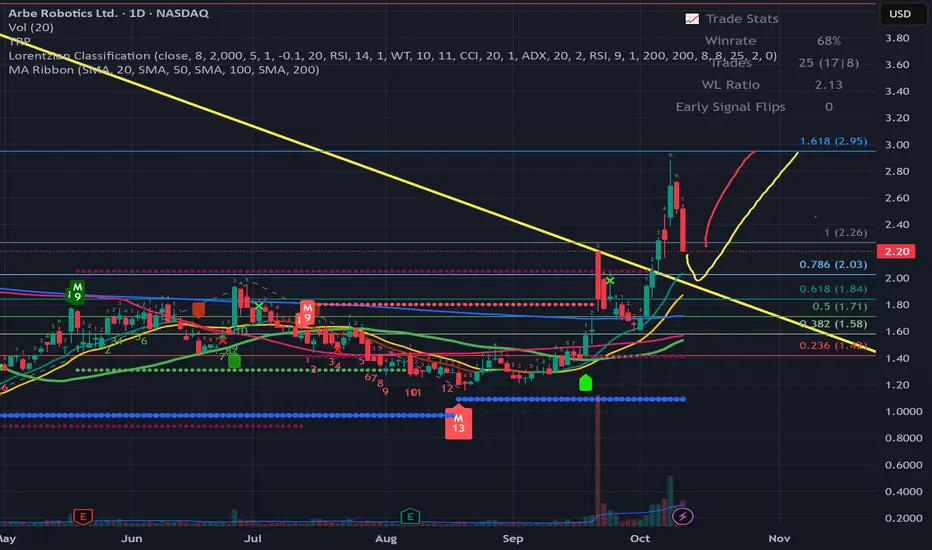
ARBE - Can we consider as Pull-back or not?Hello Everyone, Followers
I am planning to share some Analysis today that i see , they could be a good opportunity for next week and coming weeks. We need to closely watch Trump v2.0 Tariffs of course. But I believe there will be really good opportunities following weeks.
So first one - ARBE Robo
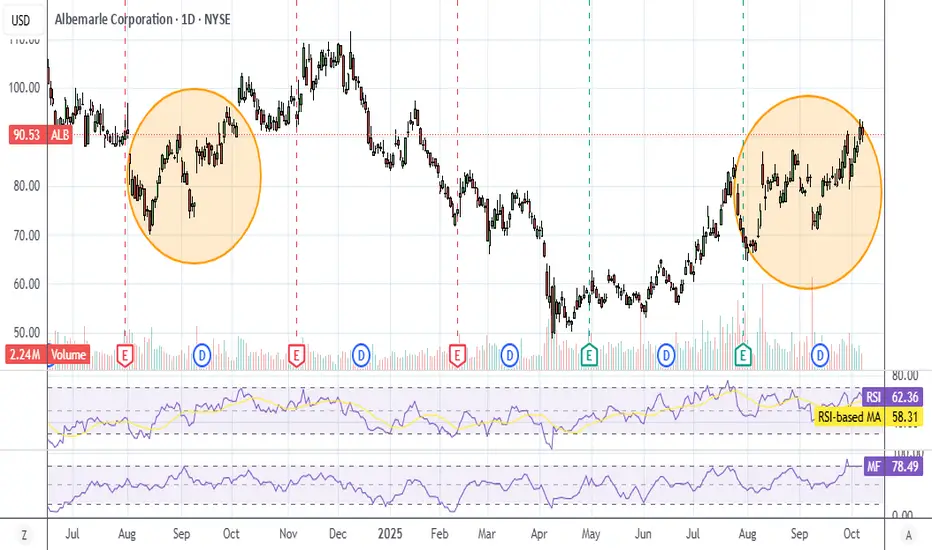
ALB Repeat of last year?ALB chart pattern is almost identical to last year, even more so than XLF because it's at the same price level as last year. Just keep in mind Nov pump was elections last year.
We could also get a big gap up Monday if they compromise on the Fed shutdown.
Not a stock I would hold long term, but in
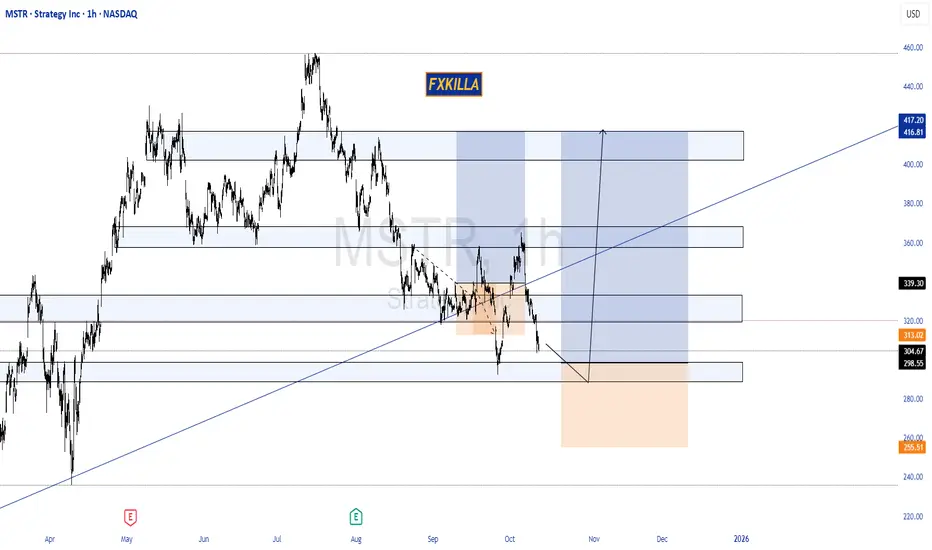
MSTR HIGH PROBABILITY SETUP SOON!!!🚨 MSTR HIGH PROBABILITY BUY SETUP 🚨
* Here We Can See Clearly The Next Potential Move For MSTR Coming Hours/Days.
* Keep Your Eyes Close On Your Trading Positions.
* Happy PIP Hunting Traders.
FXKILLA.
See all stocks ideas
Tomorrow
FASTFastenal Company
Actual
—
Estimate
0.30
USD
Tomorrow
UNTYUnity Bancorp, Inc.
Actual
—
Estimate
1.29
USD
Tomorrow
LFCRLifecore Biomedical, Inc.
Actual
—
Estimate
−0.31
USD
Tomorrow
CMTLComtech Telecommunications Corp.
Actual
—
Estimate
−0.75
USD
Tomorrow
GMGIGolden Matrix Group, Inc.
Actual
—
Estimate
−0.00
USD
Tomorrow
VFSVinFast Auto Ltd.
Actual
—
Estimate
−0.26
USD
Tomorrow
WAFDWaFd, Inc.
Actual
—
Estimate
0.77
USD
Tomorrow
CCELCryo-Cell International, Inc.
Actual
—
Estimate
−0.03
USD
See more events
Community trends
BITCOIN AND CRYPTO RUG PULL, HERE IS THE REAL REASON WHY!In the 1-hour time period, all altcoins and Bitcoin crashed on Friday afternoon/night! The real reason behind this crash is in this article. The vast majority of traders on the futures market got liquidated with a very low leverage of 2x or more.
If you still believe in Democrats and their controll
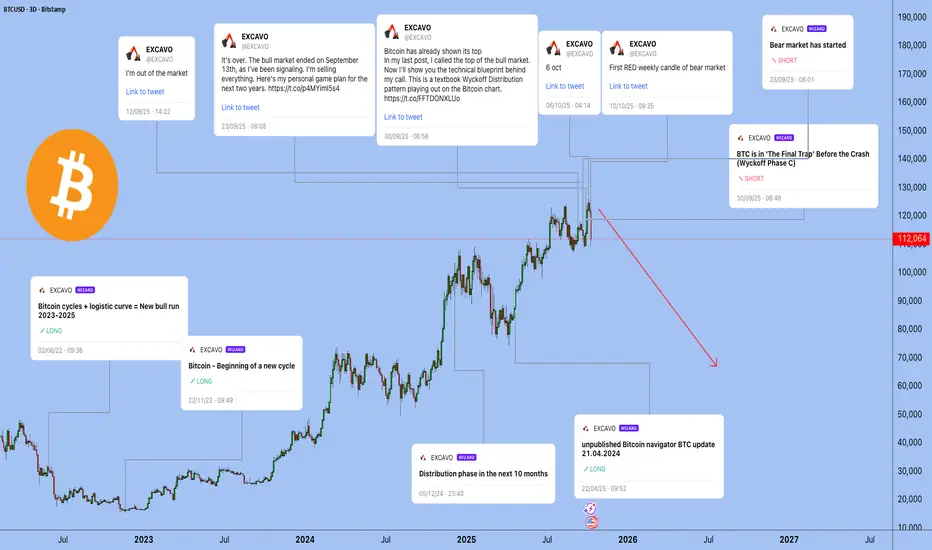
Today's Crypto Slaughter 11.10.2025I want you to look closely at this chart. These aren't just lines and candles. This is a timeline of warnings. September 12th, 23th, 30th, October 6th, October 10th—I was screaming that the top was in. I told you I was getting out of the market.
For this, I received more hate than I have in my entir
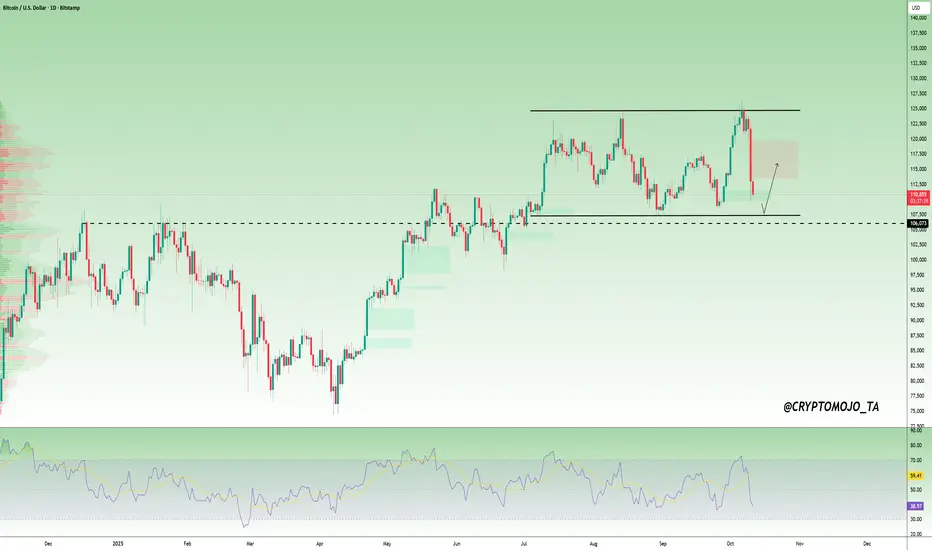
BITCOIN Market Resilience Amid the BloodbathDespite yesterday’s broad market massacre, Bitcoin continues to demonstrate exceptional structural strength. The sell-off wasn’t random, it was a precisely engineered liquidity flush designed to test the integrity of the primary ascending trendline that has defined this bullish cycle.
That deep ret

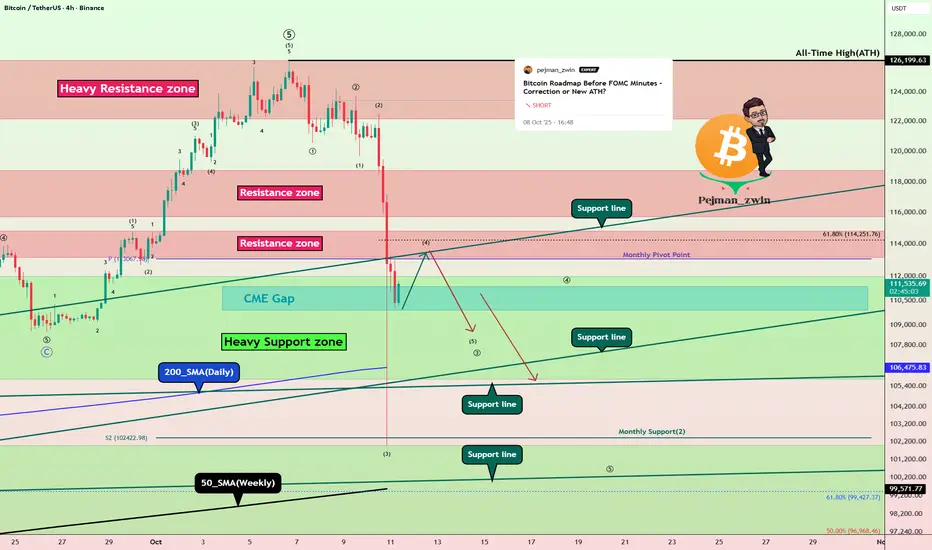
Bitcoin Roadmap: Is a Major Correction the Next Stop?As I expected from the previous analysis , Bitcoin did start to drop and hit its targets .
Now, with the news that the U.S. might impose a 100% tariff on China , we saw Bitcoin sharply sell off last night. Actually, as I mentioned in my previous ideas , the rally from about $109,000 to arou
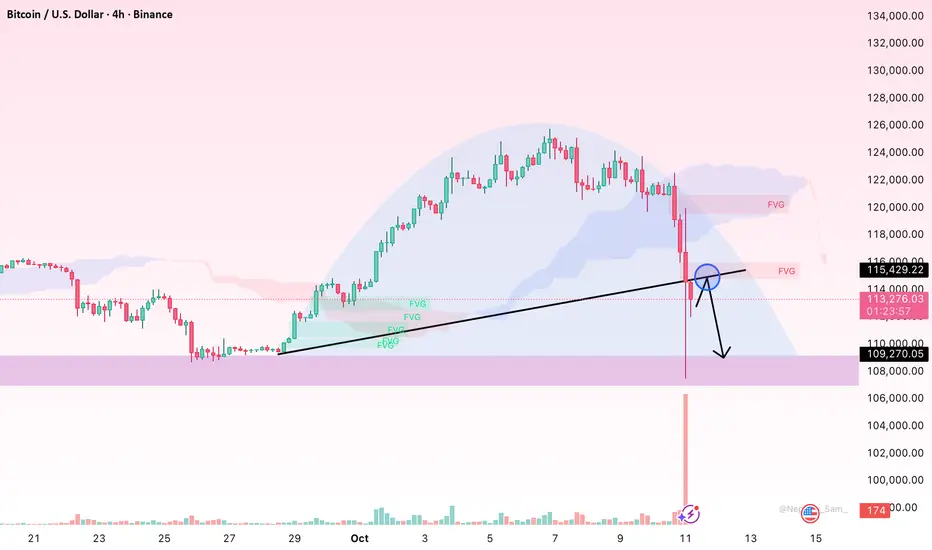
Bitcoin – The Sharp Pullback Before the Next Big MoveHello everyone,
The Bitcoin market just went through a strong “brake tap” in the latest session. On the 4H chart (Binance), a deep red candle with high volume dragged the price from around $115,000 straight down to near $108,000 before rebounding slightly to $112,000–$113,000. The Ichimoku cloud w
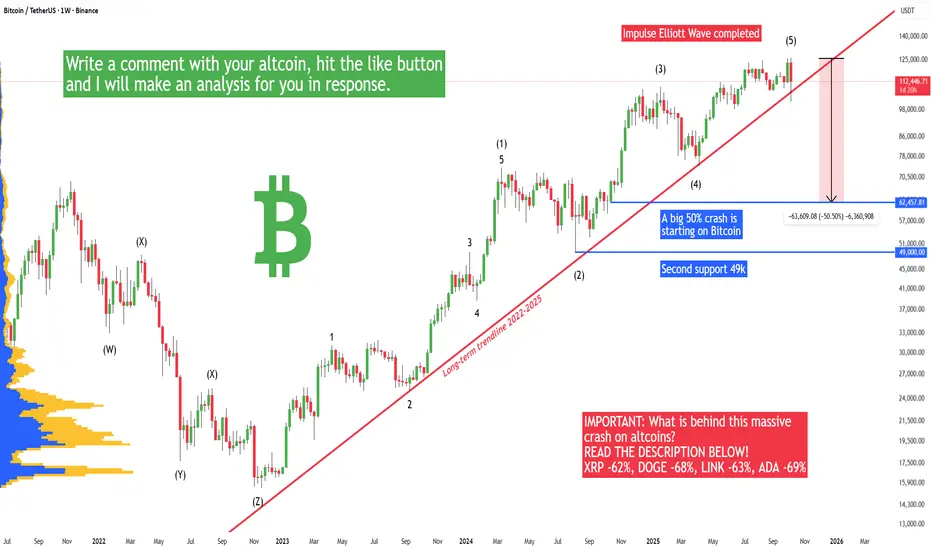
BTCUSDT the major -50% dump completed wait for 140K$ now!!!!!Major Fibonacci level which was 0.5 did touch and hold strong and now it is time for new waves of bull to get revenge and the target which can hit in next few weeks is now updated and is 140K$ at least.
Notice: my personal view about that red reject candle in market the news did dump price but now

BTC Range: Key Levels & Post-Liquidation Outlook!!CRYPTOCAP:BTC We are still in a range, and the longer we stay here, the better, in my opinion.
How the market reacts after liquidation events is very telling.
Take a look at the difference between the COVID crash and the FTX implosion. Of course, they occurred at different points in the cycle,
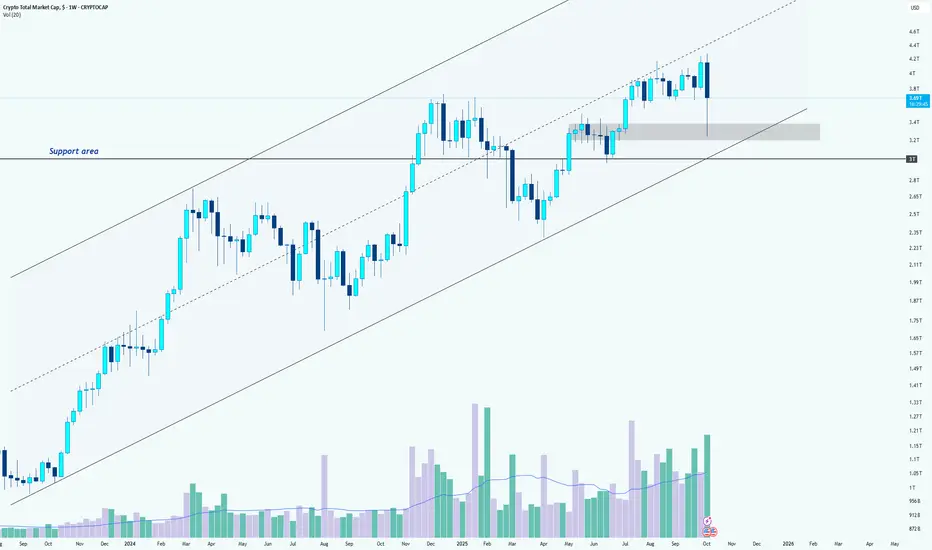
Crypto Total Market Cap AnalysisHi Team!
The crypto market continues to show impressive strength, maintaining its position inside the long-term ascending channel. Despite the recent correction, the overall structure remains bullish as long as the lower boundary of this channel holds.
After facing resistance near the upper line o
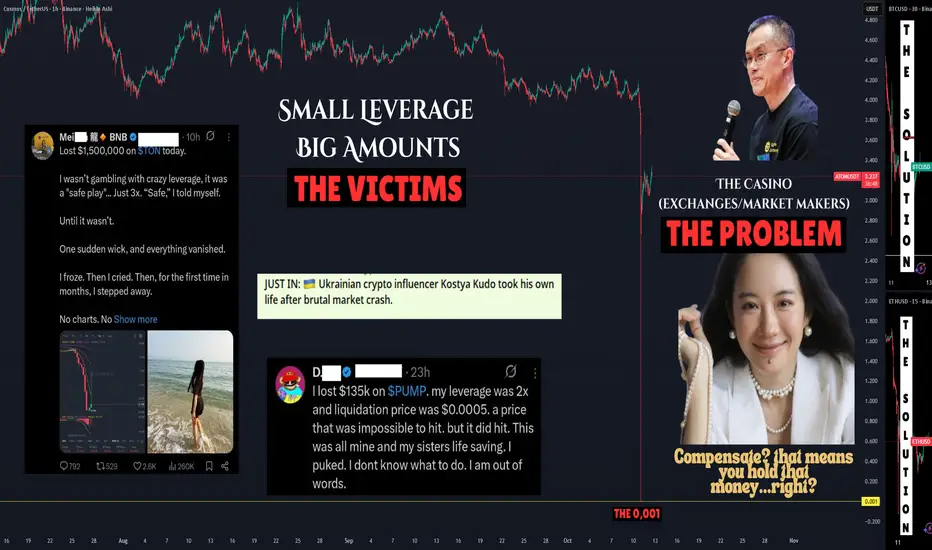
The Problem With Crypto – Part 1: Centralized 'Exchanges'🧠 The Problem With Crypto – Part 1: Centralized Exchanges
It actually took me a while to decide what title to give this post.
Because every single one of these would fit:
-The Exchange Illusion
-The Liquidation Machine
-The Centralized Harvest
-Inside the Casino
-How Exchanges Always Win
-Where
The Crypto Black Swan Event > 10 bln USD of liquidations🧭 Executive Summary of the Crypto Black Swan Event
⚡ A sudden U.S. announcement of 100% tariffs on Chinese imports triggered a broad risk-off move across assets. Crypto, heavily levered near record highs, absorbed the shock via a forced-deleveraging cascade.
📉 Bitcoin fell sharply off its Oct 5 al

See all crypto ideas
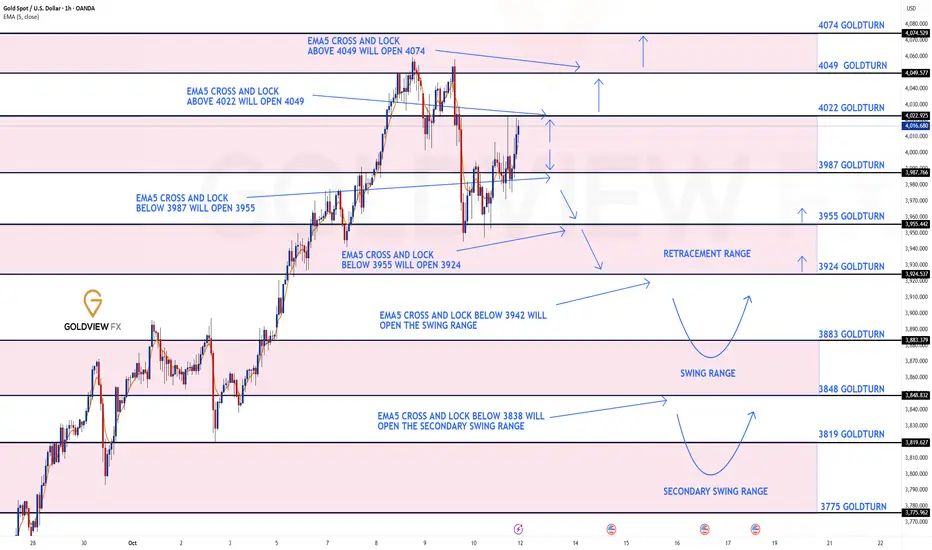
GOLD 1H CHART ROUTE MAP UPDATE & TRADING PLAN FOR THE WEEKHey Everyone,
Please see our updated 1h chart levels and targets for the coming week.
We are seeing price play between two weighted levels with a gap above at 4022 and a gap below at 3987. We will need to see ema5 cross and lock on either weighted level to determine the next range.
We will see le
XAUUSD - Recovery Ahead of the Weekend👋Hello everyone, what do you think about OANDA:XAUUSD ?
Last week continued to be a victorious one for the Bulls. The metal successfully broke through the $4,000 level, setting a new record. By Thursday, a slight pullback occurred, but overall, the trend remained positive, and momentum returned b

THE KOG REPORTTHE KOG REPORT:
In last week’s KOG Report we had a bias level and bullish above 3740 and a red box break we wanted to see above the 3765 level. We managed to swoop the low, not into 3740 but not far off, then break above and managed to complete all of the red box targets on that day.
During the

Wall Street Weekly Outlook - Week 42 2025Every week I release a Wall Street Weekly Outlook that highlights the key themes, market drivers, and risks that professional traders are watching.
This week promises to be particularly volatile.
With tensions escalating in the U.S.–China trade conflict, markets already began to show the first s

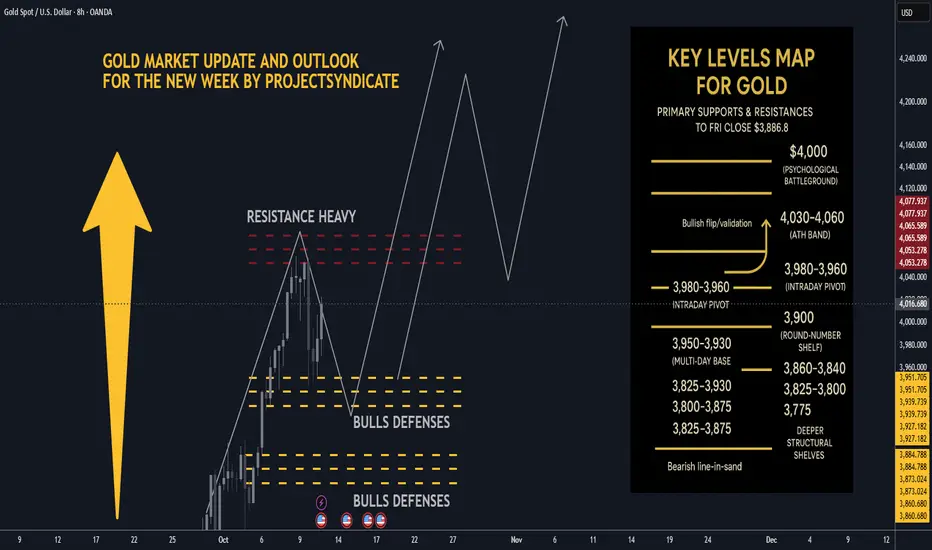
Gold next week: Key S/R Levels and Outlook for Traders🏆 Friday’s Close & Recent ATH:
Gold XAUUSD closed Friday around ~$3,990–$4,020/oz depending on venue most consolidated feeds show prints near $3.99–$4.02k at Friday close. The nearest recent intraday highs printed in the $4,030–$4,060 area across data providers this week, putting $4,000 as the imm
Silver: New ATH, Sharp Pullback, and What Comes NextLast week, something traders had been waiting for finally happened — Silver reached a new all-time high, touching 51.30 before a strong 3,000-pip selloff followed.
However, looking closely at the chart, we can see that this decline stopped precisely at the confluence of horizontal support and the as
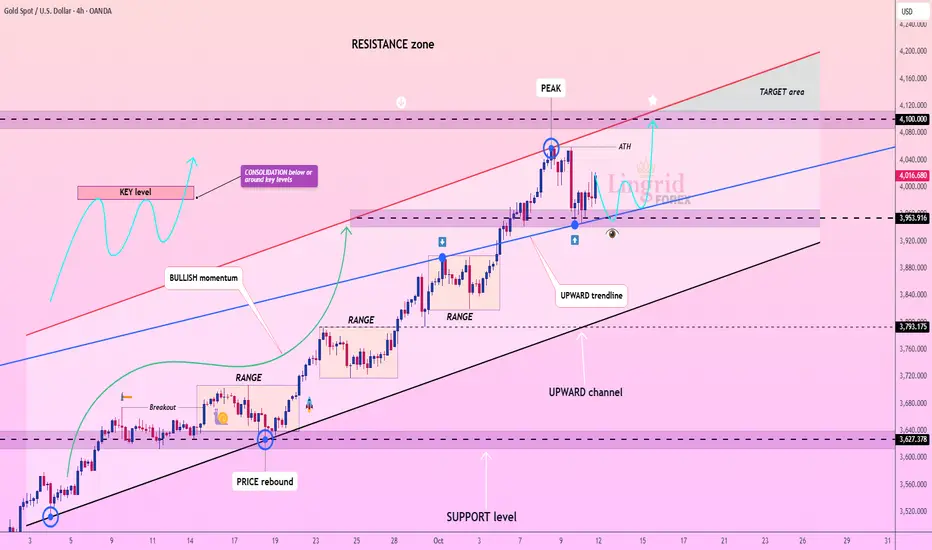
Lingrid | GOLD Weekly Outlook: Dip-Buying Dominance ContinuesThe price perfectly fulfilled my previous weekly idea . OANDA:XAUUSD market delivered another impressive performance this week, decisively pushing through the psychologically significant $4,000 threshold. While this round number naturally attracts considerable market attention, seasoned traders r
GOLD Potential Short!
HI,Traders !
#GOLD is growing Nicely but will
Soon hit a horizontal resistance
Of 4049.41 so after the
Retest a local bearish
Pullback is to be expected !
Comment and subscribe to help us grow !

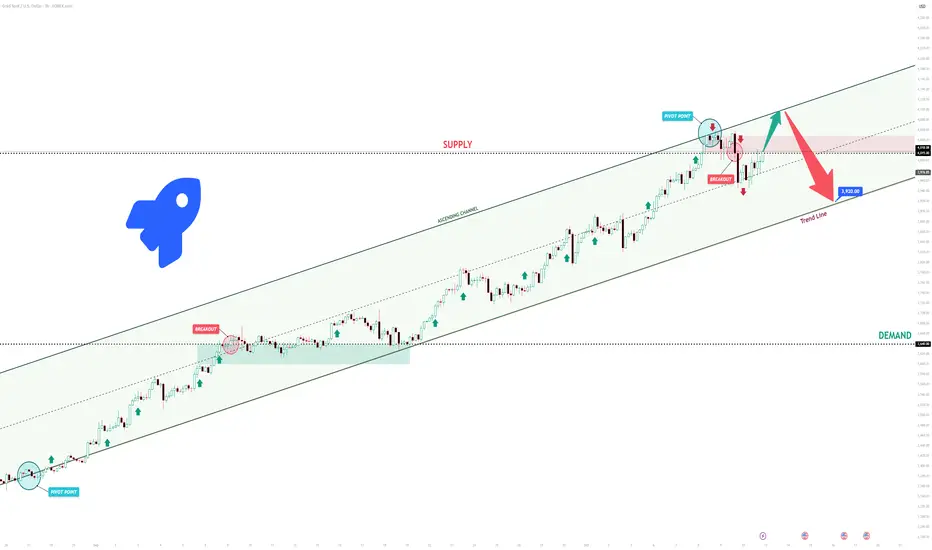
XAUUSD Short: Correction to 3920 Expected from the HighsHello, traders! The price auction for XAUUSD has been dominated by a strong bullish trend, which has been clearly defined by a large ascending channel. The market has consistently made higher highs and higher lows, breaking through key resistance levels like 3640 and showing that the buyer initiativ
Bounce or Break?For anyone that trades trendlines, how many times have you had a confirmed break of trend only to get stopped out right before the big move?
This has been a challenge for me for a long time.
My strategy works very well, but the market chops, leaving me losing more than I'm making. Even though my
See all futures ideas
AUDUSD Eyes 0.64500 Support as Bullish Structure Holds FirmHey Traders,
In today’s session, we’re closely monitoring AUDUSD for a potential buying opportunity around the 0.64500 zone. The pair continues to trade within a broader uptrend, and the current pullback appears to be a healthy correction toward a key support and resistance confluence near 0.64500.

EURUSD: Downtrend will Continue in ChannelHello everyone, here is my breakdown of the current Euro setup.
Market Analysis
The price action has been clearly bearish, with the market being guided lower by a well-defined Downward Channel. This structure has been in place for some time, creating a series of lower highs and lower lows after

USDJPY Holds Firm Above 151, Dollar Strength Faces Yen’s Haven USDJPY has surged to fresh highs above 153 before pulling back, showing how stretched the pair has become after weeks of relentless dollar strength. The dollar continues to benefit from sticky US inflation and hawkish Fed expectations, but the yen is finding some defensive flows as Japanese politics

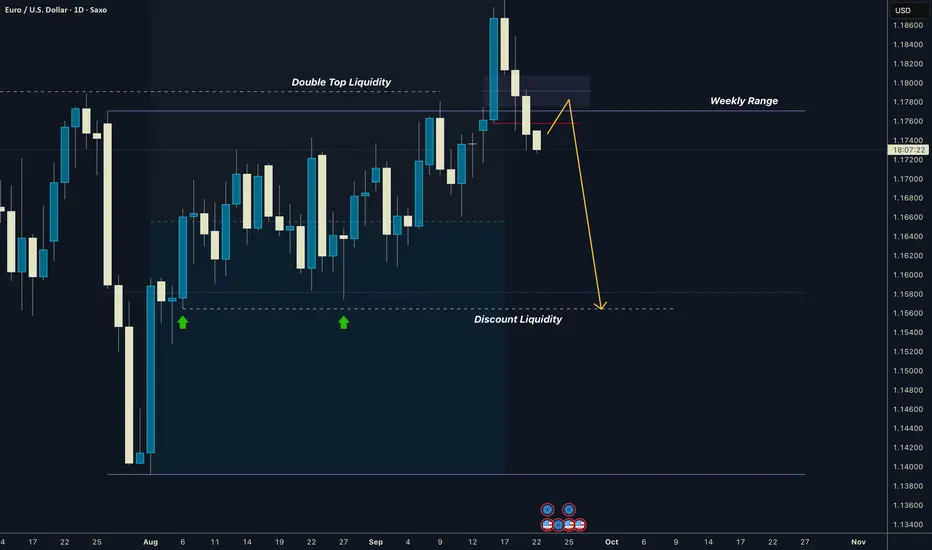
EURUSD I Weekly Range I Manipulation - Time for pullbackGM Friends,price was ranging diagonaly up for the whole August. During the FOMC it has made final manipulation where most of traders most likely entered longs. With expectations of weak USD. While the CUT 0.25 BPS was already priced in so price reversed. This is a clean pattern of accumulation, m
USD-JPY Demand Area Below! Buy!
Hello,Traders!
USDJPY is approaching a wide demand area, where Smart Money may engineer a liquidity grab before reversing. Expect price to react from 150.300 zone, targeting 152.000 as inefficiency gets rebalanced. Time Frame 12H.
Buy!
Comment and subscribe to help us grow!
Check out other fore

GBPUSD 1Month1️⃣ Yearly:
The IRL liquidity was taken last year. However, since the beginning of this year, the movement appears to be targeting the IRL level. (12.10.2025)
2️⃣ 2–3 Monthly:
In the first quarter, the price made a fake drop, collected liquidity, and closed the first two quarters with bullish cand

EURUSDHello Traders! 👋
What are your thoughts on EURUSD?
In the EUR/USD chart, we can see that price failed to close above the marked resistance zone and was rejected from that area.
Additionally, the pair has broken its ascending trendline and closed below it, signaling a potential shift in short-term

NZDUSD--SHORT--Descending Channel--bearish continuation
--monthly bearish
--weekly bearish
--entry and tp levels are as shown on the chart

EURUSD 4H🔹 Overall Outlook and Potential Price Movements
In the charts above, we have outlined the overall outlook and possible price movement paths.
As shown, each analysis highlights a key support or resistance zone near the current market price. The market’s reaction to these zones — whether a breakout

USD/JPY - Potential Targets🔶USDJPY Trading Card
🔑 Pivot Zone: 152.50 – 153.00 (Primary Supply)
📊 Context: Bullish correction | Current 151.176
⚠️ Key Levels:
Active resistance = 152.50-153.00
Strong demand - correction support = 150.00-150.50
Bull/bear threshold = 147.00-147.50
────────────────────────────────────
🟢 Bullis

See all forex ideas
| - | - | - | - | - | - | - | ||
| - | - | - | - | - | - | - | ||
| - | - | - | - | - | - | - | ||
| - | - | - | - | - | - | - | ||
| - | - | - | - | - | - | - | ||
| - | - | - | - | - | - | - | ||
| - | - | - | - | - | - | - | ||
| - | - | - | - | - | - | - |
Trade directly on the supercharts through our supported, fully-verified and user-reviewed brokers.


