Starting today, investors on TradingView can chart financial data for the stocks they care about. Analyze trends in revenue, unlock hidden insights about a company’s earnings, and more. This new release gives everyone the financial data they need to evaluate the financial condition of a company and determine if it’s overvalued or undervalued.
To get started, find the Financials button located at the top of your TradingView chart and press it:

All financial data on TradingView is organized into four main categories: Income Statement, Balance Sheet, Cash Flow, and Ratios. After pressing the Financials button at the top of your chart, you’ll be presented with a window showing these four categories and the different indicators in each group. This is where you can select and chart indicators like EPS and EBITDA (find these in the Income Statement section) or price-to-earnings and price-to-sales ratios (find these in the Ratios section).
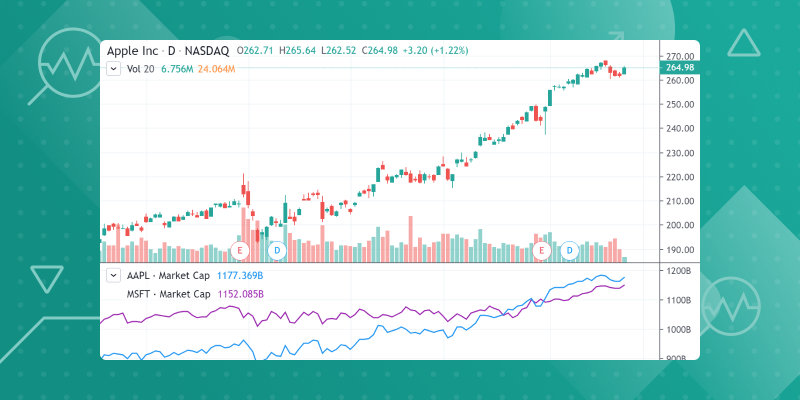
You can also compare and contrast the same financial indicators for different companies on the same chart. To do this, press the Settings button on your chart, go to Inputs, and press the button to add Another Symbol:

The following financial indicators have been added to TradingView and we’re excited to see how investors use them. Over the coming months, we’ll be adding more indicators and unique ways to evaluate companies. Here’s a detailed guide on each fundamental indicator:
Income Statement
| Total Revenue | The field represents gross sales and other operating revenue less discounts, returns and allowances. |
| Cost of Revenue, Total | The field return as the sum of Cost of Goods Sold – Excluding Depreciation & Amortization and Depreciation, Depletion & Amortization. |
| Total Operating Expenses | Represents the sum of all expenses related to operations. |
| Gross Profit | The field represents the difference between sales or revenues and cost of goods sold and depreciation. Gross profit = Revenue − Cost of goods sold incl D&A. |
| Research & Development | The field represents all direct and indirect costs related to the creation and development of new processes, techniques, applications and products with commercial possibilities. |
| Selling/General/Admin Expenses, Total | The field returns Total Operating Expenses: Research Development plus Selling General and Administrative. |
| Operating Income | The field represents the difference between sales and total operating expenses. |
| Net Income | The field returns net income available to common fully diluted EPS for the period and date(s) requested in local currency by default. |
| Diluted EPS | The field returns fully-diluted Earnings Per Share as reported on a company’s filing. |
| EBITDA | The field returns EBITDA (Operating Income Plus Depreciation & Amortization). This is calculated as the sum of EBIT (Operating Income) and Depreciation, Depletion and Amortization.
If Depreciation, Depletion, and Amortization is not available, then Depreciation, Depletion and Amortization (Cash Flow) will be substituted. Note, given the nature of the data items included in this calculation, this formula will only return data for industrial companies. |
Balance Sheet
| Total Assets | The field represents the sum of total current assets, long-term receivables, investment in unconsolidated subsidiaries, other investments, net property plant and equipment, deferred tax assets, and other assets. |
| Long Term Debt | Non-Current Portion of Long Term Debt. The field represents all interest-bearing financial obligations, excluding current portion of long-term debt, pensions, deferred taxes and minority interest. |
| Total Debt | The field represents all interest bearing and capitalized lease obligations. It is the sum of long and short-term debt. |
| Total Liabilities | The field represents all short- and long-term obligations expected to be satisfied by the company. |
| Total Equity | The field represents total equity for the period and date(s) requested. |
| Total Liabilities & Shareholders’ equities | The field represents the sum of total liabilities, minority interest, non-equity reserves, preferred stock and common equity. |
Cash Flow
| Cash from Operating Activities | The field represents net cash from operating activities. |
| Cash From Investing Activities | The field represents net cash from investing activities. |
| Cash From Financing Activities | The field represents net cash from financing activities. |
| Free Cash Flow | The field represents free cash flow for the entire firm. |
Ratios
| Return on Equity | This is calculated as Net Income TTM divided by the two fiscal period average of Total Shareholders’ Equity. |
| Price Book Ratio | This is calculated as Price per share divided by Book Value per Share. |
| Price Cash Flow Ratio | This is calculated as Price per share divided by Operating Cash Flow per Share. |
| Price Sales Ratio | This is calculated as Price per share divided by Sales Per Share. |
| Price Earnings Ratio | This is calculated as Price per share divided by Diluted Earnings per Share TTM. |
| Market Capitalization | This is calculated as Price per share multiplied by the Number of Shares outstanding. |
| Earnings Yield | This is calculated as Diluted Earnings per Share TTM divided by Price per share. |
While using financial data, it’s important to remember that financial data is derived from the published financial statements of companies, for example SEC filings. Sometimes a company will be missing certain data points over specific time periods and it’s often because of a change in data from the main source. This can impact the availability of that data.
It is worth noting that our data provider, Factset, uses its own methodology for collecting and processing data, which is why financial indicators on TradingView may differ from similar indicators provided by other sources. You can find more info here.
Thanks for being a TradingView member and please let us know if you enjoy this release!