Market ShiftingHow Global Financial Markets Are Entering a New Phase of Transformation
Financial markets across the world are undergoing a profound shift. The forces that once defined market behavior—cheap liquidity, synchronized global growth, predictable central bank support, and deep globalization—are no longer dominant. Instead, markets are being reshaped by structural changes in geopolitics, technology, monetary policy, demographics, and investor behavior. This “market shifting” phase is not a temporary correction or a short-term cycle; it represents a transition into a new market regime where volatility, selectivity, and adaptability matter more than ever.
At its core, market shifting refers to the reallocation of capital, changes in leadership among asset classes and sectors, evolving risk-return dynamics, and altered relationships between traditional financial indicators. Understanding this shift is essential for investors, traders, policymakers, and businesses alike, as strategies that worked in the past decade may fail in the decade ahead.
From Easy Money to Tight Financial Conditions
One of the most important drivers of today’s market shift is the global move away from ultra-loose monetary policy. For more than a decade after the 2008 financial crisis, central banks flooded markets with liquidity through near-zero interest rates and quantitative easing. This environment inflated asset prices, reduced volatility, and encouraged risk-taking across equities, bonds, real estate, and alternative assets.
That era has now ended. Persistent inflation forced central banks such as the U.S. Federal Reserve, European Central Bank, and others to raise interest rates aggressively. Higher rates increase the cost of capital, compress valuations, and shift investor preference from speculative growth assets to cash-flow-generating and defensive investments. As a result, markets are recalibrating what assets are truly worth in a world where money is no longer free.
Shifting Asset Class Leadership
Another defining feature of the current market shift is the rotation in asset class leadership. During the previous cycle, equities—especially technology and growth stocks—consistently outperformed. Bonds served as reliable hedges, and correlations between asset classes were relatively stable.
Today, those relationships are changing. Bonds are no longer guaranteed safe havens during inflationary periods, commodities have regained importance as inflation hedges, and currencies are becoming active trading instruments rather than background variables. Gold, energy, industrial metals, and even agricultural commodities have taken center stage as investors seek protection against inflation, supply shocks, and geopolitical risk.
This shift means diversification strategies must be rethought. Traditional 60/40 portfolios are under pressure, pushing investors to explore alternatives such as commodities, infrastructure, private credit, and tactical trading strategies.
Geopolitics and Fragmentation of Global Markets
Geopolitical tensions are accelerating the market shift. The U.S.–China rivalry, regional conflicts, trade wars, sanctions, and the reshoring of supply chains are fragmenting global markets. Instead of one integrated global financial system, the world is moving toward regional blocs with distinct rules, risks, and capital flows.
This fragmentation impacts markets in multiple ways. Supply chain disruptions increase costs and inflation volatility. Trade restrictions alter corporate earnings and sector leadership. Capital controls and sanctions affect currency stability and cross-border investments. For markets, geopolitical risk is no longer a tail risk—it is a core pricing factor.
Technology, Automation, and Market Structure Changes
Technology is also reshaping how markets function. Algorithmic trading, artificial intelligence, high-frequency strategies, and retail participation through digital platforms have altered market microstructure. Price movements can be faster, sharper, and sometimes disconnected from fundamentals in the short term.
At the same time, technology-driven sectors are themselves undergoing a shift. Investors are now distinguishing between profitable, scalable tech businesses and those reliant on cheap funding. Innovation remains powerful, but valuation discipline has returned. This change reflects a broader market shift toward quality, earnings visibility, and balance sheet strength.
Behavioral Shifts Among Investors
Investor psychology is changing as well. The “buy the dip” mentality that dominated during central-bank-supported markets is no longer universally effective. Increased volatility, sudden drawdowns, and macro-driven price swings have made market participants more cautious.
Retail investors are more active but also more selective. Institutional investors are shortening time horizons, using derivatives for hedging, and actively managing risk rather than relying on passive exposure alone. This behavioral shift reinforces market volatility and creates frequent rotations between risk-on and risk-off environments.
Emerging Markets and Capital Flow Realignment
Market shifting is also visible in emerging markets. Higher global interest rates have reversed capital flows that once favored emerging economies. Stronger reserve currencies, especially the U.S. dollar, have pressured emerging market currencies, debt, and equities.
However, this shift is uneven. Countries with strong fundamentals, manageable debt, domestic growth drivers, and stable policy frameworks are attracting selective investment. Others face capital outflows and market stress. This divergence highlights how the new market environment rewards differentiation rather than broad-based exposure.
Implications for Traders and Long-Term Investors
The ongoing market shift demands a new approach to strategy and risk management. For traders, volatility creates opportunity, but it also increases the importance of discipline, position sizing, and macro awareness. Technical analysis must be combined with macro context, as news events and policy signals can override chart patterns.
For long-term investors, patience and selectivity are crucial. Instead of chasing momentum, focus is shifting toward valuation, earnings resilience, dividends, and real assets. Flexibility—across asset classes, geographies, and styles—is becoming a competitive advantage.
Conclusion: Adapting to the New Market Reality
Market shifting is not a crisis; it is a transition. Financial markets are adjusting to a world defined by higher interest rates, geopolitical complexity, technological disruption, and changing investor behavior. While this environment is more volatile and uncertain, it also offers opportunities for those who understand the new rules.
Success in this phase depends on adaptability, risk awareness, and a willingness to move beyond outdated assumptions. Markets are no longer driven by a single narrative or policy backstop. Instead, they reflect a complex interplay of economics, politics, and psychology. Recognizing and respecting this shift is the first step toward navigating the markets of today—and thriving in the markets of tomorrow.
Chart Patterns

Global Finance History: Evolution of Money, Markets, and PowerThe history of global finance is deeply intertwined with the evolution of human civilization. From the earliest systems of barter to today’s complex web of digital currencies, stock exchanges, and global capital flows, finance has shaped economic growth, political power, and social change. Understanding global financial history helps explain how modern markets function, why financial crises recur, and how wealth and influence are distributed across nations.
Early Origins: Barter, Money, and Banking
In ancient societies, economic exchange began with barter—direct trade of goods and services. However, barter was inefficient due to the “double coincidence of wants.” To overcome this, early civilizations introduced money in the form of commodities such as cattle, grains, shells, and precious metals. Around 600 BCE, the Lydians (in modern-day Turkey) minted the first standardized coins, marking a turning point in financial history.
Ancient Mesopotamia and Egypt laid the foundations of banking. Temples and palaces acted as financial centers, accepting deposits, extending loans, and keeping records. The Code of Hammurabi (circa 1750 BCE) included laws regulating interest rates and debt, highlighting the early importance of financial regulation.
Classical and Medieval Finance
In ancient Greece and Rome, financial systems expanded alongside trade and empire-building. Money changers, maritime loans, and early forms of insurance supported long-distance commerce. Rome developed sophisticated taxation and public finance systems, funding infrastructure and military expansion. However, the collapse of the Roman Empire led to economic fragmentation in Europe.
During the medieval period, global finance re-emerged through trade networks connecting Europe, the Middle East, Africa, and Asia. Islamic civilizations played a crucial role, advancing credit instruments such as checks (sakk), bills of exchange, and partnership contracts. These innovations later influenced European banking.
Italian city-states like Venice, Florence, and Genoa became financial powerhouses between the 12th and 15th centuries. Merchant banks financed trade, governments, and wars. The Medici Bank, for example, pioneered double-entry bookkeeping, a system still fundamental to modern accounting.
The Rise of Capitalism and Financial Markets
The early modern period marked the transition from mercantilism to capitalism. European exploration and colonial expansion created global trade routes and massive capital flows. Joint-stock companies such as the Dutch East India Company (VOC) and the British East India Company allowed investors to pool capital and share risk, a major milestone in financial innovation.
The first stock exchange emerged in Amsterdam in the early 17th century, enabling the trading of shares and bonds. This period also saw the development of government debt markets, as states borrowed to finance wars and expansion. Central banking began to take shape with institutions like the Bank of England (founded in 1694), which helped stabilize government finances and manage currency.
Industrial Revolution and Modern Finance
The Industrial Revolution of the 18th and 19th centuries transformed global finance. Rapid industrialization required large-scale investment in factories, railways, and infrastructure. Banks, stock markets, and bond markets expanded to meet these needs. Financial centers such as London and later New York emerged as global hubs of capital.
Gold became the backbone of the international monetary system. Under the gold standard, currencies were pegged to a fixed amount of gold, promoting stability in exchange rates and international trade. However, this system also limited governments’ ability to respond to economic shocks.
20th Century: Crises, Regulation, and Globalization
The 20th century was marked by extreme financial volatility and institutional reform. World War I disrupted the gold standard, and the Great Depression of the 1930s exposed weaknesses in unregulated financial markets. Massive bank failures and stock market crashes led governments to intervene more actively in finance.
In response, new regulatory frameworks emerged. The United States introduced banking reforms, while globally the Bretton Woods system (established in 1944) created institutions such as the International Monetary Fund (IMF) and the World Bank. The US dollar became the world’s reserve currency, pegged to gold, while other currencies were pegged to the dollar.
From the 1970s onward, the collapse of Bretton Woods led to floating exchange rates. Financial globalization accelerated as capital controls were lifted, technology advanced, and multinational banks expanded. Derivatives, hedge funds, and complex financial instruments grew rapidly, increasing both efficiency and risk.
The Digital Age and Contemporary Finance
The late 20th and early 21st centuries ushered in the digital revolution in finance. Electronic trading, online banking, and real-time global markets transformed how money moves across borders. Financial innovation brought benefits such as efficiency and inclusion but also new vulnerabilities.
The global financial crisis of 2008 was a defining moment, revealing systemic risks in interconnected financial systems. Governments and central banks responded with unprecedented monetary stimulus and tighter regulations. Since then, issues like sovereign debt, inequality, and financial stability have remained central concerns.
Today, global finance is evolving again with the rise of fintech, cryptocurrencies, central bank digital currencies (CBDCs), and sustainable finance. Emerging markets play a larger role, while geopolitical tensions increasingly influence capital flows and monetary policy.
Conclusion
Global financial history is a story of innovation, expansion, crisis, and reform. Each era built upon the successes and failures of the past, shaping today’s complex financial system. By understanding this history, policymakers, investors, and citizens can better navigate modern financial challenges and anticipate future transformations in the global economy.

Analyzing the Federal Reserve, ECB, BOJ, and Bank of EnglandGlobal Interest Rate Trends
Interest rates are among the most powerful tools used by central banks to influence economic activity, control inflation, stabilize financial systems, and manage growth cycles. Over the past few years, global interest rate trends have undergone a dramatic shift as the world economy transitioned from ultra-loose monetary policy to aggressive tightening. The Federal Reserve (Fed), European Central Bank (ECB), Bank of Japan (BOJ), and Bank of England (BOE) represent four of the most influential central banks, and their policy decisions collectively shape global liquidity, capital flows, currency movements, and financial market behavior. Understanding their interest rate trends provides crucial insight into the global macroeconomic environment.
The Federal Reserve (United States): From Ultra-Low Rates to Aggressive Tightening
The U.S. Federal Reserve has played a leading role in shaping global interest rate trends. Following the global financial crisis of 2008 and later during the COVID-19 pandemic, the Fed maintained near-zero interest rates and implemented large-scale quantitative easing (QE) to support economic recovery. However, the post-pandemic surge in inflation—driven by supply chain disruptions, fiscal stimulus, and strong consumer demand—forced a sharp pivot.
The Fed entered one of the most aggressive rate-hiking cycles in decades, rapidly increasing the federal funds rate to curb inflation. This tightening phase aimed to slow demand, cool labor markets, and anchor inflation expectations. As inflation showed signs of moderation, the Fed shifted from rapid hikes to a more data-dependent stance, emphasizing the importance of economic indicators such as inflation, employment, and wage growth.
The Fed’s interest rate policy has global consequences. Higher U.S. rates strengthen the dollar, attract global capital, and tighten financial conditions worldwide. Emerging markets often feel pressure as capital flows toward U.S. assets, increasing borrowing costs and currency volatility. As a result, the Fed remains the most influential central bank in the global interest rate ecosystem.
European Central Bank (Eurozone): Fighting Inflation Amid Fragmentation Risks
The European Central Bank faced a unique challenge in its interest rate journey. For years, the ECB operated with negative interest rates to stimulate growth and prevent deflation across the Eurozone. However, inflation surged sharply due to energy price shocks, supply disruptions, and geopolitical tensions, particularly the Russia–Ukraine conflict.
In response, the ECB abandoned its negative-rate policy and initiated a series of rate hikes. The objective was to contain inflation while avoiding financial instability in weaker Eurozone economies. Unlike the U.S., the Eurozone consists of multiple countries with varying fiscal strength, making uniform monetary policy more complex.
The ECB had to balance tightening with tools designed to prevent bond yield spreads from widening excessively between core economies (like Germany) and peripheral nations (such as Italy or Spain). This delicate balancing act highlights the ECB’s dual challenge: controlling inflation without triggering sovereign debt stress.
ECB rate decisions have influenced the euro’s valuation, cross-border investment flows, and borrowing costs across Europe. While tightening has helped reduce inflationary pressures, growth concerns remain, keeping the ECB cautious and highly data-driven.
Bank of Japan (Japan): The Last Defender of Ultra-Loose Policy
The Bank of Japan stands out as an exception among major central banks. For decades, Japan has struggled with deflation, weak demand, and stagnant wage growth. As a result, the BOJ maintained ultra-low interest rates and implemented unconventional policies such as yield curve control (YCC), which caps government bond yields.
Even as global inflation surged, the BOJ was slow to tighten policy. It viewed inflation as largely cost-push rather than demand-driven and remained focused on achieving sustainable wage growth. This divergence caused a significant depreciation of the Japanese yen, as interest rate differentials widened between Japan and other major economies.
Eventually, the BOJ began adjusting its stance, allowing more flexibility in bond yields and signaling a gradual normalization path. However, its approach remains cautious compared to other central banks. Any rate hikes are expected to be slow and measured to avoid disrupting Japan’s highly leveraged public sector and fragile growth dynamics.
The BOJ’s policy divergence has played a major role in global currency markets, carry trades, and capital allocation strategies.
Bank of England (United Kingdom): Balancing Inflation and Growth Risks
The Bank of England was among the earliest major central banks to begin raising interest rates in response to rising inflation. The UK faced particularly strong inflationary pressures due to energy costs, labor shortages, and post-Brexit structural challenges.
The BOE embarked on a steady tightening cycle to bring inflation under control while managing risks to economic growth. Unlike the U.S., the UK economy is more sensitive to interest rate changes due to higher levels of variable-rate borrowing, especially in the housing market.
BOE policy decisions also had to account for financial stability concerns, particularly after episodes of market stress in the UK bond market. As inflation began to ease, the BOE adopted a more cautious tone, signaling that rates may remain elevated for an extended period rather than rising aggressively.
The BOE’s interest rate trajectory has influenced the British pound, domestic credit conditions, and investor confidence in UK assets.
Global Implications of Diverging Interest Rate Policies
The divergence in interest rate trends among the Fed, ECB, BOJ, and BOE has created complex global dynamics. Higher rates in the U.S. and Europe have tightened global liquidity, increased borrowing costs, and reshaped investment strategies. Meanwhile, Japan’s accommodative stance has fueled carry trades, where investors borrow in low-yield currencies to invest in higher-yielding assets elsewhere.
Currency volatility has increased as interest rate differentials widened. Trade balances, capital flows, and asset valuations have all been affected. For emerging markets, global rate trends determine access to capital, debt sustainability, and exchange rate stability.
Conclusion
Global interest rate trends reflect a world adjusting to post-pandemic realities, inflationary pressures, and structural economic changes. The Federal Reserve leads with a strong anti-inflation stance, the ECB balances tightening with regional stability, the BOJ cautiously exits ultra-loose policy, and the BOE navigates inflation amid growth constraints. Together, these central banks shape the global financial landscape, influencing everything from currencies and commodities to equities and bonds. Understanding their interest rate trajectories is essential for policymakers, investors, and businesses operating in an interconnected global economy.

Trading Sovereign Debt: How Government Bonds Shape Global MarketTrading sovereign debt is one of the most important and influential activities in the global financial system. Sovereign debt refers to bonds and other debt instruments issued by national governments to finance public spending, manage budget deficits, and refinance existing obligations. These instruments are considered the backbone of financial markets because they influence interest rates, currency values, capital flows, and even equity market performance. Understanding how sovereign debt trading works is essential for traders, investors, policymakers, and anyone seeking insight into global macroeconomic dynamics.
What Is Sovereign Debt?
Sovereign debt is money borrowed by a government, typically through the issuance of bonds. These bonds promise to pay periodic interest (known as coupons) and return the principal at maturity. Governments issue debt in their own currency (domestic debt) or in foreign currencies (external debt). Examples include U.S. Treasury bonds, Indian Government Securities (G-Secs), UK Gilts, and Japanese Government Bonds (JGBs).
Sovereign debt is often considered low-risk compared to corporate debt because governments have taxation authority and, in some cases, the ability to print money. However, risk levels vary significantly between developed and emerging economies. While U.S. Treasuries are seen as near risk-free, bonds issued by highly indebted or politically unstable countries can carry substantial default risk.
Why Governments Issue Sovereign Debt
Governments issue debt for several reasons. The most common reason is to finance fiscal deficits when public spending exceeds tax revenue. Sovereign debt is also used to fund infrastructure projects, social welfare programs, defense, and economic stimulus during downturns. Additionally, governments refinance old debt by issuing new bonds, managing maturities to ensure stable funding.
From a macroeconomic perspective, sovereign debt plays a vital role in monetary policy. Central banks use government bonds in open market operations to control liquidity and influence interest rates. As a result, trading sovereign debt is closely linked to central bank decisions and economic data.
How Sovereign Debt Is Traded
Sovereign debt is traded primarily in the bond market, both in primary and secondary markets. In the primary market, governments issue new bonds through auctions. Institutional investors such as banks, insurance companies, pension funds, and foreign investors participate heavily in these auctions.
In the secondary market, existing bonds are bought and sold among investors. Prices fluctuate based on interest rate expectations, inflation outlook, credit risk, currency movements, and global risk sentiment. Sovereign bonds are traded over-the-counter (OTC) rather than on centralized exchanges, although electronic trading platforms have become increasingly popular.
Bond prices and yields move inversely. When demand for a bond increases, its price rises and yield falls. Traders often focus more on yields than prices because yields reflect the cost of borrowing for governments and influence all other asset classes.
Key Drivers of Sovereign Debt Prices
Several factors influence sovereign debt trading. Interest rates are the most important driver. When central banks raise interest rates, existing bonds with lower coupons become less attractive, causing prices to fall and yields to rise. Conversely, rate cuts support bond prices.
Inflation expectations are another major factor. Higher inflation erodes the real value of fixed coupon payments, leading investors to demand higher yields. Economic growth data, employment numbers, and fiscal deficits also play a role, as they affect a government’s ability to service its debt.
Credit ratings issued by agencies such as Moody’s, S&P, and Fitch significantly impact sovereign bond markets. A downgrade can trigger capital outflows and sharp increases in yields, especially for emerging markets. Political stability, elections, geopolitical tensions, and fiscal discipline further influence investor confidence.
Sovereign Debt and Currency Markets
Sovereign debt trading is deeply connected to currency markets. Foreign investors who buy government bonds must convert their capital into the local currency, affecting exchange rates. High yields often attract foreign inflows, strengthening the currency, while rising debt concerns can lead to capital flight and currency depreciation.
For example, if a country raises interest rates to combat inflation, its sovereign bonds may offer higher yields, attracting global investors. This can lead to currency appreciation. However, if higher rates signal economic stress or debt sustainability issues, the opposite may occur. Macro traders often analyze sovereign bond yields and yield differentials to predict currency movements.
Developed vs Emerging Market Sovereign Debt
Developed market sovereign debt, such as U.S. Treasuries or German Bunds, is typically characterized by low yields and high liquidity. These bonds are often used as safe-haven assets during periods of global uncertainty. Traders use them for capital preservation, hedging, and relative value strategies.
Emerging market sovereign debt offers higher yields but comes with higher risk. These risks include currency volatility, political instability, weaker institutions, and external debt burdens. Trading emerging market debt requires careful analysis of fiscal balances, foreign exchange reserves, and external vulnerabilities. Despite the risks, many investors are attracted by the potential for higher returns and portfolio diversification.
Trading Strategies in Sovereign Debt
Sovereign debt traders employ a variety of strategies. Duration trading involves positioning for changes in interest rates by buying or selling bonds with different maturities. Yield curve trading focuses on the shape of the yield curve, such as steepening or flattening trades.
Carry trades are popular in sovereign debt markets, where investors borrow in low-yielding currencies and invest in higher-yielding sovereign bonds. Relative value trades compare yields between countries or maturities, aiming to profit from mispricing. Macro hedge funds often trade sovereign bonds based on expectations of central bank policy, inflation trends, and economic cycles.
Risks in Sovereign Debt Trading
Despite its reputation for safety, sovereign debt trading carries risks. Interest rate risk is the most common, as bond prices can fall sharply when rates rise. Credit risk, though low for developed nations, can be significant for highly indebted countries.
Liquidity risk can emerge during market stress, making it difficult to exit positions. Currency risk affects foreign investors holding local-currency bonds. Political risk, including sudden policy changes or fiscal slippage, can also disrupt sovereign bond markets. Effective risk management is essential, even in government bond trading.
Importance of Sovereign Debt in Global Finance
Sovereign debt markets form the foundation of the global financial system. Government bond yields serve as benchmarks for pricing corporate bonds, loans, mortgages, and other financial instruments. Central banks rely on sovereign debt markets to transmit monetary policy.
For traders and investors, sovereign debt provides opportunities across economic cycles, from capital preservation in downturns to yield generation in stable periods. Understanding sovereign debt trading is crucial for navigating global markets, as it reflects the intersection of economics, politics, and finance.
Conclusion
Trading sovereign debt is far more than buying and selling government bonds. It is a sophisticated activity that reflects economic health, monetary policy, fiscal discipline, and global investor sentiment. From safe-haven Treasuries to high-yield emerging market bonds, sovereign debt offers diverse opportunities and risks. For anyone involved in trading or investing, mastering sovereign debt dynamics is essential to understanding how global financial markets truly operate.

The Language of Price | Lesson 1 – Candlestick TheoryLesson Focus: Candlestick Types (Theory)
This post introduces the basic concept of candlesticks and how price behavior is visually represented on a chart.
Candlesticks are one of the most fundamental tools in market structure analysis, as they reflect price movement, momentum, and market participation over time.
📘 WHAT IS A CANDLESTICK?
A candlestick represents price activity during a specific time period and shows:
• opening price
• closing price
• highest price
• lowest price
Candlesticks do not predict the future.
They simply describe what has already happened in the market .
Their meaning becomes clearer only when viewed within broader market context.
🧠 CANDLESTICK TYPES SHOWN IN THIS EDUCATION
1️⃣ Shrinking Candles (Uptrend & Downtrend)
Shrinking candle bodies indicate loss of momentum .
Price may continue in the same direction, but with reduced strength and participation.
2️⃣ Change Color Candle (Uptrend & Downtrend)
A color change against the prevailing trend may indicate weakening momentum or a temporary pause .
This reflects hesitation, not a confirmed reversal.
3️⃣ Long Wick Candle (Uptrend & Downtrend)
Long wicks show price rejection .
The market attempted to move further but was pushed back, revealing opposing pressure.
4️⃣ Inverse Long Wick Candle (Uptrend & Downtrend)
Inverse long wicks suggest acceptance in one direction and rejection in the other , often near key levels or during transitions.
5️⃣ Inside Candle (Uptrend & Downtrend)
An inside candle forms within the range of the previous candle .
This represents consolidation, indecision, and temporary balance.
6️⃣ Momentum Candle
• In an uptrend : a strong bearish momentum candle may indicate sellers stepping in
• In a downtrend : a strong bullish momentum candle may indicate buyers stepping in
Momentum candles reflect sudden imbalance , not guaranteed continuation.
📌 EDUCATIONAL PURPOSE
These candlestick examples are theoretical illustrations designed to improve understanding of price behavior and market structure.
This lesson focuses on recognition and understanding, not decision-making.
If you find this educational series useful and would like to continue learning about market structure and price behavior , you may follow to stay updated with future lessons.
ETHICAL & EDUCATIONAL NOTICE
This content is presented solely for educational and analytical purposes , based on historical price data.
It does not promote or encourage any specific trading method, financial instrument, gambling, leverage, margin usage, short selling, or interest-based activity .
Readers are encouraged to align any financial activity with their own ethical, legal, and religious principles .
⚠️ DISCLAIMER
This material is strictly educational and informational .
It does not constitute financial advice, investment recommendations, or trading instructions.
The author does not provide personalized guidance.
Any decisions made based on this content are the sole responsibility of the individual.

Global Financial Market and Their Structure1. Introduction to Global Financial Markets
The global financial market is a network of institutions, instruments, and systems that facilitate the flow of capital across countries. These markets connect investors, businesses, and governments, allowing them to trade financial assets such as stocks, bonds, currencies, and derivatives. The primary function of financial markets is to allocate resources efficiently, determine asset prices, manage risks, and provide liquidity. Globalization, technological advancements, and deregulation have significantly enhanced the scope and interconnectivity of financial markets worldwide.
2. Key Components of Global Financial Markets
Global financial markets can broadly be divided into money markets, capital markets, foreign exchange markets, and derivatives markets. Each plays a distinct role in the global economy:
a) Money Markets
Money markets deal with short-term debt instruments with maturities of less than one year. They are crucial for managing liquidity in the financial system. Instruments include Treasury bills, commercial papers, certificates of deposit, and repurchase agreements. Banks, corporations, and governments participate in money markets to fund short-term needs, optimize cash reserves, and ensure efficient functioning of the broader economy.
b) Capital Markets
Capital markets involve long-term financing through the issuance of stocks and bonds. These markets are divided into primary markets, where new securities are issued, and secondary markets, where existing securities are traded. Stock exchanges like the New York Stock Exchange (NYSE) and London Stock Exchange (LSE) are central platforms in capital markets. Capital markets enable businesses to raise funds for expansion, support infrastructure development, and provide investors opportunities for wealth creation.
c) Foreign Exchange (Forex) Markets
The forex market is the largest and most liquid financial market in the world. It facilitates the exchange of currencies for trade, investment, and speculation. Participants include commercial banks, central banks, hedge funds, corporations, and individual traders. Exchange rates in this market are influenced by interest rates, economic indicators, geopolitical events, and market sentiment. The forex market plays a vital role in international trade and investment by determining currency values.
d) Derivatives Markets
Derivatives are financial instruments whose value is derived from underlying assets like stocks, bonds, commodities, or currencies. Common derivatives include futures, options, swaps, and forwards. They are used for hedging risk, speculation, and arbitrage opportunities. Global derivatives markets are critical for managing exposure to price fluctuations in interest rates, commodities, and foreign exchange, thereby adding stability to the financial system.
3. Structure of Financial Markets
The global financial market is structured into organized and over-the-counter (OTC) markets, with different layers of participants.
a) Organized Markets
Organized markets, also known as exchange-traded markets, have a centralized trading platform with standardized rules. Examples include stock exchanges, commodity exchanges, and futures exchanges. They offer high transparency, regulatory oversight, and liquidity. Trading on these platforms ensures fair pricing and reduces counterparty risk.
b) Over-the-Counter (OTC) Markets
OTC markets operate without a centralized exchange. Participants trade directly or through broker-dealers. Examples include most forex trading, corporate bonds, and certain derivatives. OTC markets are flexible, allowing tailored contracts, but they carry higher counterparty risk and lower transparency.
4. Participants in Global Financial Markets
Global financial markets comprise diverse participants, each with a specific role:
Central Banks: Regulate money supply, maintain financial stability, and control inflation. Examples include the Federal Reserve (USA), European Central Bank (ECB), and Reserve Bank of India (RBI).
Commercial Banks: Provide loans, accept deposits, and participate in money and capital markets.
Investment Banks: Facilitate capital raising, mergers, and acquisitions, and engage in trading of securities.
Institutional Investors: Pension funds, insurance companies, and mutual funds that invest large pools of capital in diverse assets.
Hedge Funds and Proprietary Traders: Engage in high-risk strategies to generate returns.
Retail Investors: Individual participants investing in stocks, bonds, or mutual funds.
Corporations: Raise capital for operations, expansions, and mergers.
Governments: Issue bonds, manage public debt, and intervene in markets to stabilize the economy.
5. Regulation and Oversight
Financial markets are regulated by governmental and international authorities to ensure stability, transparency, and investor protection. Regulatory frameworks vary by country:
United States: Securities and Exchange Commission (SEC), Commodity Futures Trading Commission (CFTC).
Europe: European Securities and Markets Authority (ESMA).
India: Securities and Exchange Board of India (SEBI), Reserve Bank of India (RBI).
International bodies like the Bank for International Settlements (BIS) coordinate global financial stability by monitoring cross-border activities and setting international banking standards.
6. Technological Advancements
Technology has transformed global financial markets by increasing speed, efficiency, and accessibility. Key innovations include:
Electronic Trading Platforms: Allow instantaneous trades in equities, forex, and derivatives.
Algorithmic Trading: Uses mathematical models to automate trading decisions.
Blockchain and Cryptocurrencies: Introduce decentralized digital assets and smart contracts.
Big Data and AI Analytics: Enhance risk management, market forecasting, and investment strategies.
These advancements have reduced transaction costs, increased transparency, and connected markets across the globe.
7. Challenges in Global Financial Markets
Despite growth and sophistication, global financial markets face challenges:
Volatility and Speculation: Rapid price movements can lead to losses and financial crises.
Systemic Risk: Interconnectedness means problems in one market can affect others globally.
Regulatory Arbitrage: Firms may exploit differences in regulations across countries.
Cybersecurity Threats: Increasing reliance on technology exposes markets to cyber attacks.
Geopolitical Risks: Conflicts, trade wars, and political instability influence market performance.
8. Conclusion
The global financial market is a complex, dynamic system critical to the functioning of the world economy. Its structure spans money, capital, forex, and derivatives markets, supported by diverse participants and technological innovations. While offering opportunities for capital formation, investment, and risk management, it also requires robust regulation and vigilance to maintain stability. Understanding the global financial market structure enables investors, policymakers, and businesses to navigate its complexities effectively and make informed financial decisions.

Global Commodity Impact: The Forces Shaping the Market 1. Introduction to Global Commodities
Global commodities are raw materials or primary agricultural products that are traded internationally, such as oil, gold, wheat, and copper. These commodities form the backbone of the global economy, influencing everything from production costs to geopolitical strategies. Understanding the dynamics of global commodities is crucial for policymakers, investors, and businesses, as fluctuations in these markets can have ripple effects across industries and countries.
The global commodities market operates on supply and demand fundamentals, but it is also heavily influenced by speculative trading, geopolitical events, and macroeconomic policies. For example, a sudden shortage of crude oil due to political unrest can spike prices globally, affecting transportation, manufacturing, and consumer goods.
2. Key Categories of Commodities
Commodities are broadly classified into three main categories:
a. Energy Commodities
Energy commodities include crude oil, natural gas, coal, and renewable energy sources. They are critical because energy costs affect almost every sector of the economy. For instance, a rise in crude oil prices increases transportation costs, which in turn drives up the price of goods.
b. Agricultural Commodities
Agricultural products like wheat, corn, soybeans, coffee, and sugar are subject to seasonal fluctuations, weather conditions, and global demand. Climate change, pests, and natural disasters can disrupt supply chains, leading to price volatility in food markets worldwide.
c. Metals and Minerals
Metals, including gold, silver, copper, and aluminum, are essential for industries such as construction, electronics, and jewelry. Precious metals like gold and silver often act as safe-haven assets during economic uncertainty, while industrial metals are more closely tied to global economic growth and industrial activity.
3. Factors Influencing Global Commodity Prices
The price of commodities is highly sensitive to various global factors, including:
a. Supply and Demand Dynamics
Basic economics governs commodity prices: when demand exceeds supply, prices rise; when supply exceeds demand, prices fall. For example, increased industrial activity in emerging markets can drive up demand for copper, while poor harvests can push grain prices higher.
b. Geopolitical Events
Political instability, wars, and trade sanctions can disrupt the supply of key commodities. For instance, conflicts in the Middle East often lead to higher oil prices due to supply uncertainty. Similarly, export restrictions by major producing countries can impact global food and metal prices.
c. Currency Fluctuations
Commodities are often priced in U.S. dollars. Therefore, fluctuations in the dollar’s value affect commodity prices globally. A weaker dollar can make commodities cheaper for foreign buyers, potentially increasing demand, while a stronger dollar can have the opposite effect.
d. Inflation and Interest Rates
High inflation often leads to increased commodity prices, as raw materials are seen as a hedge against inflation. Conversely, rising interest rates can dampen demand for commodities by increasing borrowing costs and slowing economic growth.
4. Economic Impact of Commodity Price Fluctuations
Commodity price movements can have far-reaching effects on economies worldwide:
a. Impact on Emerging Markets
Emerging economies that rely heavily on commodity exports—such as oil, minerals, or agricultural products—experience significant impacts when prices fluctuate. For instance, a drop in crude oil prices can lead to fiscal deficits in oil-exporting countries.
b. Impact on Consumers
Rising commodity prices translate into higher costs for essential goods and services, including food, fuel, and electricity. This affects household budgets and can lead to inflationary pressures.
c. Impact on Industries
Industries that rely on commodities as raw materials, such as manufacturing, construction, and transportation, are directly impacted by price changes. For example, higher steel prices increase construction costs, which can slow infrastructure development.
5. Environmental and Social Considerations
The extraction, production, and transportation of commodities have profound environmental and social consequences. Mining and drilling can lead to deforestation, water pollution, and loss of biodiversity. Agricultural practices may contribute to soil degradation and greenhouse gas emissions. Socially, commodity booms and busts can affect employment, income distribution, and migration patterns in producing regions.
6. Global Trade and Commodity Markets
Commodity markets are interconnected, and global trade plays a vital role in balancing supply and demand. Key trading hubs such as the New York Mercantile Exchange (NYMEX), London Metal Exchange (LME), and Chicago Board of Trade (CBOT) facilitate price discovery and risk management through futures contracts.
Trade policies, tariffs, and agreements also influence commodity flows. For example, free trade agreements can lower barriers, boosting commodity exports, whereas protectionist policies may restrict trade and create supply imbalances.
7. The Role of Technology and Innovation
Advancements in technology, data analytics, and artificial intelligence are transforming commodity markets. Precision agriculture, for instance, enhances crop yields and reduces waste, impacting global food supply. Similarly, digital trading platforms and algorithmic trading improve market efficiency and liquidity. Renewable energy technologies, such as solar and wind, are reshaping energy commodity demand by gradually reducing reliance on fossil fuels.
8. Future Outlook and Challenges
The global commodity landscape faces multiple challenges and opportunities:
Climate Change: Extreme weather events and changing precipitation patterns may disrupt agricultural and energy production.
Geopolitical Tensions: Conflicts, sanctions, and trade wars will continue to create volatility.
Sustainable Practices: Increasing global demand for sustainable and ethical commodities will shape production and trade policies.
Technological Disruption: Automation, renewable energy adoption, and smart supply chains will redefine commodity production and consumption.
Investors, businesses, and policymakers must adapt to these trends to manage risks and seize opportunities in the global commodity ecosystem.
9. Conclusion
Global commodities are more than just raw materials—they are the lifeblood of the world economy. Their prices influence production costs, consumer prices, and international trade, while their supply and sustainability impact environmental and social structures. Understanding the intricate web of factors that affect commodities—from geopolitics and macroeconomics to technology and climate—is essential for navigating the modern global market. Stakeholders must be proactive, resilient, and innovative to thrive amid the volatility and opportunities that global commodities present.

Understanding U.S. Federal Reserve PoliciesThe Federal Reserve (Fed), established in 1913, is the central bank of the United States. Its primary role is to maintain financial stability, ensure maximum employment, and control inflation. To achieve these objectives, the Fed implements various monetary policies, which are broadly categorized as expansionary or contractionary, depending on the economic conditions. These policies influence the supply of money, interest rates, and credit availability in the economy.
1. Structure of the Federal Reserve
The Federal Reserve consists of three key components:
Board of Governors: Located in Washington, D.C., the Board oversees the Fed’s operations and sets key policies.
Federal Open Market Committee (FOMC): Responsible for open market operations, interest rate decisions, and guiding monetary policy.
12 Regional Federal Reserve Banks: Operate across the U.S., monitoring local economic conditions and implementing Fed policies regionally.
This structure ensures that the Fed can respond both nationally and regionally to economic challenges.
2. Objectives of Federal Reserve Policies
The Fed has three main policy objectives:
Price Stability: Controlling inflation to maintain the purchasing power of the U.S. dollar.
Maximum Employment: Supporting a labor market where everyone who wants a job can find one.
Moderate Long-term Interest Rates: Ensuring borrowing costs are sustainable for businesses and households.
Balancing these objectives requires careful calibration of monetary tools, as aggressive measures to curb inflation may slow employment growth, and vice versa.
3. Tools of Monetary Policy
The Federal Reserve uses several tools to influence the economy:
a. Open Market Operations (OMO)
Open market operations are the Fed’s most frequently used tool. This involves the buying and selling of U.S. Treasury securities in the open market.
Buying securities injects liquidity into the banking system, lowers interest rates, and encourages borrowing and investment (expansionary policy).
Selling securities withdraws liquidity, raises interest rates, and helps control inflation (contractionary policy).
OMO allows the Fed to quickly adjust short-term interest rates and stabilize the financial system.
b. Discount Rate
The discount rate is the interest rate the Fed charges commercial banks for short-term loans.
Lowering the discount rate makes borrowing cheaper, increasing credit availability.
Raising the rate discourages borrowing and slows down economic activity to control inflation.
c. Reserve Requirements
Banks are required to hold a certain percentage of deposits as reserves.
Reducing reserve requirements frees up more money for lending.
Increasing reserve requirements reduces the money supply and helps manage inflation.
d. Interest on Excess Reserves (IOER)
The Fed pays interest on excess reserves held by banks.
Higher IOER encourages banks to hold more reserves, reducing lending.
Lower IOER encourages banks to lend more, stimulating economic activity.
4. Types of Federal Reserve Policies
a. Expansionary Monetary Policy
Used during economic slowdowns or recessions to stimulate growth. Key actions include:
Lowering the federal funds rate.
Reducing reserve requirements.
Buying government securities through OMOs.
The goal is to increase liquidity, boost consumer spending, and encourage business investments.
b. Contractionary Monetary Policy
Used when inflation is high or the economy is overheating. Key actions include:
Raising the federal funds rate.
Increasing reserve requirements.
Selling government securities through OMOs.
This policy reduces money supply, slows down borrowing, and helps stabilize prices.
5. Recent Trends in Federal Reserve Policies
In recent years, the Fed has adapted to modern economic challenges:
Quantitative Easing (QE): In response to financial crises, the Fed has purchased long-term securities to inject liquidity into the economy. QE lowers long-term interest rates and encourages lending.
Forward Guidance: The Fed communicates its future policy intentions to shape market expectations, providing clarity to investors and businesses.
Crisis Management Tools: During economic shocks, such as the 2008 financial crisis or the COVID-19 pandemic, the Fed employed emergency lending programs and expanded its balance sheet to stabilize markets.
6. Impact on the Economy
Federal Reserve policies directly influence:
Interest Rates: Lower interest rates encourage borrowing and investment, while higher rates control inflation.
Employment: Expansionary policies can stimulate job creation, while contractionary measures may slow employment growth.
Inflation: By controlling the money supply, the Fed can maintain price stability.
Financial Markets: Policy decisions affect stock and bond markets, exchange rates, and investor sentiment.
7. Challenges in Federal Reserve Policy
The Fed faces several challenges:
Lag Effect: Monetary policy takes time to impact the economy, sometimes months or years.
Global Factors: Global trade, geopolitical tensions, and foreign central bank policies can influence U.S. economic outcomes.
Balancing Act: The Fed must simultaneously manage inflation and employment, which often require conflicting approaches.
8. Conclusion
The U.S. Federal Reserve plays a crucial role in maintaining economic stability. Through a combination of interest rate adjustments, reserve requirements, open market operations, and unconventional tools like quantitative easing, the Fed influences economic growth, inflation, and employment. Understanding these policies is essential for businesses, investors, and policymakers to navigate the complex U.S. and global financial environment.
In an increasingly interconnected world, the Fed’s decisions not only impact the domestic economy but also have far-reaching implications for global markets. Its policies remain central to understanding the health and direction of the U.S. economy.

Floating vs Pegged Exchange Rates in the Global MarketIn the global financial system, exchange rates play a crucial role in determining how countries trade, invest, and manage their economies. At the core of exchange rate management are two dominant systems: floating exchange rates and pegged (fixed) exchange rates. Each system reflects a country’s economic philosophy, policy priorities, and level of integration with the global market. Understanding the differences between floating and pegged exchange rates is essential for policymakers, investors, traders, and businesses operating internationally.
Understanding Exchange Rate Systems
An exchange rate is the price of one country’s currency in terms of another. Exchange rate systems define how this price is determined and controlled. Broadly, global markets operate under either a floating system, where market forces dominate, or a pegged system, where governments actively manage currency values. Some countries also adopt hybrid systems, but floating and pegged regimes remain the foundational models.
What Is a Floating Exchange Rate?
A floating exchange rate is determined by supply and demand dynamics in the foreign exchange (forex) market. Governments and central banks do not set a fixed value for the currency. Instead, the currency’s price fluctuates continuously based on economic indicators, capital flows, interest rates, trade balances, political stability, and market sentiment.
Key Characteristics of Floating Exchange Rates
Currency value is market-driven
Minimal direct government intervention
High responsiveness to economic news
Continuous price volatility
Common in developed economies
Major global currencies such as the US Dollar (USD), Euro (EUR), Japanese Yen (JPY), British Pound (GBP), and Indian Rupee (INR) operate under floating or managed-floating regimes.
Advantages of Floating Exchange Rates
One of the biggest strengths of a floating exchange rate system is automatic economic adjustment. When a country faces a trade deficit, its currency tends to depreciate, making exports cheaper and imports more expensive. This natural correction helps restore balance without requiring policy intervention.
Floating rates also provide monetary policy independence. Central banks can focus on domestic goals such as inflation control and economic growth without worrying about maintaining a specific exchange rate. Additionally, floating systems reduce the need for large foreign exchange reserves, as currencies are not defended at a fixed level.
For global investors and traders, floating currencies offer liquidity and transparency, making them attractive for hedging, speculation, and long-term investments.
Disadvantages of Floating Exchange Rates
Despite their flexibility, floating exchange rates come with volatility risks. Sharp and sudden currency movements can disrupt trade, increase import costs, and create uncertainty for businesses. Developing economies with floating currencies may experience capital flight during global risk-off events, leading to rapid depreciation.
Another drawback is speculative pressure. Currency markets can sometimes overreact to news, rumors, or geopolitical tensions, causing misalignment between currency values and economic fundamentals in the short term.
What Is a Pegged Exchange Rate?
A pegged exchange rate system fixes a country’s currency value to another major currency (such as the US Dollar or Euro), a basket of currencies, or even a commodity like gold. The central bank actively intervenes in the forex market to maintain the fixed rate.
Examples include currencies pegged to the US Dollar in parts of the Middle East and previously the Chinese Yuan under a strict peg system.
Key Characteristics of Pegged Exchange Rates
Fixed or narrowly controlled currency value
Strong central bank intervention
Requirement of large foreign exchange reserves
Reduced currency volatility
Common in small or export-dependent economies
Pegged systems are often chosen by countries seeking stability, especially those with limited financial market depth.
Advantages of Pegged Exchange Rates
The primary advantage of a pegged exchange rate is stability. Fixed currency values reduce uncertainty in international trade and investment, making it easier for businesses to plan costs and revenues. This stability is particularly beneficial for economies heavily dependent on exports or imports.
Pegged systems also help control inflation, especially in countries with a history of high inflation. By anchoring the local currency to a stable foreign currency, governments can import monetary discipline and boost investor confidence.
For emerging markets, pegged rates can attract foreign direct investment (FDI) by minimizing currency risk.
Disadvantages of Pegged Exchange Rates
The biggest weakness of a pegged exchange rate system is the loss of monetary policy independence. Central banks must prioritize maintaining the peg, often at the expense of domestic economic needs such as growth or employment.
Pegged systems are also vulnerable to currency crises. If markets believe a peg is unsustainable, speculative attacks can rapidly drain foreign exchange reserves. Historical examples include the Asian Financial Crisis of 1997, where several fixed exchange rate regimes collapsed.
Maintaining a peg requires substantial reserves and continuous intervention, which can be costly and unsustainable during prolonged economic stress.
Floating vs Pegged: A Direct Comparison
Floating exchange rates offer flexibility, resilience, and independence, making them suitable for large, diversified economies with mature financial markets. Pegged exchange rates provide predictability and stability, which can benefit smaller or developing economies but at the cost of policy freedom.
In times of global shocks—such as financial crises, pandemics, or geopolitical conflicts—floating currencies absorb stress through price movements, while pegged currencies rely on reserves and policy measures to defend their value.
Impact on Global Trade and Capital Flows
Floating exchange rates influence global capital flows by reacting quickly to interest rate changes and economic data. Investors shift funds across borders, causing currencies to appreciate or depreciate accordingly. This dynamic environment supports efficient capital allocation but increases short-term volatility.
Pegged exchange rates, on the other hand, create predictable trade relationships but can distort capital flows. Artificially fixed rates may encourage excessive borrowing or asset bubbles if the peg does not reflect economic fundamentals.
Role of Central Banks in Both Systems
In floating regimes, central banks act primarily as stability managers, intervening only during extreme volatility. In pegged systems, central banks become active market participants, constantly buying or selling currency to maintain the fixed rate.
This difference fundamentally shapes a country’s economic policy framework and crisis response capabilities.
Conclusion: Choosing the Right Exchange Rate System
There is no universally “better” exchange rate system. The choice between floating and pegged exchange rates depends on a country’s economic size, development stage, trade structure, financial market maturity, and policy credibility.
In today’s interconnected global market, most major economies prefer floating exchange rates for their flexibility and shock-absorbing capacity, while some smaller or strategically positioned economies continue to rely on pegged systems for stability. Understanding these systems provides critical insight into global currency movements, international trade dynamics, and investment decisions.
Both floating and pegged exchange rates remain integral to the functioning of the global financial system, shaping economic outcomes across borders every day.

Descending traingle is forming next week Expected move.As we can see market is forming descending traingle if it break level of 1.17065 massive fall will occour so plan your trade accordingly.

Perfect shape of Morning Star and Evening StarAs you can see, this forms a perfect Morning Star and Evening Star pattern, where the structure is clearly defined by strong momentum candles, a clear rejection zone, and proper candle sequencing that confirms the potential trend reversal.

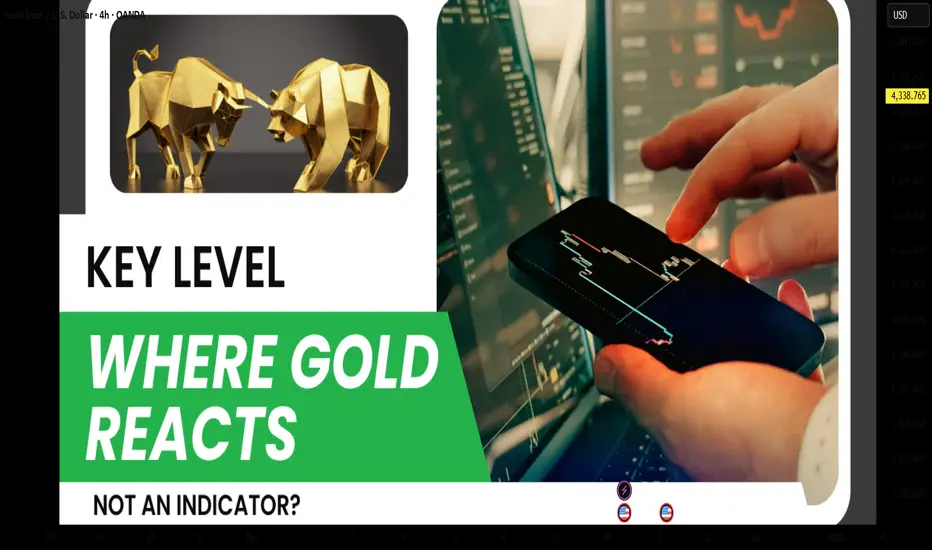
Key Levels – Where Gold Reacts, Not Indicators?Many traders start trading gold using indicators, and that’s something almost everyone goes through. However, the longer you stay in the market, the more clearly you realize one important truth: gold does not react to indicators; it reacts at key levels . Indicators only describe what price has already done, while key levels are where real money actually makes decisions.
Price does not move randomly. It reacts at important price zones.
Key levels are areas where the market has shown clear reactions in the past — strong reversals, repeated rejections, or consolidation before a breakout. In gold trading, these zones often align with major highs and lows, round numbers, or areas of concentrated liquidity.
This is where both retail traders and large capital are paying attention.
One major reason many traders consistently enter too late is over-reliance on indicators. Indicators are always based on past price data, so when a signal appears, the key reaction has often already happened. At that point, entries are less attractive, risk-to-reward deteriorates, and the probability of false breaks or stop hunts increases.
Indicators are not wrong, but they always lag behind price.
Professional traders don’t try to predict whether price will go up or down. They wait for price to reach a key level and then observe how the market reacts. Is price strongly rejected, or does it break through easily? Is real buying or selling pressure actually showing up?
Key levels are not places to predict — they are places to observe and react.
This doesn’t mean indicators are useless. Indicators still have value for momentum confirmation or for understanding market context. But they should not be the primary factor for making entry decisions.
Key levels tell you where to trade.
Indicators only help you understand how price is behaving.
Conclusion
If you are trading gold and still searching for the “best indicator for XAUUSD,” you may be asking the wrong question.
The better question is:
Which key level is the market respecting right now?
Because in the end, price reacts at levels — not at indicators.
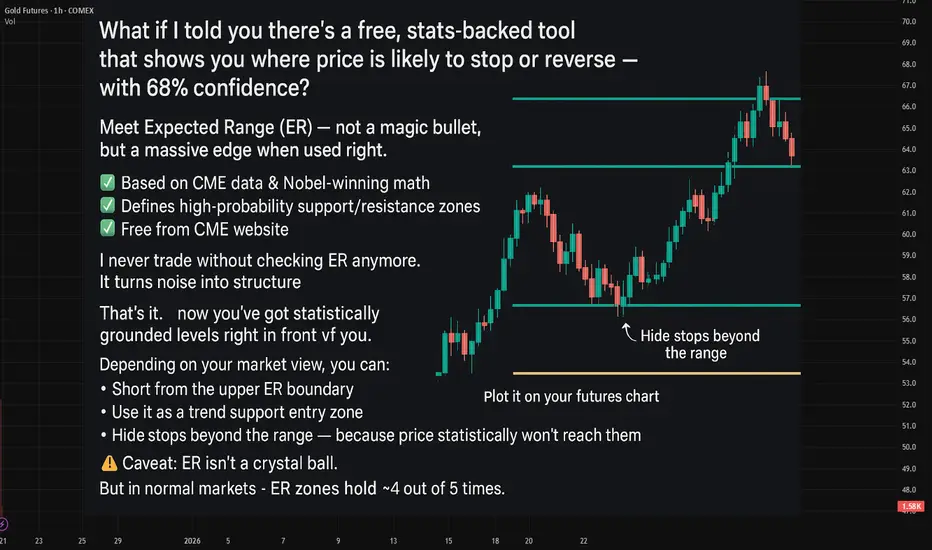
Last week Expected Ranges levels in actionQuick Recap: Last week Expected Ranges levels in action
What is Expected Range Volatility (ER)?
The Expected Range (ER) is a framework that helps traders understand how much an asset is likely to move within a specific timeframe. Based on CME market data and Nobel Prize-winning calculations, price movements within the expected volatility corridor have a 68%-95% probability of staying within those boundaries.
Crude Oil - 6 reactions to levels🔥
EUR - 4 reactions to levels
BTC - 3 reactions
GOLD - 1 reaction to levels
It's really an amazing tool to enhance your market entry💲
!!! - It doesn't guarantee trades every day.
!! it's better to combine it when working with the trend and when there's a clear sideways movement.
Understanding Currency ConvertibilityWhat is Currency Convertibility?
Currency convertibility refers to the ease with which a country’s currency can be converted into foreign currencies without restrictions imposed by the government or central bank. When a currency is fully convertible, individuals, businesses, and investors can freely exchange it for another currency for any purpose—trade, travel, investment, or capital transfers.
For example, if an Indian exporter earns US dollars, currency convertibility determines whether and how easily those dollars can be converted into Indian rupees or reinvested abroad. Similarly, foreign investors assess convertibility before investing, as it affects their ability to repatriate profits and capital.
Why Currency Convertibility Matters
Currency convertibility is not just a technical financial concept; it has broad economic implications:
Facilitates International Trade
Convertibility allows exporters and importers to settle cross-border transactions smoothly, reducing friction in global trade.
Encourages Foreign Investment
Investors prefer countries where profits and capital can be freely repatriated, making convertible currencies more attractive.
Integrates Economies Globally
Convertibility helps integrate domestic financial markets with global markets, improving efficiency and competitiveness.
Signals Economic Confidence
A convertible currency often reflects confidence in a country’s economic fundamentals and monetary stability.
Types of Currency Convertibility
Currency convertibility is broadly classified into three main types:
1. Current Account Convertibility
This allows free exchange of currency for transactions related to trade in goods and services, remittances, interest payments, and tourism. Most countries, including India, have current account convertibility.
Example:
An Indian student paying tuition fees abroad or an exporter receiving payment in foreign currency falls under current account transactions.
2. Capital Account Convertibility
Capital account convertibility permits free movement of capital across borders for investments such as foreign direct investment (FDI), portfolio investment, real estate purchases, and loans.
This form is more sensitive because unrestricted capital flows can expose economies to volatility. Hence, many developing nations impose partial controls.
Example:
An Indian investor buying foreign stocks without limits would require full capital account convertibility.
3. Full Convertibility
A currency is fully convertible when both current and capital account transactions are unrestricted. Major global currencies like the US Dollar, Euro, British Pound, and Japanese Yen are fully convertible.
Partial vs Full Convertibility
Many emerging economies adopt partial convertibility as a balanced approach. Under this system:
Trade and service-related transactions are liberalized.
Capital flows are regulated through limits, approvals, or sector-specific controls.
This allows countries to enjoy the benefits of globalization while safeguarding against sudden capital flight and financial instability.
Advantages of Currency Convertibility
Boosts Trade and Exports
Easier currency exchange reduces transaction costs and improves competitiveness of exporters.
Attracts Foreign Capital
Convertible currencies signal openness and stability, attracting FDI and portfolio investments.
Improves Resource Allocation
Capital flows to sectors with higher returns, increasing overall economic efficiency.
Enhances Financial Market Development
Convertibility encourages deeper bond, equity, and forex markets.
Strengthens Global Integration
Countries with convertible currencies participate more actively in global financial systems.
Risks and Challenges of Currency Convertibility
Despite its advantages, currency convertibility also carries significant risks:
Capital Flight Risk
Sudden withdrawal of foreign capital during economic or political instability can destabilize the economy.
Exchange Rate Volatility
Free capital flows can lead to sharp currency fluctuations, affecting trade and inflation.
Loss of Monetary Control
Central banks may find it harder to control money supply and interest rates under full convertibility.
Exposure to Global Shocks
Global financial crises can quickly transmit to domestic markets through capital flows.
Speculative Attacks
Weak economies with open capital accounts may face speculative pressure on their currencies.
Currency Convertibility and Developing Economies
For developing countries, currency convertibility is a strategic decision rather than a binary choice. Gradual liberalization is often preferred to ensure:
Strong banking systems
Adequate foreign exchange reserves
Fiscal discipline
Stable inflation
India, for instance, adopted current account convertibility in the 1990s while cautiously liberalizing the capital account. This phased approach helped balance growth with stability.
Role of Central Banks and Governments
Central banks play a vital role in managing currency convertibility by:
Regulating foreign exchange markets
Managing reserves
Monitoring capital flows
Intervening during excessive volatility
Governments complement this by maintaining sound fiscal policies, regulatory oversight, and transparent financial systems.
Currency Convertibility in the Era of Globalization
With globalization, digital payments, and cross-border investments, currency convertibility has become even more relevant. However, recent trends show that even advanced economies may impose temporary controls during crises, highlighting that convertibility is dynamic and policy-driven rather than absolute.
Conclusion
Understanding currency convertibility is essential for grasping how modern economies function in a globalized world. It influences trade, investment, exchange rates, and financial stability. While full convertibility offers greater integration and efficiency, it also exposes economies to external risks. Therefore, the optimal level of convertibility depends on a country’s economic strength, financial maturity, and policy preparedness.
A well-managed convertibility framework—supported by strong institutions, prudent regulation, and sound macroeconomic policies—can serve as a powerful engine for sustainable growth and global economic participation.

Quantitative Algorithmic Trading in the Global MarketData-Driven Strategies for Modern Finance
Quantitative algorithmic trading, often called quant trading, represents the convergence of finance, mathematics, statistics, and computer science. In the global market—spanning equities, commodities, forex, fixed income, and derivatives—quantitative trading has transformed how capital is deployed, risks are managed, and opportunities are identified. Instead of relying on intuition or discretionary decision-making, quant trading uses data-driven models and automated algorithms to execute trades with speed, precision, and discipline across international markets.
Understanding Quantitative Algorithmic Trading
At its core, quantitative algorithmic trading involves creating mathematical models that identify trading opportunities based on historical and real-time data. These models are translated into algorithms that automatically place buy or sell orders when predefined conditions are met. The trader’s role shifts from manual execution to designing, testing, and refining strategies.
In global markets, quant trading operates across multiple exchanges, time zones, and asset classes. This global reach allows algorithms to exploit inefficiencies arising from market fragmentation, differing regulations, currency fluctuations, and regional economic cycles.
Evolution of Quant Trading in Global Markets
Quantitative trading began with simple statistical arbitrage strategies in developed markets such as the United States and Europe. Over time, advances in computing power, access to large datasets, and the growth of electronic exchanges expanded its scope. Today, quant trading dominates volumes in major global markets, particularly in equities and foreign exchange.
Emerging markets have also seen rapid adoption as infrastructure improves and liquidity deepens. Global hedge funds, proprietary trading firms, and institutional investors deploy algorithms that operate 24 hours a day, adapting to market conditions in Asia, Europe, and the Americas.
Key Components of a Quant Trading System
A successful quantitative trading system typically consists of several interconnected components. First is data acquisition, which includes price data, volume, order book information, macroeconomic indicators, corporate fundamentals, and alternative data such as news sentiment or satellite data. In global markets, handling data from multiple sources and ensuring consistency across regions is a major challenge.
Second is model development, where statistical techniques, machine learning, or econometric models are used to identify patterns and predict price movements. These models are backtested using historical data to evaluate performance under different market conditions.
Third is execution logic, which determines how trades are placed to minimize costs such as slippage and market impact. In global markets, execution algorithms must account for varying liquidity, trading hours, and regulatory constraints.
Finally, risk management is embedded into the system to control exposure, limit drawdowns, and ensure capital preservation across volatile global environments.
Types of Quantitative Trading Strategies
Quantitative strategies in global markets can be broadly classified into several categories. Statistical arbitrage strategies exploit pricing inefficiencies between related instruments, such as pairs trading across international exchanges or ADRs versus local shares.
Trend-following strategies identify and ride sustained price movements across global asset classes. These strategies are popular in futures and forex markets, where macroeconomic trends often play out over long periods.
Mean-reversion strategies assume that prices revert to historical averages. These are commonly used in equity markets and volatility trading.
High-frequency trading (HFT) focuses on extremely short time frames, using speed and micro-price movements to generate profits. While controversial, HFT plays a significant role in global market liquidity.
Machine learning-based strategies use advanced algorithms to detect complex, nonlinear relationships in data. These approaches are increasingly popular as data availability and computing power expand.
Advantages of Quant Trading in Global Markets
One of the biggest advantages of quantitative algorithmic trading is objectivity. Decisions are based on data and rules, reducing emotional bias. This is particularly important in global markets, where geopolitical events, policy decisions, and sudden shocks can trigger extreme volatility.
Another key benefit is scalability. Algorithms can simultaneously monitor and trade hundreds of instruments across multiple countries, something impossible for manual traders. This allows firms to diversify strategies and reduce dependence on a single market.
Speed and efficiency are also critical advantages. Automated systems can react to market changes in milliseconds, capturing opportunities before they disappear. In global markets with overlapping trading sessions, this speed is a competitive edge.
Challenges and Risks
Despite its advantages, quantitative trading faces significant challenges. Model risk is a major concern—strategies that perform well in historical tests may fail in live markets due to changing conditions. Global markets add complexity due to differing regulations, political risks, and currency exposure.
Data quality and availability can also be problematic, especially in emerging markets where historical data may be limited or unreliable. Poor data can lead to flawed models and unexpected losses.
Technology and infrastructure risk is another factor. System failures, latency issues, or cyber threats can disrupt trading operations, potentially leading to large losses.
Regulation and Ethical Considerations
Global regulators closely monitor algorithmic trading due to its impact on market stability. Different countries impose varying rules on order types, position limits, and reporting requirements. Quant traders operating globally must ensure compliance with multiple regulatory frameworks.
Ethical considerations also arise, particularly around market fairness and transparency. Responsible quant trading emphasizes liquidity provision and risk control rather than exploitative practices.
The Future of Quantitative Algorithmic Trading
The future of quant trading in global markets is closely tied to technological innovation. Artificial intelligence, alternative data, and cloud computing are reshaping how strategies are developed and deployed. As markets become more interconnected, cross-asset and cross-border strategies will gain importance.
At the same time, competition is intensifying. Alpha is becoming harder to find, pushing quants to focus on better risk management, execution efficiency, and innovation rather than pure prediction.
Conclusion
Quantitative algorithmic trading has become a cornerstone of modern global financial markets. By leveraging data, technology, and systematic processes, it enables traders and institutions to operate efficiently across borders and asset classes. While challenges such as model risk, regulation, and market complexity remain, the disciplined and scalable nature of quant trading ensures its continued dominance in the global market landscape.
Why This Support Held | Market Pressure Explained #2🧠 WHY THIS SUPPORT HELD | MARKET PRESSURE EXPLAINED #2 (EURNZD)
This chart illustrates how price stability and continuation can emerge from collective market participation , rather than from candlesticks or indicators in isolation.
📌 In this historical example, s upport held due to sustained buy-side interest becoming visible across multiple timeframes , particularly as price approached previously established support areas.
Key observations include:
• Increased market participation near higher-timeframe support
• Price compression followed by renewed directional activity
• Alignment of structural price zones across timeframes
• Gradual absorption of selling pressure
• Continuation supported by overlapping participation behaviors
📊 Candlesticks do not cause price movement.
They reflect past interactions between buyers and sellers.
🧠 Understanding market behavior is clearer when focusing on
how different participants may interact at specific price areas , rather than treating indicators as standalone decision tools.
📘 This content is provided solely for educational and explanatory purposes , aiming to improve understanding of market structure and price behavior based on historical data.
⚠️ DISCLAIMER
This material is strictly educational and informational.
It does not constitute financial advice, trading instructions, or a recommendation to engage in any financial activity.
The author does not offer personalized guidance.
Any decisions made based on this content are entirely the responsibility of the individual.

Market Panic: Gold or Crypto?When the market enters a state of panic, the question is no longer “How much profit can I make?” but rather “Which asset helps me survive and protect my capital?”
In moments like these, gold and crypto are often placed side by side. Both are seen as safe havens—but in very different ways, and that difference is the key to making the right decision.
1) Gold – Where Capital Flows When Confidence Breaks
Gold has existed for thousands of years with one core purpose: preserving value.
When inflation rises, geopolitical tensions escalate, or the financial system shows signs of stress, large capital tends to move into gold first.
Why gold performs well during crises:
High global liquidity, accepted across all markets
Relatively “orderly” volatility, suitable for defensive positioning
Often benefits when real interest rates fall and the USD weakens
In other words, gold won’t make you rich overnight, but it helps you avoid being washed away when the storm hits.
2) Crypto – An Asset Driven by Expectations and Emotion
Crypto represents a new generation of assets, where value is heavily influenced by future expectations, technology narratives, and speculative capital.
In normal or euphoric market conditions, crypto can rise very quickly.
But when panic sets in, the story changes.
Here’s the reality we need to face:
Crypto reacts extremely sensitively to “risk-off” sentiment
High leverage + thin liquidity during stress periods can trigger chain liquidations
In major shocks, crypto is often sold alongside growth stocks, rather than acting as a true safe haven
Therefore, crypto is not a defensive asset in the traditional sense—it is an asset of belief and market cycles.
3) When Should You Choose Gold? When Should You Hold Crypto?
The answer is not “which is better,” but what the market context is.
True panic (systemic risk, war, financial crisis):
➡ Gold is usually the preferred choice.
Capital seeks certainty, not stories.
Short-term crisis followed by monetary easing:
➡ Gold often leads the first wave,
➡ Crypto tends to recover more aggressively after a psychological bottom forms.
Stable markets with abundant liquidity:
➡ Crypto performs at its best.
4) My Perspective: Don’t Choose with Emotion
From my experience, the biggest mistake traders make during panic is choosing assets based on personal belief instead of capital flow and market behavior.
A professional trader asks:
Where is large capital taking refuge?
Is current volatility suitable for my trading style?
Is my goal capital preservation or outsized returns?
If your priority is safety and stability, gold is usually the more reasonable choice.
If you accept high risk in pursuit of high reward, crypto should only be approached after clear confirmation, not during extreme panic.

You Don’t Lose by Being Wrong — You Lose by OveranalyzingYour problem isn’t that you don’t understand the market.
In fact, most losing traders understand the market fairly well. They know what a trend is, where key levels sit, and which side the structure is leaning toward. But when it’s time to make a decision, they sabotage that edge with something very familiar: just a little more analysis.
At first, everything is clear. The chart tells a simple story.
Then doubt creeps in. You zoom into another timeframe. Add another zone. Add another tool. Not because the market demands it, but because you’re not ready to accept the risk of a decision. And with every extra layer of analysis, you don’t gain more certainty — you create another narrative.
This is the key point many traders miss:
the market hasn’t changed — the story in your head has.
When you overanalyze, you’re no longer reading the market; you’re negotiating with yourself. One timeframe says buy, another says wait. One level looks valid, another suddenly looks dangerous. In the end, you’re no longer searching for a good opportunity — you’re searching for reasons to delay or reverse a decision. And by the time you enter, you’re either late or lacking conviction.
Overanalysis also destroys your sense of informational weight.
On a chart, not all data carries equal value. A price level in the right context is worth more than ten minor signals. But when everything is marked, everything looks “important,” and you lose sight of what’s actually worth risking money on. The market needs prioritization, not enumeration.
Here’s an uncomfortable truth:
Many traders overanalyze not because they’re curious, but because they’re afraid to commit. They fear being wrong, so they look for more confirmation. But the market doesn’t reward the trader with the most confirmations. It rewards the trader who accepts risk at the right location. Every time you delay a decision through analysis, you move yourself further away from that location.
I only started trading better when I realized this:
analysis is not meant to make decisions certain — it’s meant to make them reasonable.
Beyond that point, what matters is discipline and acceptance of outcomes. The market doesn’t require you to be right 100% of the time. It only requires that you don’t break your own structure.
If you often find yourself “right on direction but wrong on results,” try cutting back on analysis. Not to oversimplify the market, but to clarify what truly matters. When the picture is already clear, adding detail doesn’t make it better — it just makes you hesitate.
And in trading, hesitation is often more expensive than being wrong.

Why This Support Held | Market Pressure Explained #1🧠 WHO REALLY MOVES THE MARKET? (NZDJPY)
This chart is presented for educational purposes only and illustrates
how price movement can emerge from collective market participation ,
rather than from individual indicators or candlestick patterns in isolation.
📌 In this historical example, increasing market pressure developed through the alignment of multiple forms of participation , including:
• Reactions around support and resistance zones
• Structural price compression and expansion
• Pullback-related participation within existing structure
• Trendline-related price behavior
• Observed changes in participation intensity over time
🔥 When several forms of market participation overlap in the same direction,
price movement may expand as a result of accumulated pressure.
Candlesticks do not cause price movement.
They reflect past interactions between buyers and sellers.
🧠 This content focuses on understanding market structure and participation ,
not on predicting future price movement or suggesting actions.
📘 The instrument shown is used solely for explanatory and visual clarity .
Any application of these concepts should be aligned with individual responsibility, ethical considerations, and applicable religious or legal guidelines.
⚠️ DISCLAIMER
This content is provided strictly for educational and informational purposes only.
It does not constitute financial advice, trading instructions, or a recommendation to engage in any financial activity.
The author does not provide personalized guidance.
Any decisions made based on this material are solely the responsibility of the individual.

Why This Resistance Failed | Market Pressure Explained #1🧠 WHO REALLY MOVES THE MARKET? (CHFJPY)
This chart illustrates how price movement emerges from collective market participation ,
not from candlesticks in isolation.
📌 In this example, strong bullish pressure developed as a result of multiple participant behaviors aligning in the same direction , including:
📐 Participants reacting to support & resistance zones
📊 Participants observing chart formations
📉 Participants referencing Fibonacci-based price areas
🔄 Participants responding to pullbacks within structure
📈 Participants observing moving-average-related price behavior
🔥 When multiple forms of market participation overlap, price movement tends to expand.
Candlesticks do not cause price movement.
They reflect past interactions between buyers and sellers.
🧠 To understand market behavior more clearly, it is useful to focus on
who may be participating at different price areas , rather than treating indicators as standalone signals.
📘 This analysis is intended to explain market structure and price behavior , not to suggest specific actions.
If you’d like to continue exploring how market participation shapes price movement,
you can follow for future educational content.
⚠️ DISCLAIMER
This content is provided strictly for educational and informational purposes only.
It does not constitute financial advice, trading instructions, or a recommendation to engage in any financial activity.
The author does not provide personalized guidance.
Any decisions made based on this material are solely the responsibility of the individual.

Understanding Candlesticks Within Market Structure | Tutorial #1Candlesticks + Support & Resistance in an Uptrend (Contextual Analysis)
In this tutorial, we developing an understanding of market context by observing how candlesticks behave within a bullish market environment.
Rather than viewing candlesticks as independent signals, this lesson focuses on how price behavior interacts with Support & Resistance levels during an uptrend , from a purely analytical and educational perspective.
The goal is to explain market behavior and structure , not to instruct or encourage any form of trading activity.
⚠️ Important Note
If anything on the chart is unclear, feel free to ask questions in the comments, and I will clarify the conceptual logic behind the price behavior shown.
If the material feels complex at first, that is completely normal.
This series is focused on building foundational understanding step by step , not on decision-making or execution.
📌 Chart Explanation (EURJPY Example)
On the chart, the following elements are highlighted:
1️⃣ Candlesticks
→ Illustrate how price reacts after pullbacks and pauses within a broader upward structure.
2️⃣ Support & Resistance Zones
→ Areas where price has historically shown repeated reactions.
3️⃣ Market Structure
→ Higher highs and higher lows, which define an upward structural environment.
4️⃣ Directional Arrows
→ Visual references to help distinguish between impulsive movements and corrective phases within the trend.
These elements are shown solely to explain market structure and price interaction , not to imply or suggest any action.
🧠 Why Context Matters in an Uptrend
👉 Support & Resistance as contextual reference points
Candlesticks, on their own, do not carry inherent meaning.
They become informative only when analyzed within market structure and key price areas.
In an uptrend, price often displays different behavior during pullbacks compared to trend reversals.
Understanding this distinction is essential for accurate market interpretation , not for execution.
📊 Step-by-Step Market Interpretation
1️⃣ Recognizing an upward market structure
→ Higher highs and higher lows
2️⃣ Identifying relevant Support & Resistance areas
→ Zones where price previously reacted
3️⃣ Observing candlestick behavior near these areas
→ Sequences, momentum shifts, and pressure buildup
These steps are presented to organize analytical thinking , not to guide participation in the market.
🔍 Additional Observational Elements
When certain candlestick formations appear after a pullback—such as stronger momentum candles or engulfing structures—they are often discussed in technical analysis literature as signs of renewed buying pressure.
It is important to understand that:
No single candle has predictive power on its own
Observations are probabilistic, not deterministic
Market behavior is interpreted, not guaranteed
🛡 General Risk Awareness (Educational Context)
No market pattern guarantees any outcome.
Financial markets involve uncertainty by nature.
Anyone studying these concepts should understand that:
Analysis does not equal results
Knowledge does not remove risk
Learning should always precede real-world application
This content does not encourage participation , but rather explains analytical frameworks used in market study.
👀 What’s Next?
In the next tutorial, we will introduce the concept of areas of confluence in an uptrend.
We’ll focus on how different forms of analysis can align in the same region on the chart , increasing its structural relevance from a technical perspective.
The goal is to improve contextual understanding of price behavior , not to provide trading instructions.
Follow to continue learning about market structure and price behavior
⚠️ DISCLAIMER
This content is provided strictly for educational and informational purposes only.
It does not constitute financial advice, trading instruction, or a recommendation to engage in any financial activity.
The author does not provide personalized advice.
Any actions taken based on this content are solely the responsibility of the individual.

EURJPY-Educational TipEducational Tip: When price stays in a range for a long time, the probability increases that a whale (big player) will break it from one side. Look at this pair— what a great opportunity it was for an earlier entry into the position without missing the move.
The background trend is strongly bullish, and in the end, price couldn't even reach the channel bottom—this in itself is a signal for early entry. If we had entered at the point marked with the yellow line, we wouldn't have missed this move.
You might say, "It's easy to say this now that it's clear," but the truth is: with proper money management, there's no fear of getting stopped out.
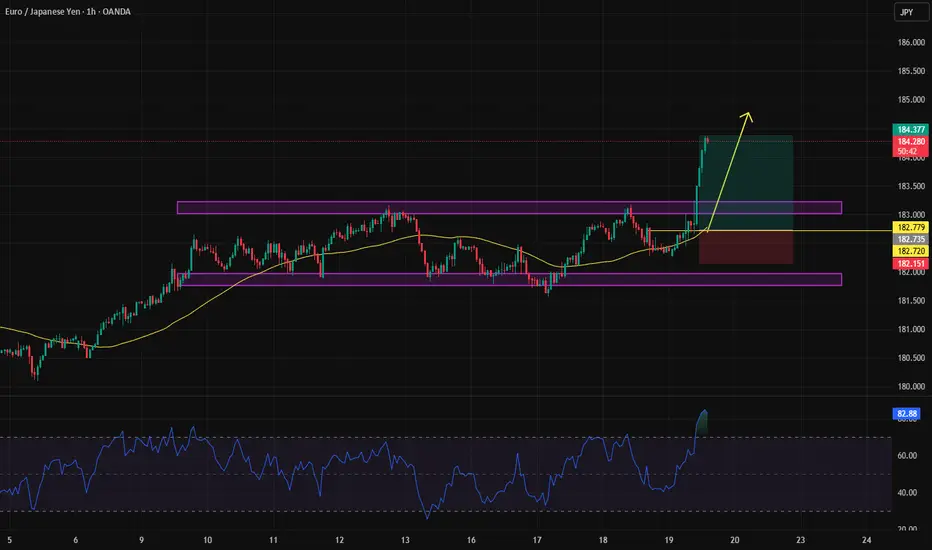
| This Chart Shows How We Look at BTC Halving & Market Cycles | This chart shows how we look at BTC halvings and market cycles. Every cycle follows a similar structure — accumulation, expansion, distribution, reaccumulation — but the way it plays out is never the same. That’s the key part most people miss.
Yes, around 539 days have already passed since the last halving, but so far what we’ve really seen is BTC printing a new ATH. And that alone does not define the start of a bull market. BTC making an ATH has happened before without a proper broad market expansion right away.
For us, the real confirmation comes from ETH. Once ETH prints a new ATH — or at least starts hovering close to it — that’s when we can say the bull market has actually started. Only then do we expect the kind of expansion most people are waiting for, especially on alts. Until that happens, everything before it is just positioning and volatility.
We’ve said it before and we’ll say it again: every bull run is different. This one is no exception. Too many people were waiting for the bull run to “just work” the same way it always did. When expectations become that obvious, markets rarely deliver in a clean way.
The most logical outcomes in that case are either delaying the bull run or aggressively taking liquidity — exactly like the recent dip that wiped out a lot of positions and shook people out. Bigger players need fuel, and that fuel comes from impatience.
So no, this doesn’t mean the bull run is cancelled. It means it’s evolving differently. BTC did its part by making a new ATH. Now the market is waiting on ETH. Once that happens, the smaller bull run most people are hoping for can finally kick off.
Until then, patience, positioning, and understanding the cycle matters more than hype.
