Gold/Oil Signaling Market Is In A Super Bubble Gold = Fear
Oil = how strong the economy is.
Except for COVID we have never seen such an extreme reading. Yet people are buying up stocks like we will never again be able to produce another stock again as long as we live!
Tulips!
Here are just a few of the factors to consider that make this indic

The best trades require research, then commitment.
Get started for free$0 forever, no credit card needed

Scott "Kidd" PoteetThe unlikely astronaut

Where the world does markets
Join 100 million traders and investors taking the future into their own hands.
Major indices

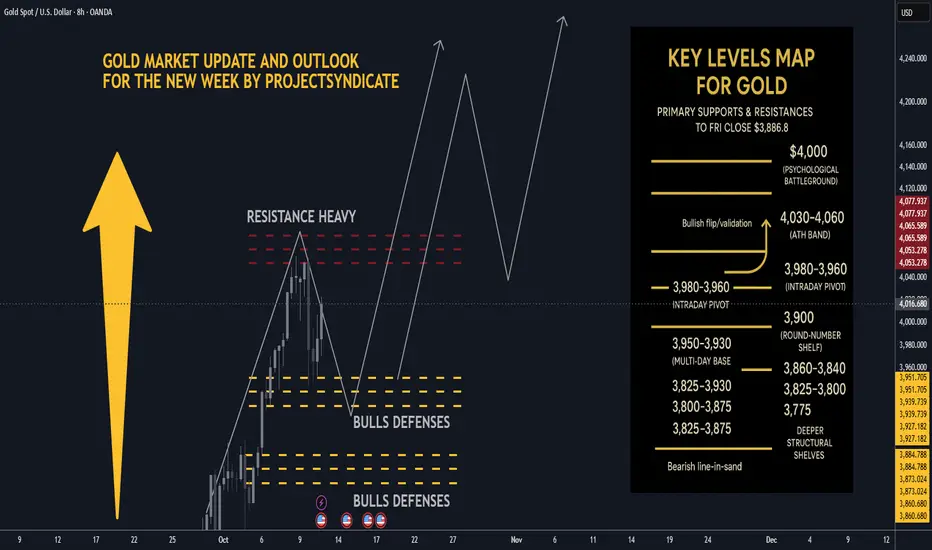
Gold next week: Key S/R Levels and Outlook for Traders🏆 Friday’s Close & Recent ATH:
Gold XAUUSD closed Friday around ~$3,990–$4,020/oz depending on venue most consolidated feeds show prints near $3.99–$4.02k at Friday close. The nearest recent intraday highs printed in the $4,030–$4,060 area across data providers this week, putting $4,000 as the imm
EURUSD: Downtrend will Continue in ChannelHello everyone, here is my breakdown of the current Euro setup.
Market Analysis
The price action has been clearly bearish, with the market being guided lower by a well-defined Downward Channel. This structure has been in place for some time, creating a series of lower highs and lower lows after

AUDUSD Eyes 0.64500 Support as Bullish Structure Holds FirmHey Traders,
In today’s session, we’re closely monitoring AUDUSD for a potential buying opportunity around the 0.64500 zone. The pair continues to trade within a broader uptrend, and the current pullback appears to be a healthy correction toward a key support and resistance confluence near 0.64500.

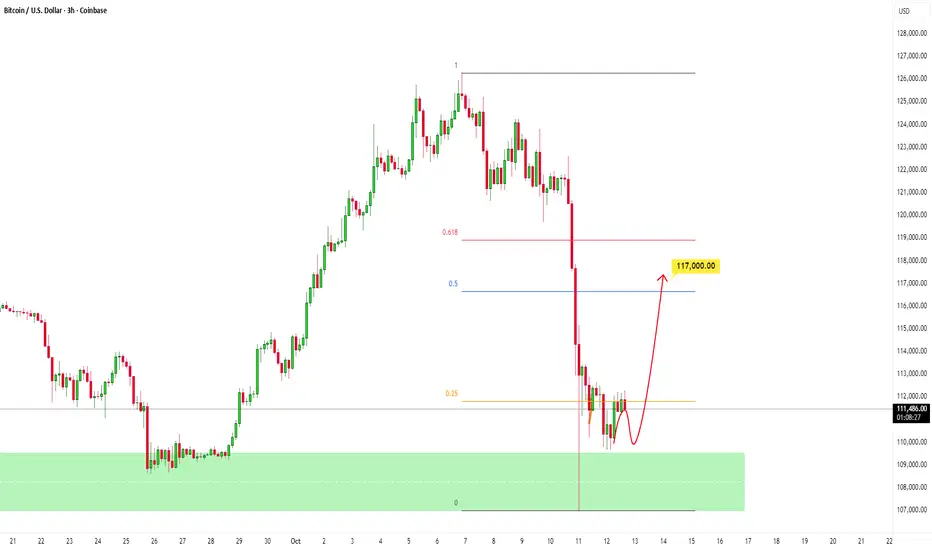
BTC to Retrace to Key Fibonacci level after Heavy SelloffPrice experienced a sharp and aggressive selloff and now, after a strong rejection from key level, the market is consolidating, showing early signs of stabilization as sellers begin to lose momentum.
If buyers can defend this area and push price higher, the next logical target lies around the Fibon
Will EU go up this time?Hi traders,
Last week EU started with a gap down and dropped to take the lower liquidity.
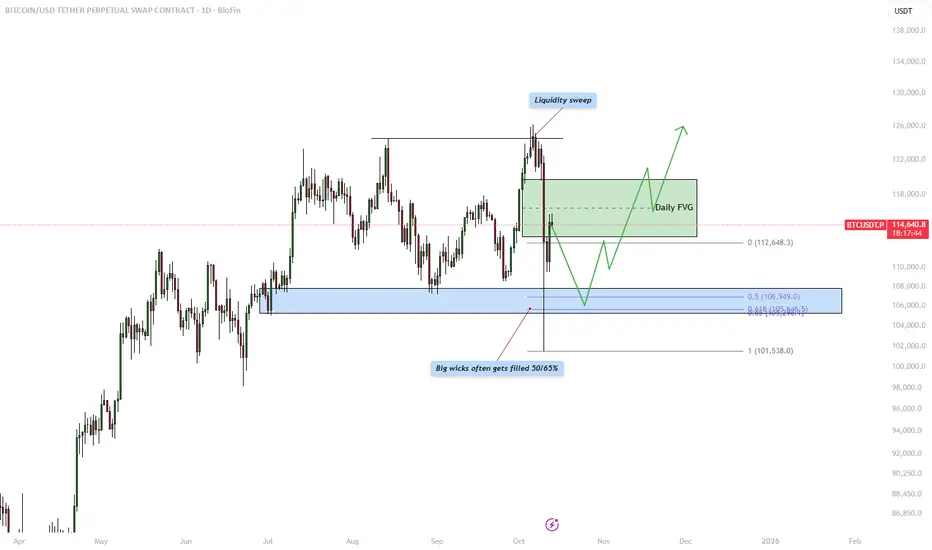
Next week we could see price come into the lower Daily FVG and reverse from there. It still looks like that the downmove is corrective and this pair goes up one more time to finish a big ending diagonal into

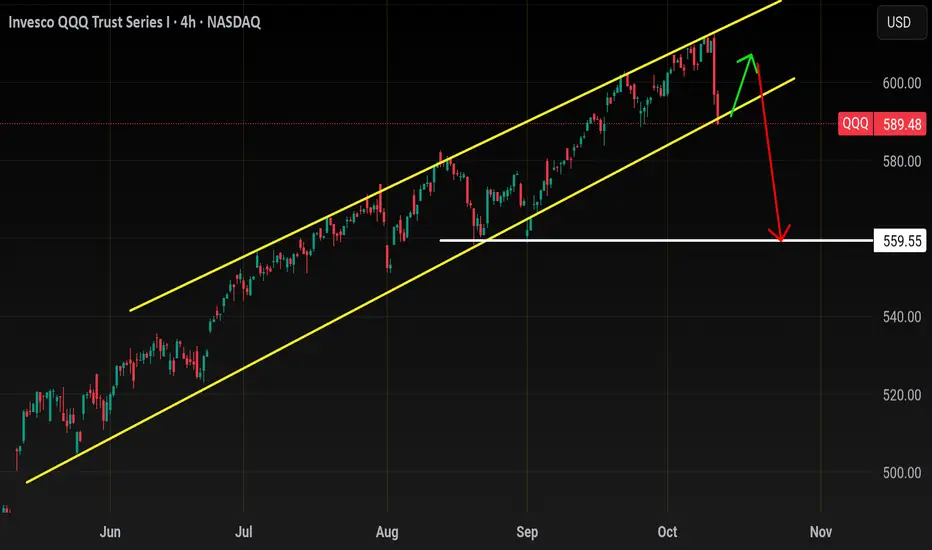
QqqBeen awhile since I went over Tech..
Let's start off with a bigger picture
Zooming out you can see that we've tagged our long term resistance since sept
Zooming in but staying on the weekly
You'll notice the reversal weekly bearish engulfing and also the volume..
The candle alone is is n
Silver just hit a record high but a double‑top signals pullback!After a strong rally to new records spurred by safe-haven demand and new entrants, silver is now testing critical support levels near $47‑$48 amid the recent Gaza ceasefire news, forming a classic double‑top pattern that may turn into a long-term Cup & Handle that could place price action in a handl

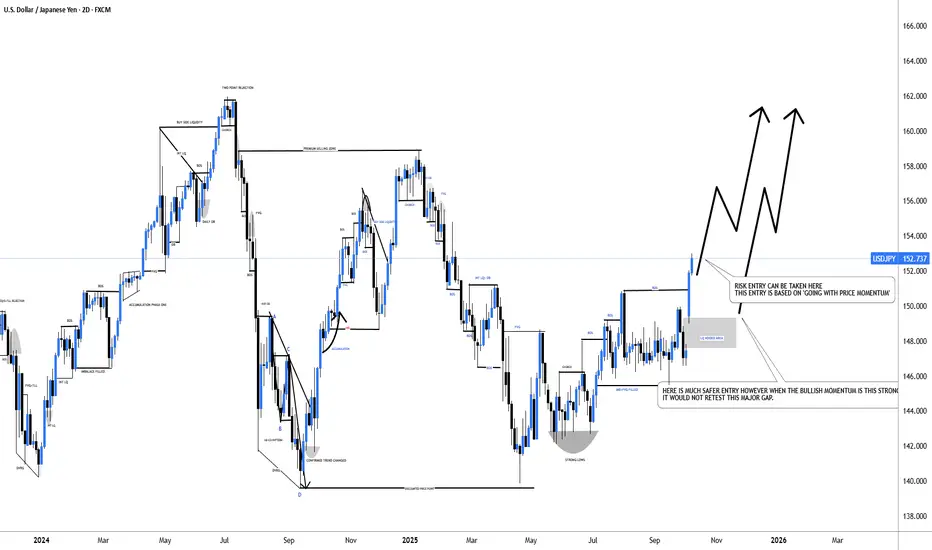
#USDJPY: From +1100 Pips To +1350 Pips A Possible Swing BuyDear Traders,
I hope you’re all having a great trading week!
The USDJPY is currently trading in a 152 price range and is experiencing extreme bullish momentum. The price is rallying without making any corrections, primarily due to the collapse of the Yen. We may see it fall further below. Given th
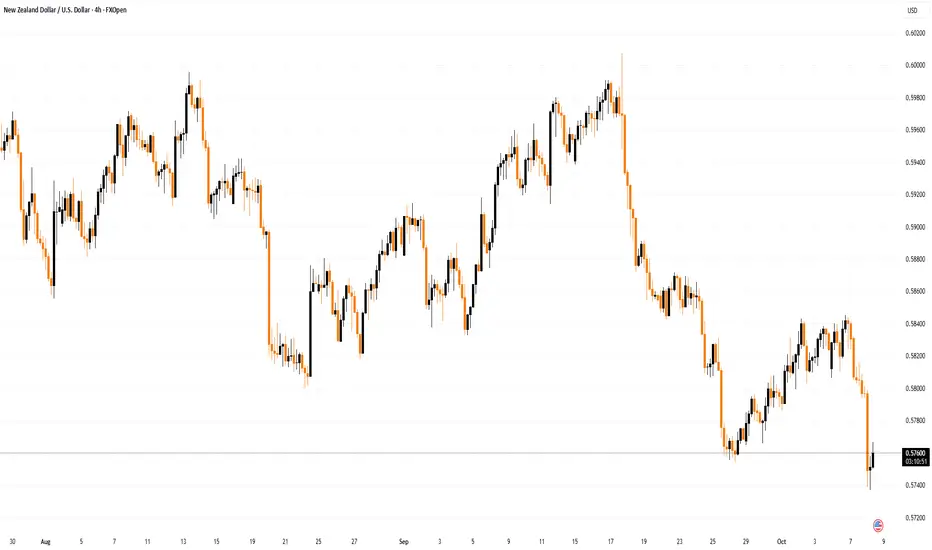
NZD/USD Rate Drops Sharply After Central Bank DecisionNZD/USD Rate Drops Sharply After Central Bank Decision
This morning, the Reserve Bank of New Zealand (RBNZ) cut its key interest rate. According to Forex Factory, the Official Cash Rate was reduced by 50 basis points from 3.0% to 2.5%, while most analysts had expected a smaller cut to 2.75%.
More
See all editors' picks ideas
Dynamic Equity Allocation Model"Cash is Trash"? Not Always. Here's Why Science Beats Guesswork.
Every retail trader knows the frustration: you draw support and resistance lines, you spot patterns, you follow market gurus on social media—and still, when the next bear market hits, your portfolio bleeds red. Meanwhile, institution

First Passage Time - Distribution AnalysisThe First Passage Time (FPT) Distribution Analysis indicator is a sophisticated probabilistic tool that answers one of the most critical questions in trading: "How long will it take for price to reach my target, and what are the odds of getting there first?"
Unlike traditional technical indicators

PongExperience PONG! The classic arcade game, now on your charts!
With this indicator, you can finally achieve your lifelong dream of beating the Markets. . . at PONG!
Pong is jam-packed with features! Such as:
2 Paddles
A moving dot
Floating numbers
The idea of a net
This indicator is solel

Options Max Pain Calculator [BackQuant]Options Max Pain Calculator
A visualization tool that models option expiry dynamics by calculating "max pain" levels, displaying synthetic open interest curves, gamma exposure profiles, and pin-risk zones to help identify where market makers have the least payout exposure.
What is Max Pain?
Max

Volume Profile 3D (Zeiierman)█ Overview
Volume Profile 3D (Zeiierman) is a next-generation volume profile that renders market participation as a 3D-style profile directly on your chart. Instead of flat histograms, you get a depth-aware profile with parallax, gradient transparency, and bull/bear separation, so you can see w

RiskMetrics█ OVERVIEW
This library is a tool for Pine programmers that provides functions for calculating risk-adjusted performance metrics on periodic price returns. The calculations used by this library's functions closely mirror those the Broker Emulator uses to calculate strategy performance metrics (

Simple Decesion Matrix Classification Algorithm [SS]Hello everyone,
It has been a while since I posted an indicator, so thought I would share this project I did for fun.
This indicator is an attempt to develop a pseudo Random Forest classification decision matrix model for Pinescript.
This is not a full, robust Random Forest model by any stretch o

Tick CVD [Kioseff Trading]Hello!
This script "Tick CVD" employs live tick data to calculate CVD and volume delta! No tick chart required.
Features
Live price ticks are recorded
CVD calculated using live ticks
Delta calculated using live ticks
Tick-based HMA, WMA, EMA, or SMA for CVD and price
Key tick levels (S

analytics_tablesLibrary "analytics_tables"
📝 Description
This library provides the implementation of several performance-related statistics and metrics, presented in the form of tables.
The metrics shown in the afforementioned tables where developed during the past years of my in-depth analalysis of various str

Adaptive Trend Classification: Moving Averages [InvestorUnknown]Adaptive Trend Classification: Moving Averages
Overview
The Adaptive Trend Classification (ATC) Moving Averages indicator is a robust and adaptable investing tool designed to provide dynamic signals based on various types of moving averages and their lengths. This indicator incorporates multipl

See all indicators and strategies
Community trends
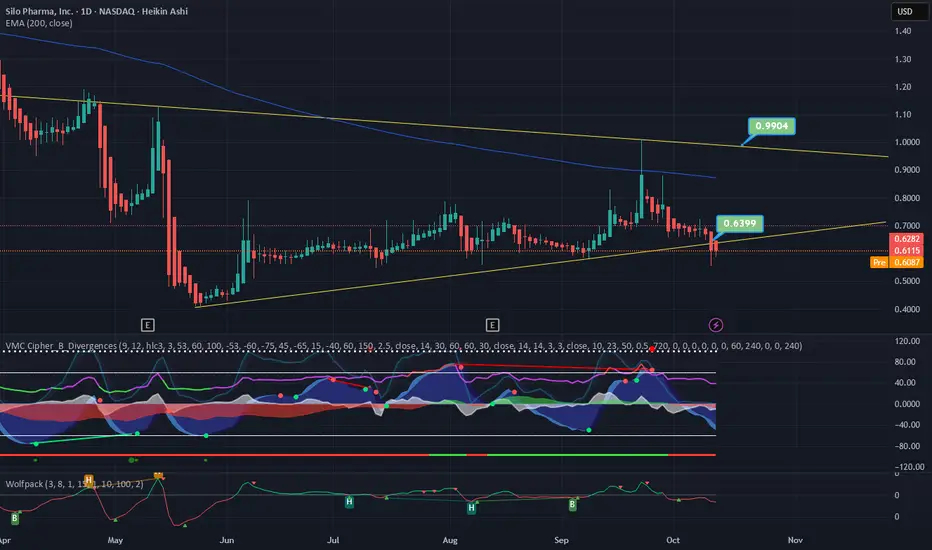
Consolidating Toward a Potential Breakout Above $0.87 ResistanceSILO is coiling inside a symmetrical triangle, building pressure for a potential breakout. The stock continues to respect its rising support trendline near $0.58–$0.60, showing solid accumulation.
The 200-day EMA (~$0.87) now acts as the key resistance to watch. A clean breakout and close above it
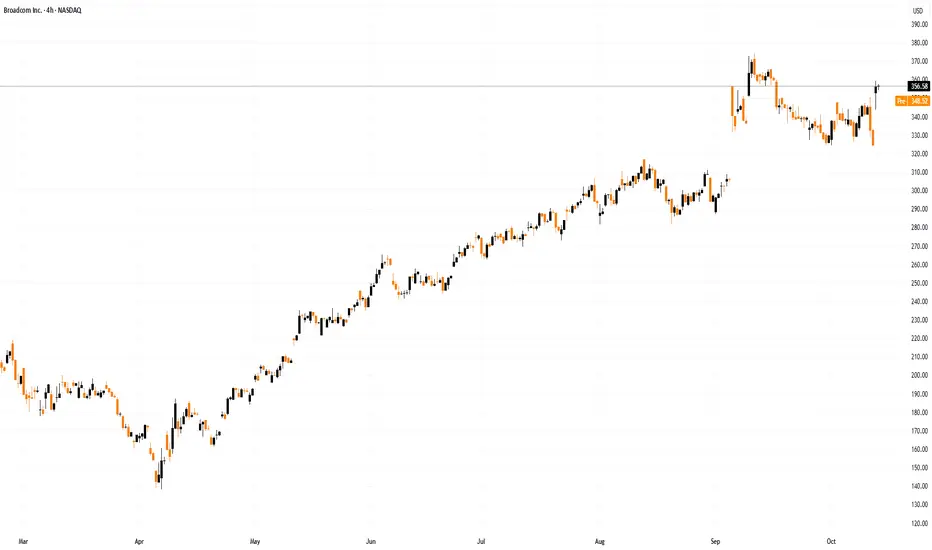
Broadcom - Please short this stock now!🔒Broadcom ( NASDAQ:AVGO ) just ended its rally:
🔎Analysis summary:
Over the course of the past couple of months, Broadcom has been rallying substantially. But considering that Broadcom is now retesting the rising channel resistance, a retracement becomes more and more likely. We just have to

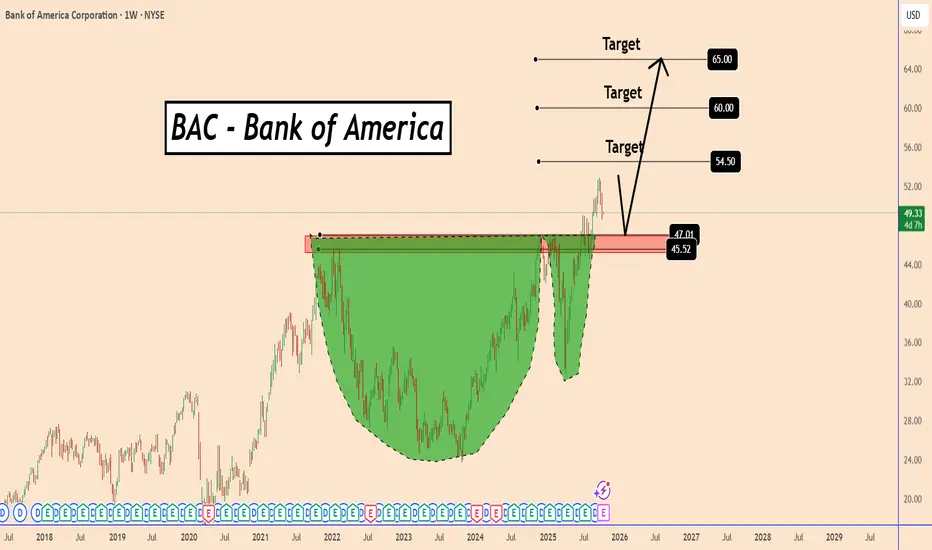
BAC Completed a Cup and Handle Model - Get Ready for a BounceBAC Completed a Cup and Handle Model - Get Ready for a Bounce
The cup and handle pattern is a bullish continuation pattern.
The BAC weekly chart displays a large, rounded bottom that formed over several years, indicating long-term accumulation.
After breaking above the key resistance around $45.
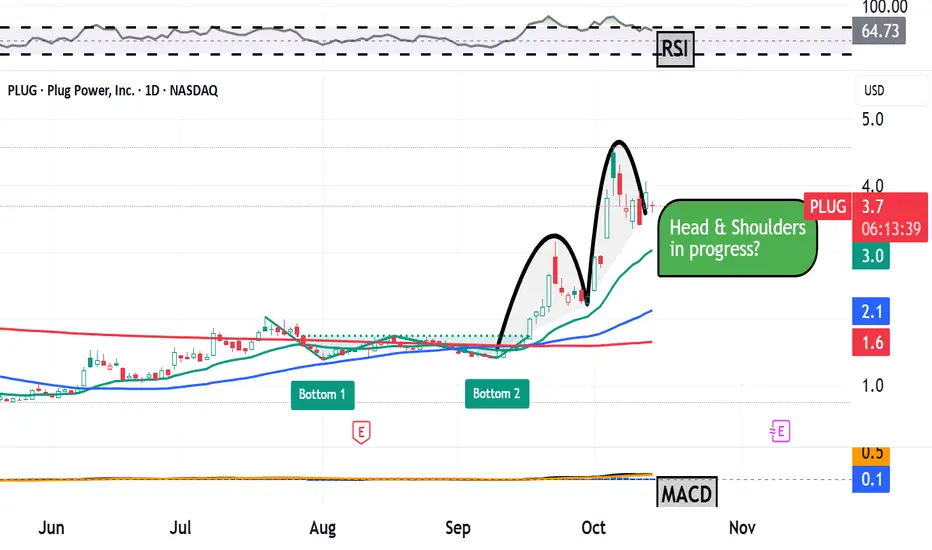
Plug Power Rose 225% in a Month, Then Fell 25%. What's Next?Hydrogen-fuel firm Plug Power NASDAQ:PLUG rallied 225% from its Sept. 10 low to its Oct. 6 high, then fell some 25% over less than three sessions before climbing back some 15% just on Monday. And PLUG is down more than 99% from its all-time high some 26 years ago. One thing's for sure -- it's not
DJT Big move coming?Bollinger Bands are tightening... looking like a big move is coming. In the past, when the Bollinger Bands tightened, we've had huge moves to the upside.

Tesla Correction ahead ? - Levels to be aware Of !In this video I present to you the idea of a Tesla correction into the 340/350USD price zone .
I mark out a potential short setup as well as a strong area for longs/accumulation.
Tools used TPO chart, Fibs, Anchored V wap , Volume Profile, Parallel channels
Good luck with your trading and thank

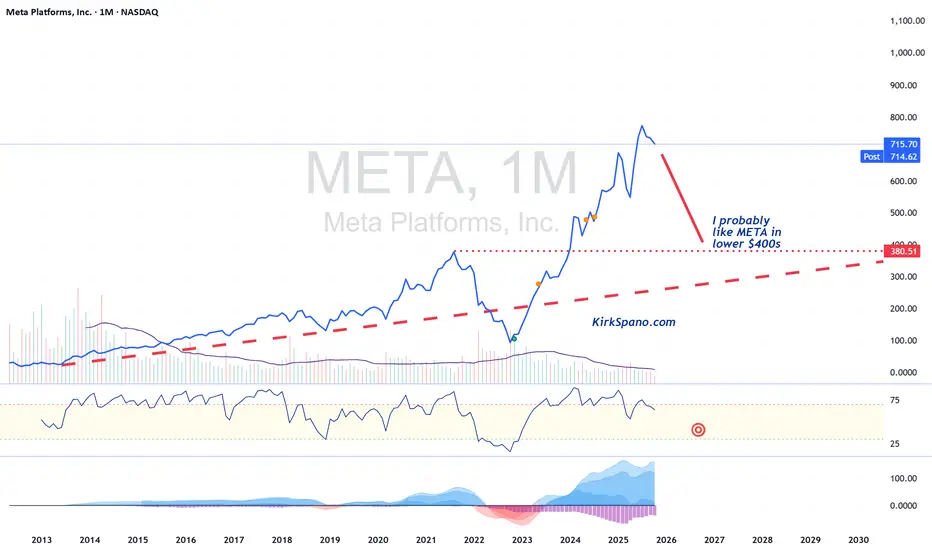
META Correction in 2026 I bought Facebook after their busted IPO and made about 5x and 10x on parts of my money. I should have held so I could have bought half of Wisconsin. My bad.
I don't love Zuck, but the public can't quit Facebook, or Instagram, or Messenger, or Whatsapp... and I think META is in the oligopoly of AI
Broadcom Shares Surge Nearly 10% on OpenAI Partnership NewsBroadcom (AVGO) Shares Surge Nearly 10% on OpenAI Partnership News
Last month, news of a partnership with OpenAI served as a powerful bullish catalyst for NVIDIA (NVDA) shares. In October, a similar effect can be seen on the Broadcom (AVGO) chart.
According to media reports, the two companies hav
Tesla (TSLA) — Momentum Reload or Major Cooldown?The Next $400–$450 Decision Zone!
🧭 Weekly Chart — Big Picture Momentum
Tesla has printed one of the cleanest BOS (Break of Structure) patterns on the weekly timeframe since the post-2023 recovery, confirming that the macro downtrend has flipped into a sustained bullish expansion. The stock ripped

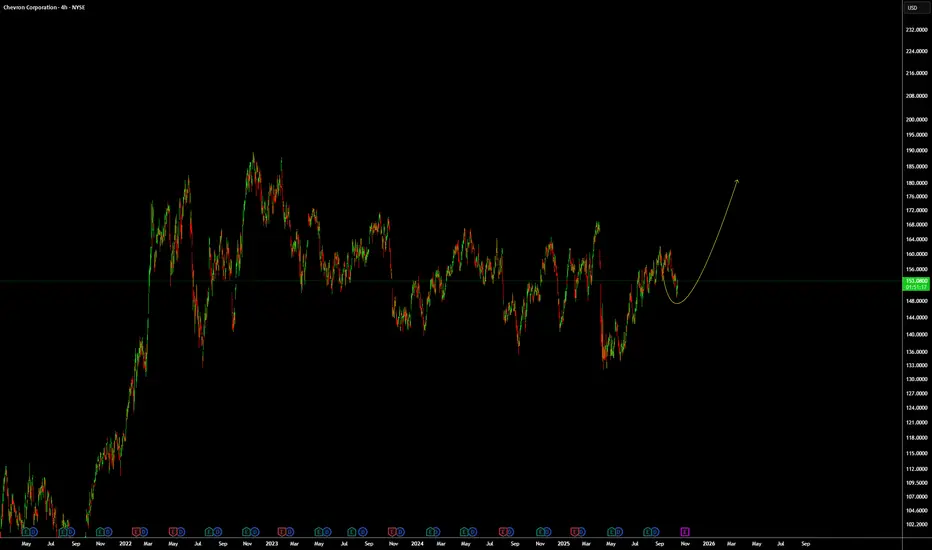
CVX: Looking for an up move/wave.From a technical point of view and based on WTW Concept, NYSE:CVX looks like it will go up.
We Trade Waves
WTW Team
Disclosure: We are part of Trade Nation's Influencer program and receive a monthly fee for using their TradingView charts in our analysis.
See all stocks ideas
Today
SYFSynchrony Financial
Actual
—
Estimate
2.23
USD
Today
CFGCitizens Financial Group, Inc.
Actual
—
Estimate
1.03
USD
Today
FHNFirst Horizon Corporation
Actual
—
Estimate
0.45
USD
Today
BACBank of America Corporation
Actual
—
Estimate
0.95
USD
Today
ABTAbbott Laboratories
Actual
—
Estimate
1.30
USD
Today
MSMorgan Stanley
Actual
—
Estimate
2.10
USD
Today
GMGIGolden Matrix Group, Inc.
Actual
—
Estimate
−0.00
USD
Today
LFCRLifecore Biomedical, Inc.
Actual
—
Estimate
−0.31
USD
See more events
Community trends
Bitcoin’s Bloodbath Was a Setup Smart Money Knows ItBitcoin remains structurally bullish despite the recent market turmoil. The monthly chart clearly shows that the main ascending trendline continues to hold firm acting as the backbone of the current bull cycle.
The recent drop was nothing more than a controlled retest of this key support zone. As l

BTC to Retrace to Key Fibonacci level after Heavy SelloffPrice experienced a sharp and aggressive selloff and now, after a strong rejection from key level, the market is consolidating, showing early signs of stabilization as sellers begin to lose momentum.
If buyers can defend this area and push price higher, the next logical target lies around the Fibon
Bitcoin - First Signs of the Bear AwakeningBitcoin recently swept the previous all-time high, taking liquidity from the major external range. After that sweep, price reacted sharply downward, leaving behind a significant daily imbalance. This gap is now acting as resistance, with clear rejection seen on the daily timeframe. The move signals

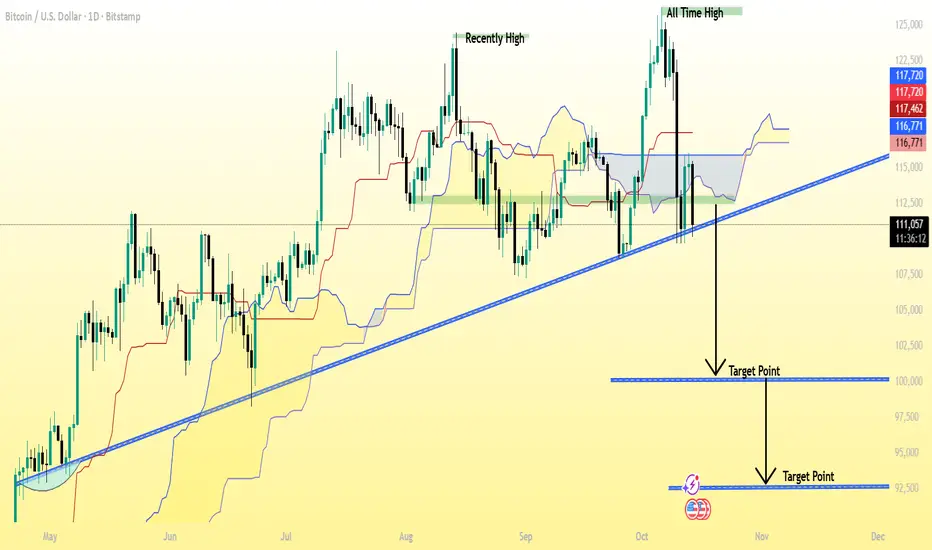
BTC/USD (Bitcoin) chart pattern..BTC/USD (Bitcoin) 1D (Daily) chart 👇
✅ Current Price: around $110,685
✅ Trend: Bearish breakdown — price has clearly broken below the long-term ascending trendline.
✅ Market structure: After rejecting near $117,000, BTC dropped below both the Ichimoku cloud and the trendline — confirming downside p
ETHUSDTHello Traders! 👋
What are your thoughts on Ethereum?
Ethereum is currently trading between two major zones of support and resistance.
In this range, we expect a short-term correction toward the ascending trendline, followed by some consolidation before a potential breakout above the resistance zon

Bitcoin - What to expect from this week?Introduction
This analysis examines the recent price behavior of Bitcoin against USDT on the daily timeframe. The chart highlights several key technical concepts, including a liquidity sweep at the highs, a daily Fair Value Gap (FVG) acting as resistance, and the likelihood of a wick fill within a
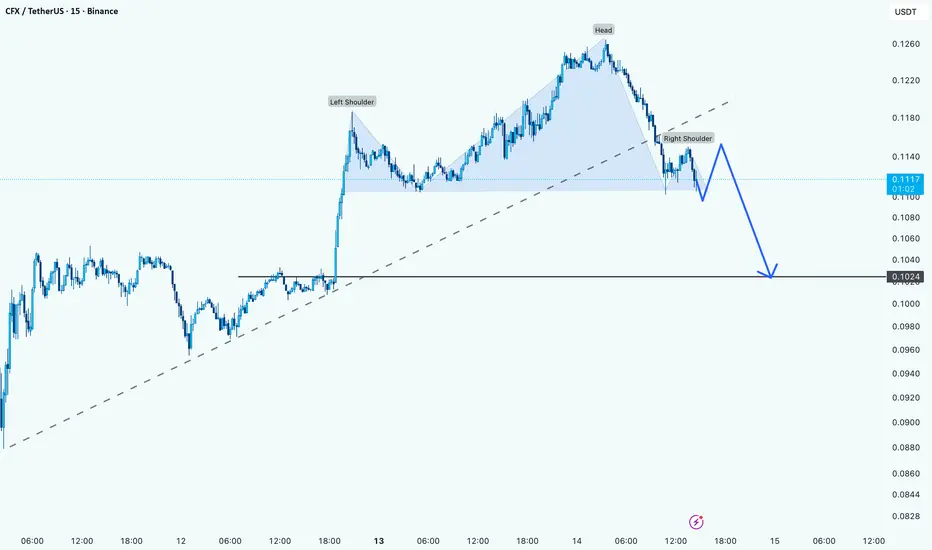
CFX Setting Up for a Head and Shoulders BreakdownHi guys!
just a quick analysis
CFX is printing a clean head and shoulders setup on the 15-minute chart. The neckline sits around the 0.1100 zone, which is acting as short-term support right now.
If the price breaks below that neckline with a solid candle close, it could confirm a bearish reversa
BITCOIN – WAIT FOR ARBITRAGE TO BALANCE SPOT MARKETSTraders,
What a week it’s been. A lot of people got rekt, and I hope you were on the right side of the move. If not, it’s fine: this is how markets reset. I’ve been getting a lot of questions about what comes next, so here’s my current view.
The Situation
Binance/USDT wicked down to 102,000

UDSUSD – FVG’s Not Filled, Trend Ain’t Done YetHey There Guys,
Post-BOS, the market’s still pushing with upside momentum.
That upper +FVG hasn’t been filled yet, so the trend’s not showing signs of fatigue.
The Strong Buy Zone below is still in play—if liquidity gets pulled down there, buyers could step in hard.
As long as we don’t get a daily

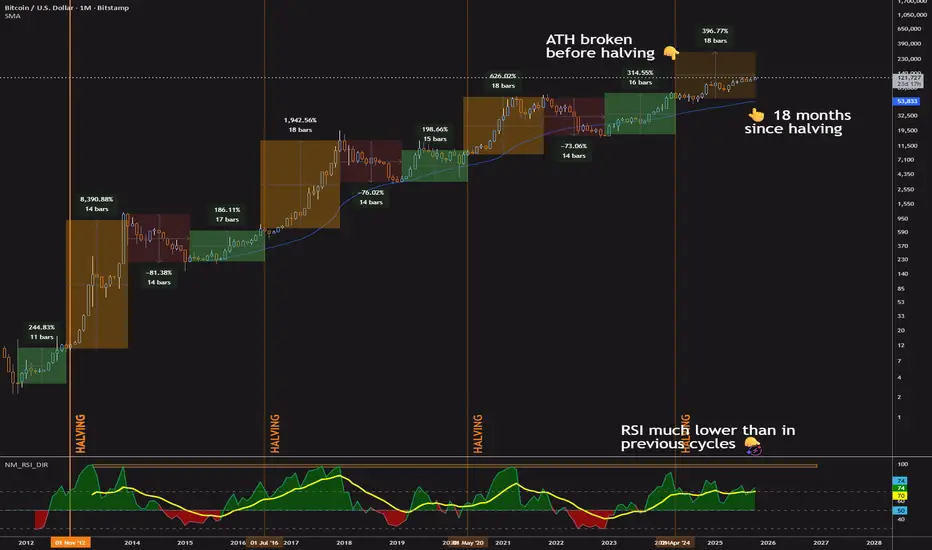
Is Bitcoin's 4-Year Cycle Over? Bitcoin’s 4-year cycle has been a go-to for traders, driven by halving events that spark price surges, sharp corrections, and recovery periods. But something’s off this time.
We’re 18 months into the post-2024 halving rally—hitting the historical peak for bull runs—yet there’s no sign of a crash,
See all crypto ideas
GOLD → Ready for continued growth. Target 4100 - 4125FX:XAUUSD remains above $4,000, starting the week with a record high amid the escalating trade war between the US and China. Traders bought up all of last week's decline.
Key drivers: Trump's new tariffs: Introduction of 100% tariffs on all Chinese goods and export controls on software from No

Gold Eyes 4,200 as Pullback Near 4,070 Sets Stage for Next BreakHey Traders,
In today’s session, we’re monitoring XAUUSD for a buying opportunity around the 4,070 zone. Gold remains in a strong uptrend, and after setting a fresh all-time high, price is now pulling back toward key trend support.
This area has been acting as a critical demand zone, and a bullish

New zone for xauusd Gold (XAU/USD) is showing strong bullish momentum, trading around 4164 with potential continuation toward the 4236 resistance. Price may retest the fair value zone near 4150 before pushing higher, while support remains around 4091.

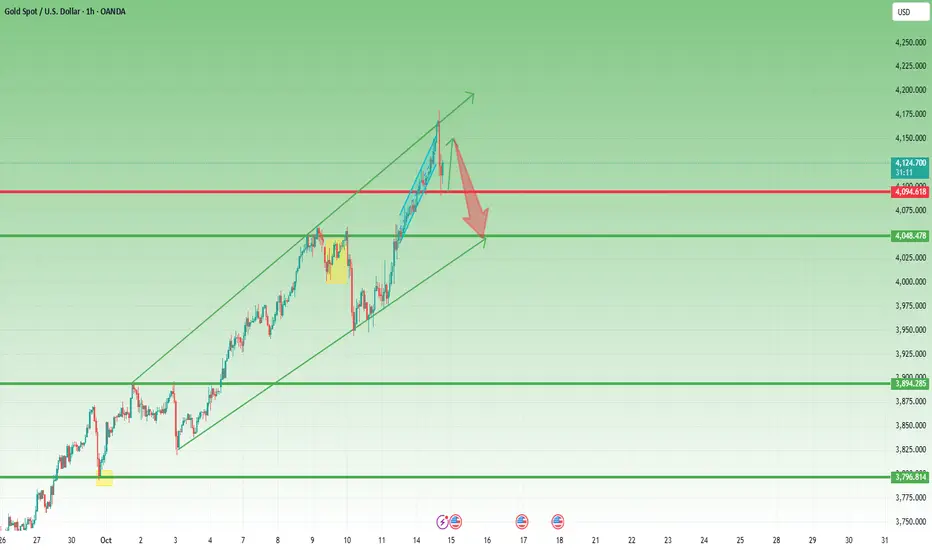
Lingrid | GOLD Retracement Entry Trend Continuation SetupThe price perfectly fulfilled my previous idea . OANDA:XAUUSD remains within its strong upward channel, rebounding each time from its dynamic trendline to form higher lows. The structure displays clear bullish momentum supported by consecutive range breakouts and sustained trend continuation. A s

XAU/USD | Gold Rockets Past $4090 – Over 1000 Pips Gained!By analyzing the Gold (XAU/USD) chart on the 30-minute timeframe, we can see that Gold continued its strong bullish momentum, exactly as expected, and successfully hit all our targets at $4006, $4016, and $4028, fully filling the FVG.
However, Gold didn’t stop there — it kept pushing higher and has

Gold Extends Rally to New All-Time HighsGold Extends Rally to New All-Time Highs
From our previous outlook, gold has followed the optimistic scenario as expected. It reached the $4,000 and $4,050 targets and is likely to continue rising.
After the market turmoil caused by Trump’s comments on Friday about increasing tariffs on China, go

Is This the End of the Insane Rally? (read before comment!)In my Sunday video, I argued that after Friday’s close it seemed likely that 4100 could be next for Gold — and indeed, Gold didn’t just stop there, it printed a new all-time high at 4180.
Yesterday, as usual, when I woke up Asia had already done its job — we’re used to that by now — and I found the
GOLD 4H CHART ROUTE MAP UPDATE & TRADING PLAN FOR THE WEEKHey Everyone,
Please see our updated 4h chart levels and targets for the coming week.
We are seeing price play between two weighted levels with a gap above at 4041 and a gap below at 3978. We will need to see ema5 cross and lock on either weighted level to determine the next range.
We will see le

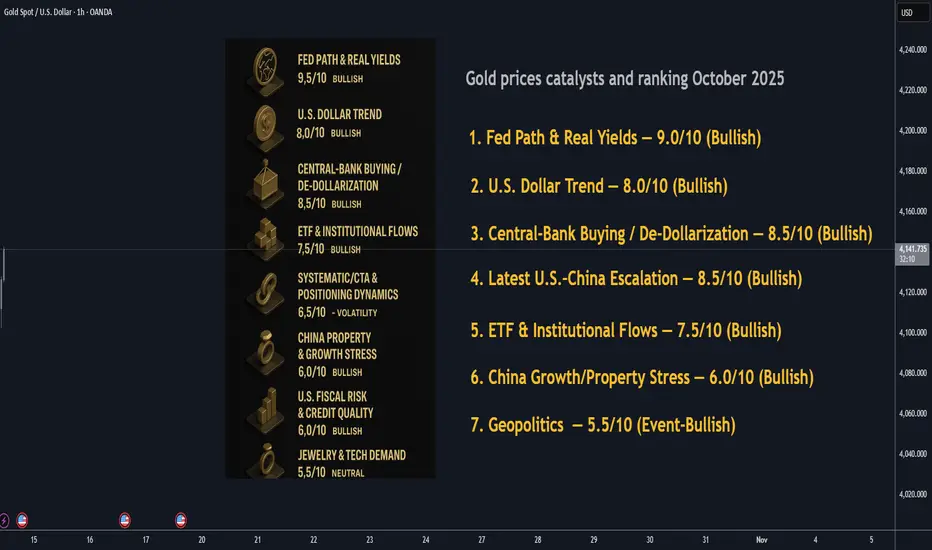
Gold Prices Overview of Primary Catalyst : October 2025📊 Catalyst Scorecard — Updated (10 = max bullish impulse)
1. Fed Path & Real Yields — 9.0/10 (Bullish)
Markets lean toward additional Fed cuts into year-end as labor-market risks build; dovish signaling around/after Jackson Hole has coincided with record gold prints. Lower real yields remain the
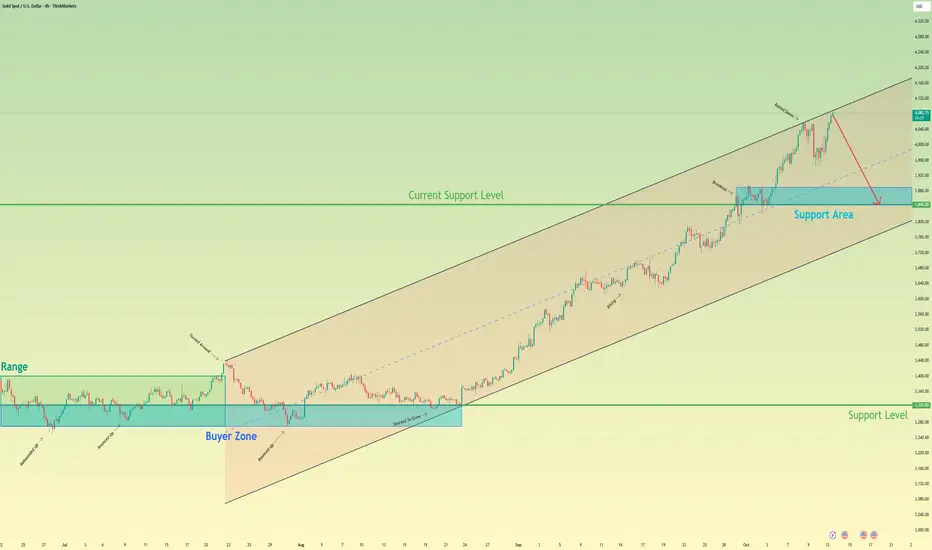
Gold can be Rejected from Channel ResistanceHello traders, I want share with you my opinion about Bitcoin. The market context for Gold has been strongly bullish since the price action broke out of a prolonged consolidation range that was based in the 3325 buyer zone. This structural shift initiated a new uptrend, with the price action for XAU
See all futures ideas
GBP/USD - Breakout Pattern (14.10.2025)The GBP/USD pair on the M30 timeframe presents a Potential Buying Opportunity due to a recent Formation of a Breakout Pattern.
This suggests a shift in momentum towards the upside and a higher likelihood of further advances in the coming hours.
Possible Long Trade:
Entry: Consider Entering A Lo

GBP/USD (1H chart) ...GBP/USD (1H chart)
Current price: around 1.3274
Breakout trendline: downward sloping, recently broken
Support zone: near 1.3200 – 1.3220 (highlighted green area)
Resistance/Target zones: marked as “Target Point” on my chart
From the chart structure and Ichimoku breakout:
🎯 Target Levels
1.

NZD/USD 30-minute chart Pattern...NZD/USD 30-minute chart, here’s a breakdown of what the setup shows:
The chart depicts a downtrend, but price is currently forming a potential reversal from a support zone (the rectangular box at the bottom).
A downtrend line has been broken or is about to be broken to the upside.
The Ichimoku cl

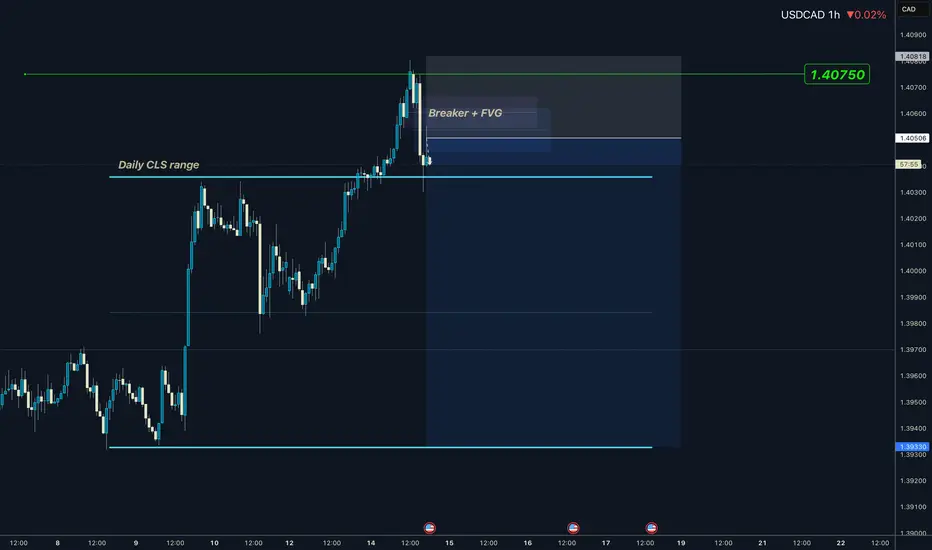
USDCAD I Daily CLS Range I Model 1 I Stop Hunt Hi friends, new range created. As always we are looking for the manipulation in to the key level around the range. Don't forget confirmation switch from manipulation phase to the distribution phase to make the setup valid. Stay patient and enter only after change in order flow. If price reaches 50%
EURUSD: Downtrend will Continue in ChannelHello everyone, here is my breakdown of the current Euro setup.
Market Analysis
The price action has been clearly bearish, with the market being guided lower by a well-defined Downward Channel. This structure has been in place for some time, creating a series of lower highs and lower lows after
EURUSD Short: Trend Continuation After BreakdownHello, traders! The prior market structure for EURUSD has shifted to a bearish bias following a major reversal from the supply 2 level near 1.1835. The failure of a prior ascending channel initiated a new downtrend, which has been guiding the price auction lower through a series of complex breakdown

EURNZD could fall from 2.0300 for a larger correctionEURNZD could fall from 2.0300 for a larger correction
On Friday, EURNZD rose sharply after Trump’s comments to increase tariffs on China. EURNZD retested a strong area located near 2.0300.
I think EURNZD could fall from this area, but again it is a big and complex development overall.
From a tec

USDCAD - Important Breakout!Hello traders!
Previously, the USDCAD price formed a bullish triple bottom pattern.
Currently, the resistance level (1.39829 - 1.40234) is broken!
So, I expect a bullish move🚀
_____________
TARGET: 1.41500🎯

GBPUSD 30Min Engaged ( Buy & Sell Reversal Entry Detected )Time Frame: 30-Minute Warfare
Entry Protocol: Only after volume-verified breakout
🩸Bullish Reversal - 1.32100
🩸Bullish Reversal - 1.32900
➗ Hanzo Protocol: Volume-Tiered Entry Authority
➕ Zone Activated: Dynamic market pressure detected.
The level isn’t just price — it’s a memory of where they mo

Strong buy level euruadCurrently this pair dropping
But daily oversold now
Wait to sweep low and when Reached at our buy area then open buy trade with confirmation

See all forex ideas
| - | - | - | - | - | - | - | ||
| - | - | - | - | - | - | - | ||
| - | - | - | - | - | - | - | ||
| - | - | - | - | - | - | - | ||
| - | - | - | - | - | - | - | ||
| - | - | - | - | - | - | - | ||
| - | - | - | - | - | - | - | ||
| - | - | - | - | - | - | - |
Trade directly on the supercharts through our supported, fully-verified and user-reviewed brokers.


