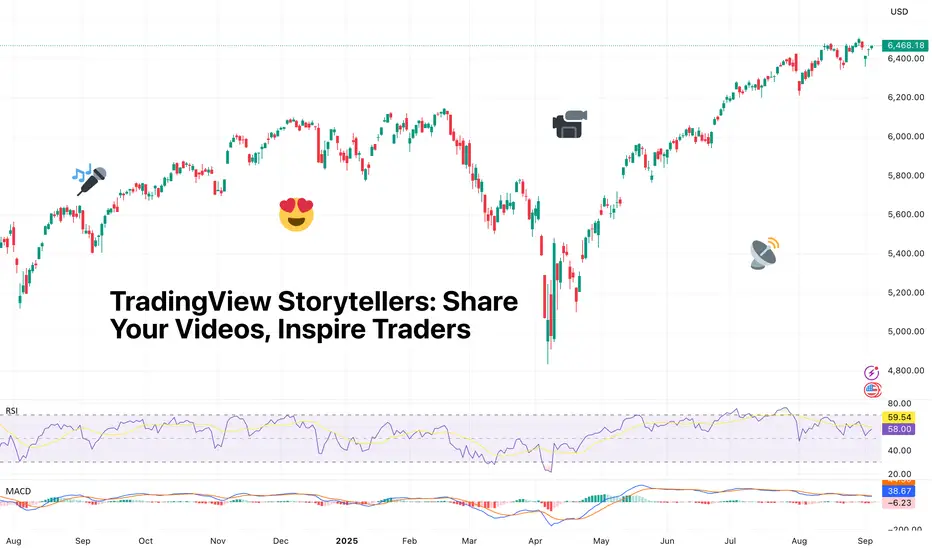
TradingView Storytellers: Share Your Videos, Inspire TradersCalling all creators, chart wizards, and video storytellers.
👋 Hey traders !
We know many of you aren’t just analyzing the markets and trading — you’re teaching, creating, and inspiring others. We see you!
And now's your chance to get your content in the spotlight — share your best work with us

The best trades require research, then commitment.
Get started for free$0 forever, no credit card needed

Scott "Kidd" PoteetThe unlikely astronaut

Where the world does markets
Join 100 million traders and investors taking the future into their own hands.
Major indices
Bitcoin Rally Fades as Prices Nosedive. End of Bullish Cycle?Technical analysis will tell you that maybe it’s time for a pullback. But then again, this is crypto. It’s the wild west, where predictions are polite suggestions at best. Here’s what we know about where we are.
📉 Bitcoin Takes a Breather
Bitcoin BITSTAMP:BTCUSD started the week on a quieter n

Why Ethereum is Outperforming Bitcoin? | FX ResearchWhile Bitcoin did manage to push to a fresh record high, the broader august trend reflected cautious investor sentiment, supported by modest momentum and ongoing macro uncertainty. The narrative suggests price resilience, but without the forcefulness needed for the next wave of bullish momentum.
I

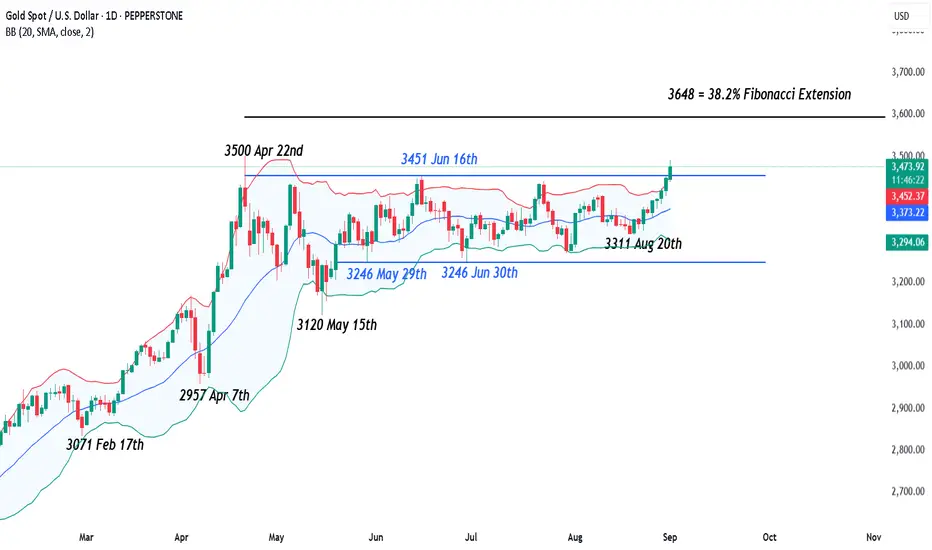
Gold – Breaking Out or Faking Out to Start September?Gold has been trading in a 3250-3450 range since the middle of May, but events last week saw prices test and close right at the top of that range on Friday. The drivers impacting this push higher in Gold, which could remain in play for traders in the first week of September, were numerous. These inc
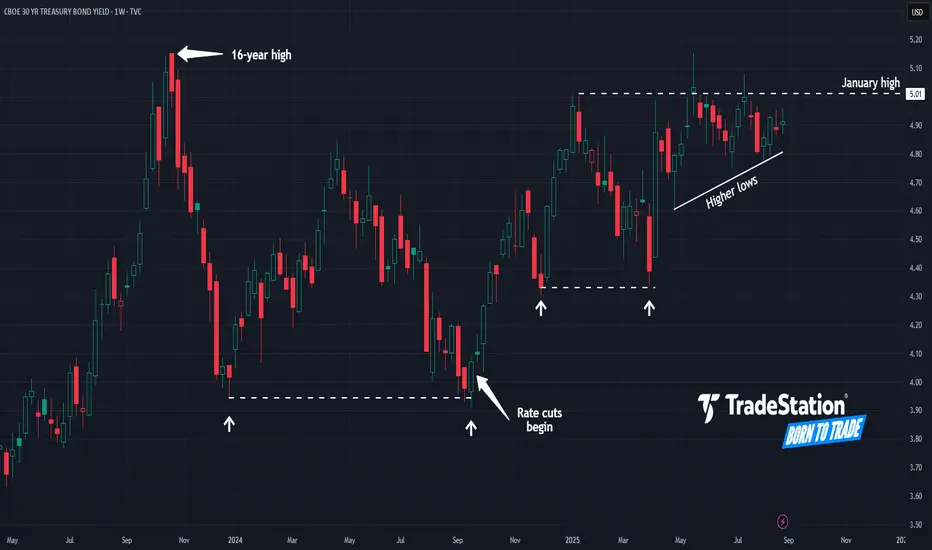
Fear and Loathing at the Long End?Sovereign bond rates have steadily crept higher since the pandemic, and some traders may worry about further upward pressure in the 30-year U.S. Treasury yield.
The first pattern on today’s weekly chart is the double bottom at roughly 3.95 percent in December 2023 and September 2024.
Second, TYX
Gold Pops 5% as Fed Fears Drive Demand. New Record High Soon?Gold bugs are doing well this summer.
The yellow metal OANDA:XAUUSD just logged its best monthly performance since April, climbing nearly 5% in August and closing at $3,447 per ounce on Friday – its highest level since mid-June.
As stock bros take a break for Labor Day on Monday, gold bugs a

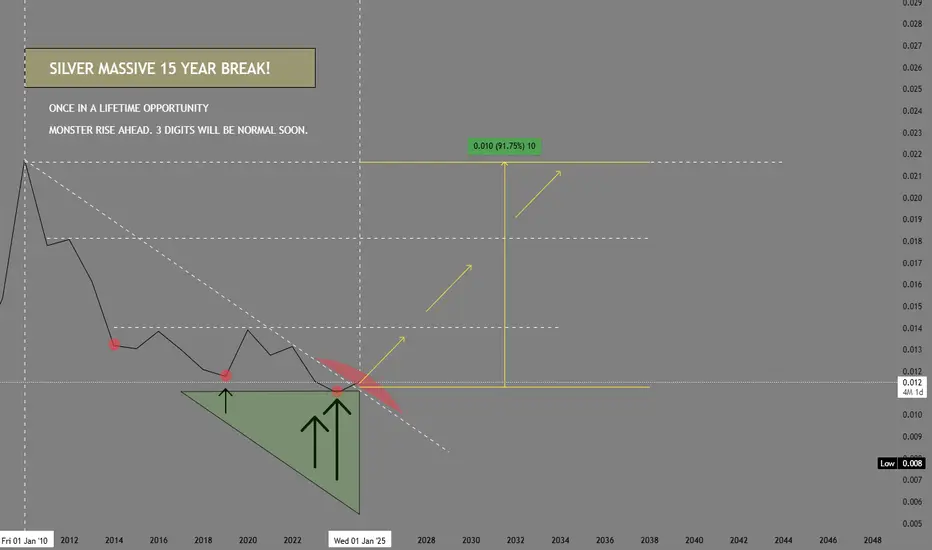
SILVER, MONSTER RISE AHEAD targeting 3 digit pricing!!! SEED NOWFirst things first. Chart is based on reverse metrics of GOLD/SIVER.
SILVER, is usually the supporting actor of the main star GOLD for months. During GOLD's relentless series of rise from 1900 -- silver has been pretty much on the low key state in terms of volume exposure and media mileage but tha
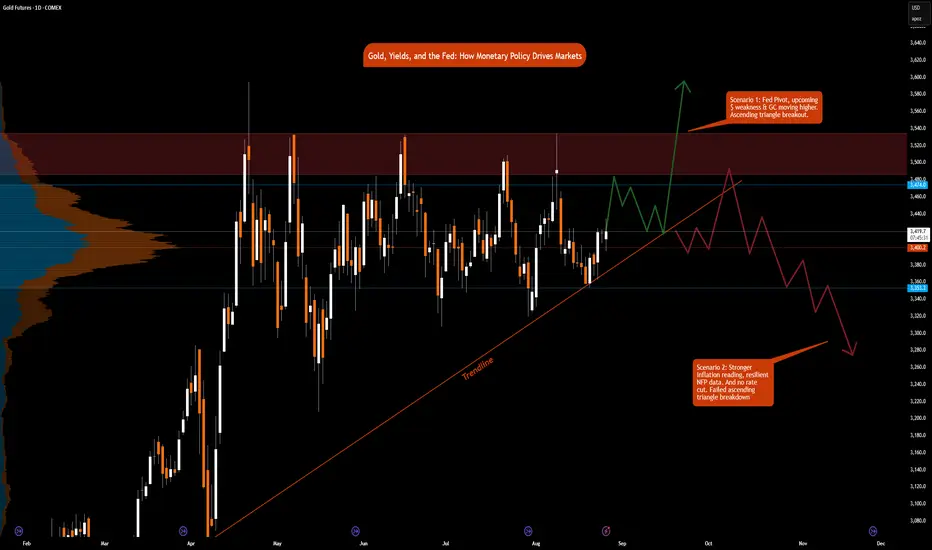
Gold, Yields, and the Fed: How Monetary Policy Drives Markets
Few forces shape global markets more than U.S. monetary policy. The Federal Reserve’s dual mandate, maximum employment and 2% inflation is the anchor for its decisions. For traders, understanding how these objectives translate into interest rate changes is critical for positioning in gold futures a
Retro Editors' picks 2023Moving onward, for the penultimate time, in our retro EP selection , we present to you the fourth collection of additional scripts that have earned a spot in our Editors' picks, this time from 2023.
These retrospective selections reflect our continued commitment to honoring outstanding contributio

Don’t Be the Exit Liquidity: The Truth About IPOsPicture this: a company wants to go public. They don’t just toss shares on the market like a garage sale. No. The sequence is distinct.
First, the company sits down with the sharpest pencils on Wall Street—the underwriters. These aren’t TikTok stock gurus; they’re analysts whose job is to tear apar
See all editors' picks ideas
VWAP Price ChannelVWAP Price Channel cuts the crust off of a traditional price channel (Donchian Channel) by anchoring VWAPs at the highs and lows. By doing this, the flat levels, characteristic of traditional Donchian Channels, are no more!
Author's Note: This indicator is formed with no inherent use, and serves

Fibonacci Sequence Circles [BigBeluga]🔵 Overview
The Fibonacci Sequence Circles is a unique and visually intuitive indicator designed for the TradingView platform. It combines the principles of the Fibonacci sequence with geometric circles to help traders identify potential support and resistance levels, as well as price expansio

ATAI Volume Pressure Analyzer V 1.0 — Pure Up/DownATAI Volume Pressure Analyzer V 1.0 — Pure Up/Down
Overview
Volume is a foundational tool for understanding the supply–demand balance. Classic charts show only total volume and don’t tell us what portion came from buying (Up) versus selling (Down). The ATAI Volume Pressure Analyzer fills that g

Market Cap Landscape 3DHello, traders and creators! 👋
Market Cap Landscape 3D. This project is more than just a typical technical analysis tool; it's an exploration into what's possible when code meets artistry on the financial charts. It's a demonstration of how we can transcend flat, two-dimensional lines and step into

ZigzagLiteLibrary "ZigzagLite"
Lighter version of the Zigzag Library. Without indicators and sub-component divisions
method getPrices(pivots)
Gets the array of prices from array of Pivots
Namespace types: Pivot
Parameters:
pivots (Pivot ) : array array of Pivot objects
Returns: array array

ZigzagLibrary "Zigzag"
Zigzag related user defined types. Depends on DrawingTypes library for basic types
method tostring(this, sortKeys, sortOrder, includeKeys)
Converts ZigzagTypes/Pivot object to string representation
Namespace types: Pivot
Parameters:
this (Pivot) : ZigzagTypes/Pivot

Angled Volume Profile [Trendoscope]Volume profile is useful tool to understand the demand and supply zones on horizontal level. But, what if you want to measure the volume levels over trend line? In trending markets, the feature to measure volume over angled levels can be very useful for traders who use these measures. Here is an att

MathEasingFunctionsLibrary "MathEasingFunctions"
A collection of Easing functions.
Easing functions are commonly used for smoothing actions over time, They are used to smooth out the sharp edges
of a function and make it more pleasing to the eye, like for example the motion of a object through time.
Easing function

Treasury Yields Heatmap [By MUQWISHI]▋ INTRODUCTION :
The “Treasury Yields Heatmap” generates a dynamic heat map table, showing treasury yield bond values corresponding with dates. In the last column, it presents the status of the yield curve, discerning whether it’s in a normal, flat, or inverted configuration, which determined by us

Time & Sales (Tape) [By MUQWISHI]▋ INTRODUCTION :
The “Time and Sales” (Tape) indicator generates trade data, including time, direction, price, and volume for each executed trade on an exchange. This information is typically delivered in real-time on a tick-by-tick basis or lower timeframe, providing insights into the traded size

See all indicators and strategies
Community trends
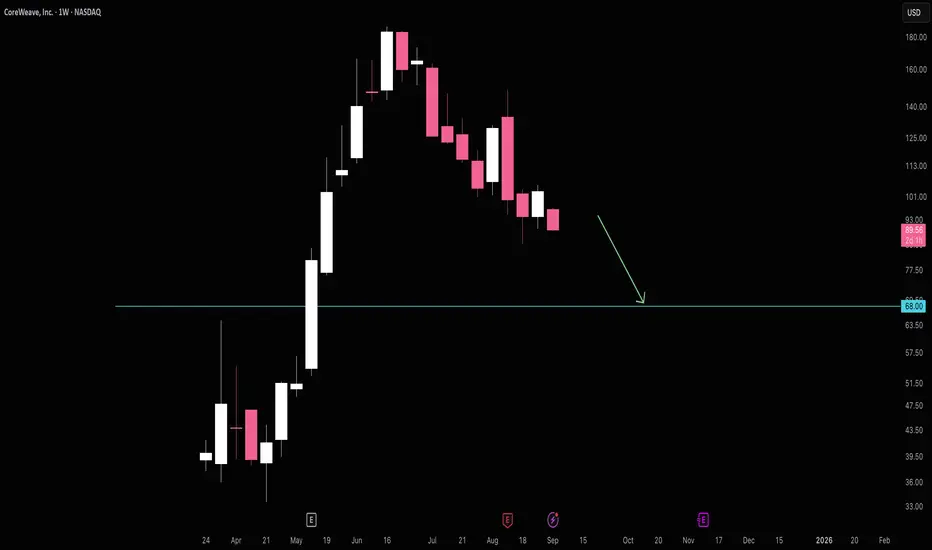
CoreWeave Falling to $68CoreWeave seems to be falling towards $68 support. It's hard to say if $68 will hold, but it's absolutely a good area to close shorts for a potential bounce.
CRWV has yet to form any long term trend lines that I can find. Perhaps this will come from a bounce off $68.
Good luck!
Palantir - BullishPalantir has completed a healthy retracement to the 0.382 Fibonacci level drawn from the recent major bullish rally, a key area that often acts as strong support during trending markets. This level not only holds technical significance from a Fib perspective, but it's also been respected structurall

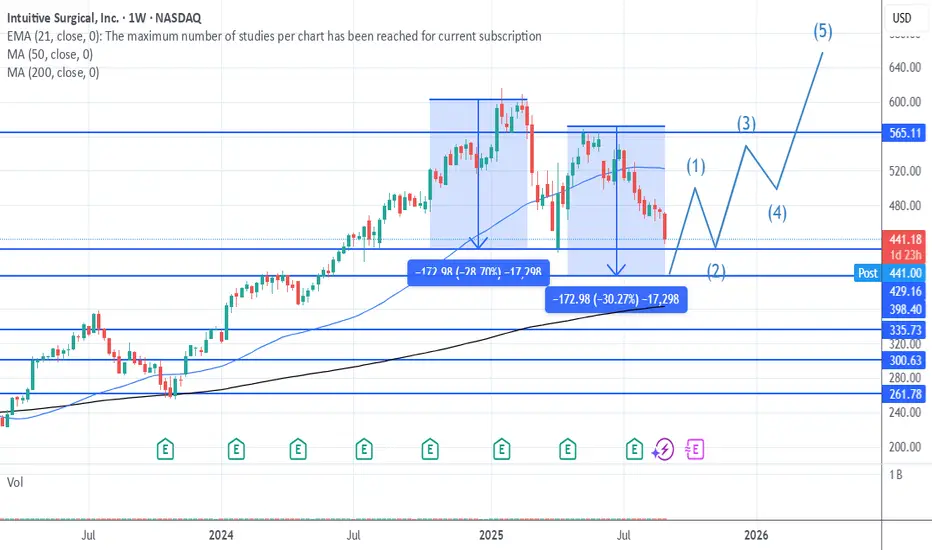
Buy ISRG at 397-400 this is just a ABC CorrectionBuy ISRG at 397-400 this is just a ABC Correction
Great company story still intack , AI infused surgeries will rip this to the moon
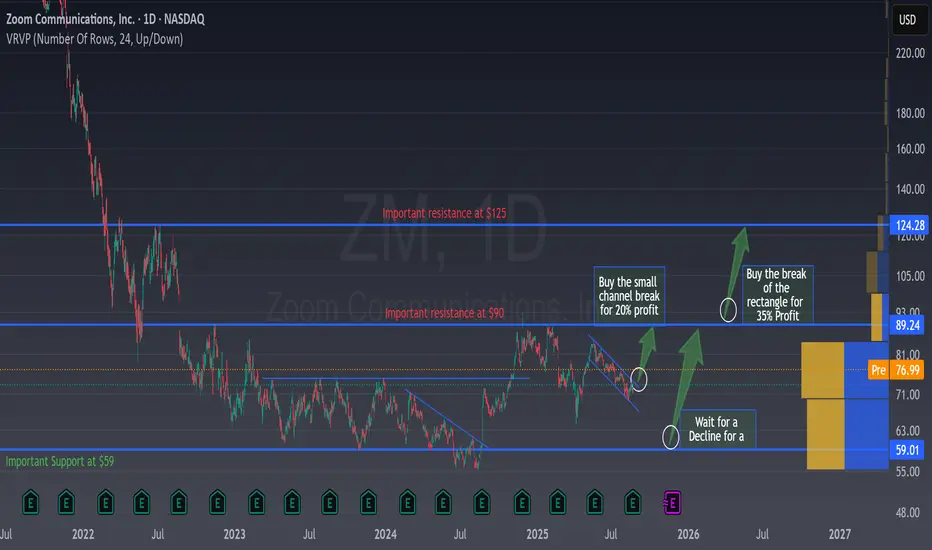
3 Ways to Trade Zoom for a Fast 20% Gain3 Ways to Trade Zoom for a Fast 20% Gain
First Impressions 🤔
Zoom’s daily chart paints a story of prolonged consolidation. After its post-pandemic plunge, the stock has been grinding sideways between roughly $60 and $90 for years.
As an investor, you might feel a bit of relief, no more wild
Tesla - The triangle is still valid!🚔Tesla ( NASDAQ:TSLA ) remains totally bullish:
🔎Analysis summary:
If we look at the chart of Tesla, we can see a very long term consolidation over the past four years. This, however, does not mean that the bullrun is over but rather preparing for the next bullish move. We just have to wait f

Time to finally buy the dip?You’ll hear all these finance bros talking about this stock like it’s the next best thing. Your boy was shorting the highs and exited just before the earnings pop. That was a good move, we had a temporary pop only to quickly fall back down.
I’ve had my levels on this chart ahead of time. It’s hit

New Setup : QBTSOn the daily chart, despite the rising highs and lows,there is an interesting bearish crossover that may lead the price to a big correction.

What do you think about TSLA?!If it goes down it cannot be a small move. If it goes up it will be a common pattern (consolidation then breakout).
I think we well see it in two or three days!

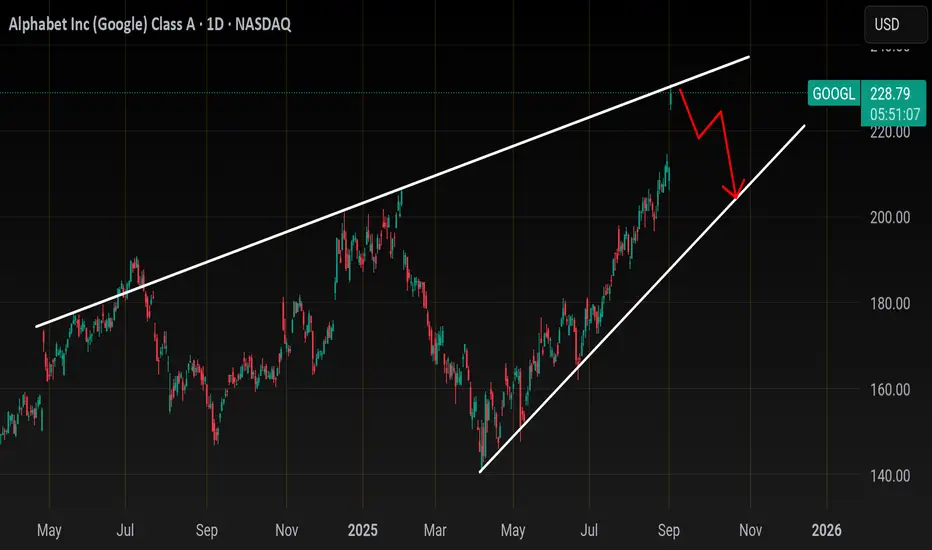
GooglJust an adjustment and repost of my last googl idea... the short is here near 230..
Target price 197-200 by End of October or sooner..
Daily, weekly RSI overbought
Daily, Weekly' monthly Bbands over extended
Weekly moneyflow overbought
XLC Sector at resistance here at 113.00
Looking for a
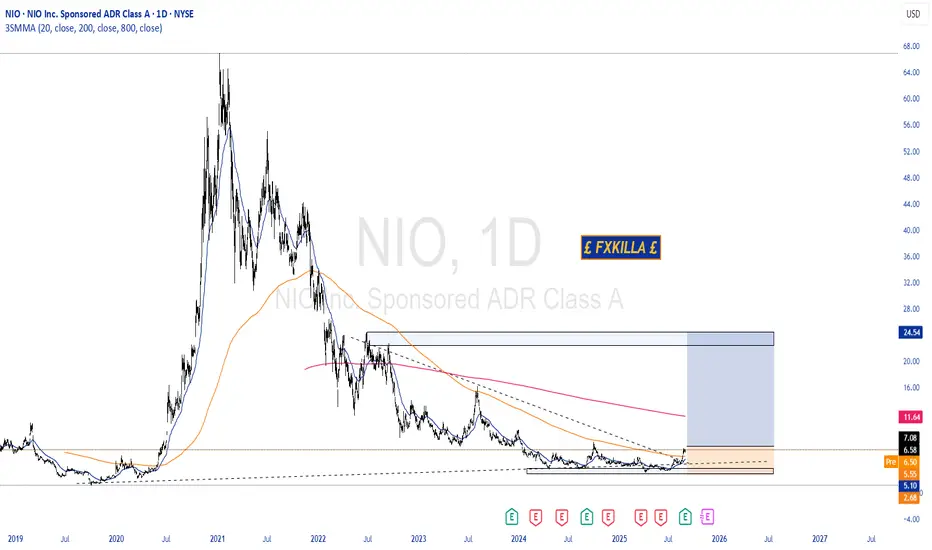
NIO HIGH PROBABILITY BUY SETUP SOON!!🚨 NIO HIGH PROBABILITY BUY SETUP 🚨
* Here We Can See Clearly The Next Potential Move For NIO Coming Hours/Days.
* Keep Your Eyes Close On Your Trading Positions.
* Happy PIP Hunting Traders.
£ FXKILLA £
See all stocks ideas
Today
DLTHDuluth Holdings Inc.
Actual
0.03
USD
Estimate
−0.12
USD
Today
SCVLShoe Carnival, Inc.
Actual
0.70
USD
Estimate
0.58
USD
Today
CALCaleres, Inc.
Actual
0.35
USD
Estimate
0.59
USD
Today
GIIIG-III Apparel Group, LTD.
Actual
0.25
USD
Estimate
0.09
USD
Today
BRCBrady Corporation
Actual
1.26
USD
Estimate
1.24
USD
Today
KEQUKewaunee Scientific Corporation
Actual
—
Estimate
—
Today
PDEXPro-Dex, Inc.
Actual
—
Estimate
0.47
USD
Today
FIZZNational Beverage Corp.
Actual
—
Estimate
0.60
USD
See more events
Community trends
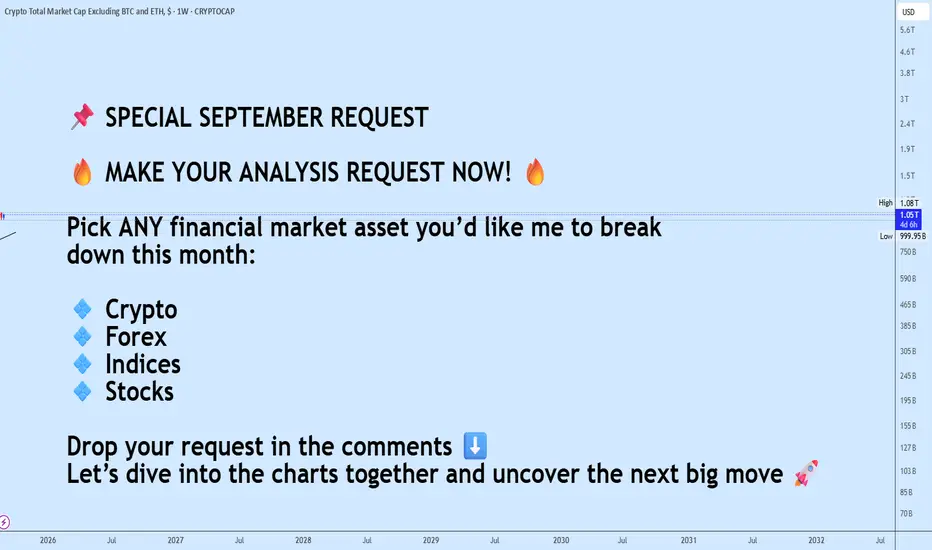
September Analysis RequestSeptember is here, and the markets are heating up again. This is your chance to get a detailed breakdown on any asset of your choice: crypto, forex, indices, or stocks. Drop your request below and let’s prepare for the big moves ahead.
Request Deadline: 5th September 2025.
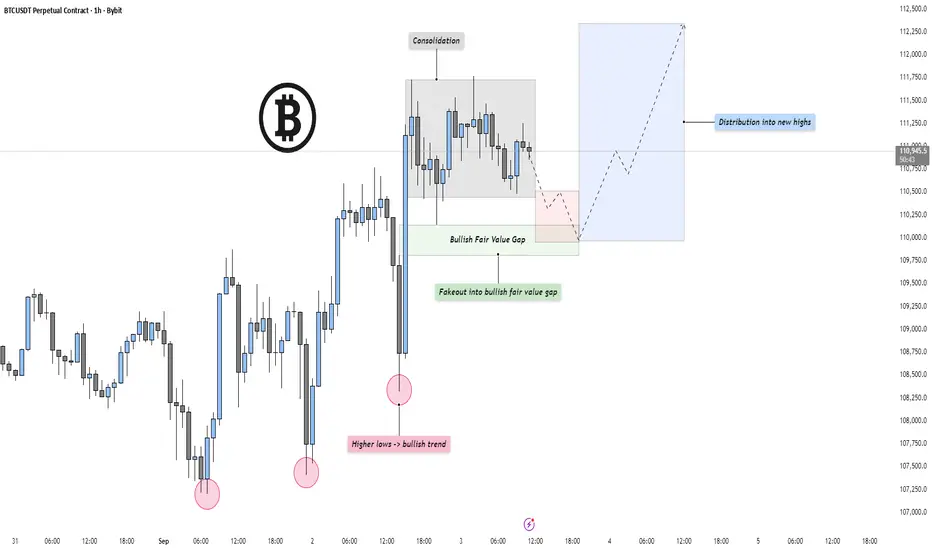
BTC - Consolidation, Manipulation & Distribution into new HighsMarket Context
BTC is currently printing a series of higher lows, which signals a bullish underlying trend despite short-term volatility. Each dip has been defended, showing that buyers are stepping in earlier with every pullback. This type of structure often builds the foundation for an eventual b
Bitcoin Rally Fades as Prices Nosedive. End of Bullish Cycle?Technical analysis will tell you that maybe it’s time for a pullback. But then again, this is crypto. It’s the wild west, where predictions are polite suggestions at best. Here’s what we know about where we are.
📉 Bitcoin Takes a Breather
Bitcoin BITSTAMP:BTCUSD started the week on a quieter n
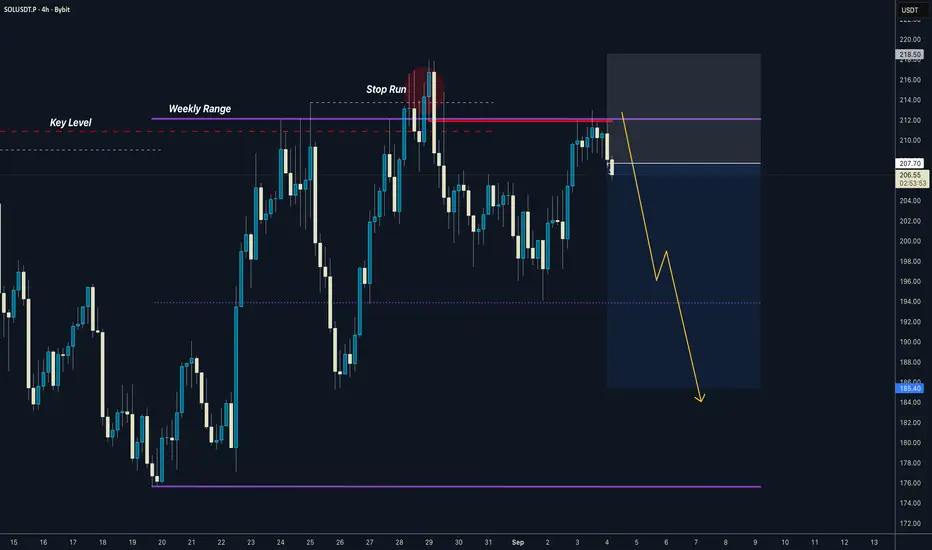
SOLANA everything is ready for the classic Thursday dump
Weekly range manipulated
Traded inside to induce sellers
Stopped them out
Created OB
Retested
Short is ready
There are so many people on here who are addicted to gambling
But they don’t want to accept it - so they call themselves a trader because it sounds much better and product
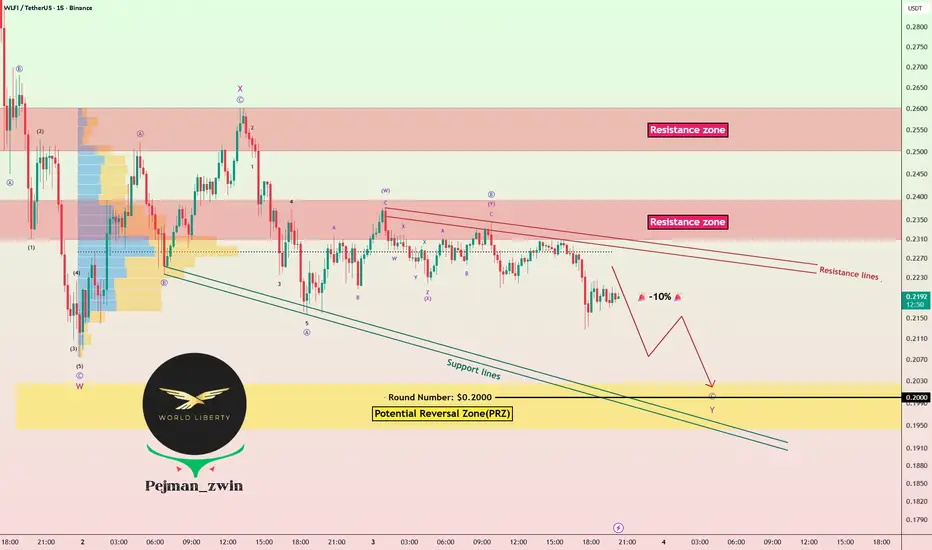
WLFI Faces -10% Risk! Will PRZ Trigger a Strong Reversal?Today, I’m going to analyze World Liberty Financial ( BINANCE:WLFIUSDT ) from a fundamental and technical perspective .
WLFI is the governance token (non-equity) with a 5% per-wallet voting cap.
USD1 is a fully backed U.S. dollar stablecoin (T-Bills + cash).
Total WLFI supply is 100B, with ~2
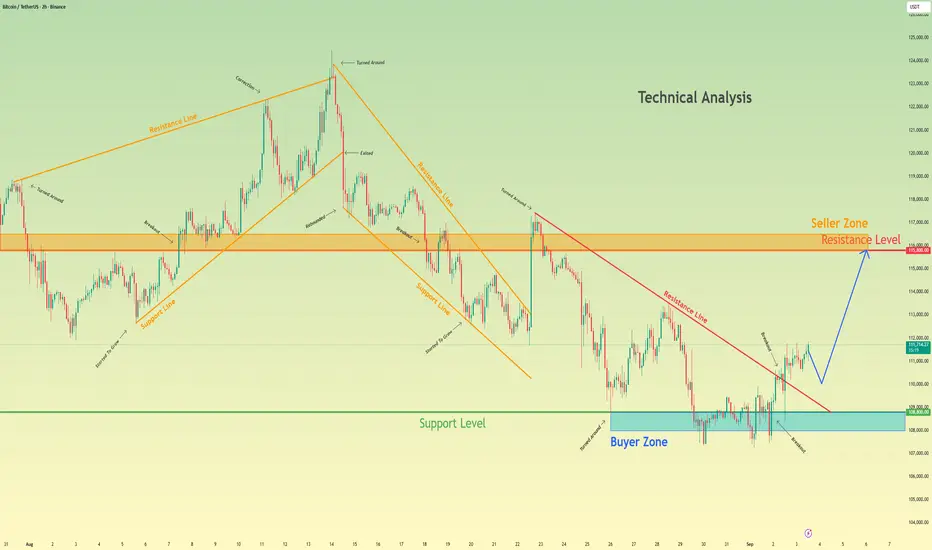
BTCUSD: Price Drop to Support line of WedgeHello everyone, here is my breakdown of the current Bitcoin setup.
Market Analysis
From a broader perspective, the price action for Bitcoin has been bearish since the rejection from the Resistance Zone near the 122000 level. This initiated a downtrend that has since evolved from a channel into

SOLUSDT – Bullish Momentum in Upward Channel | Breakout WatchSolana (SOL/USDT) is respecting an upward channel on the 4H chart, showing steady bullish structure.
✅ Multiple Break of Structure (BOS) confirms ongoing uptrend
✅ Price is currently rebounding from the channel support
✅ A clean breakout above 210 – 220 resistance zone could fuel a rally toward 2

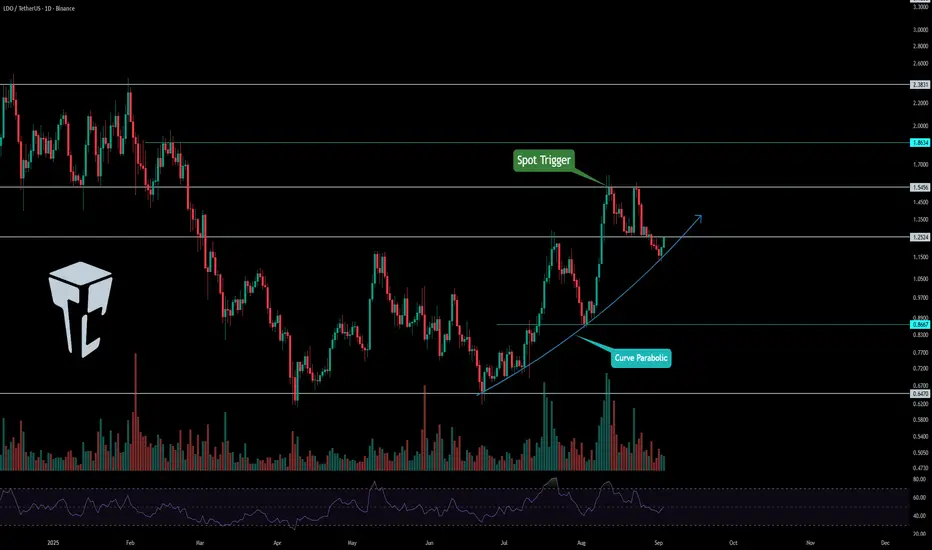
TradeCityPro | LDOUSDT The Best Spot Entry Point👋 Welcome to TradeCityPro Channel!
Let's move on to the LDO analysis, which has the most Ethereum possible in this staking network, and its job is to form nodes and structure transactions, and it has solved the problem of having 32 Ethereum to be a validator.
🌐 Overview of Bitcoin
Before startin
Bitcoin (BTCUSD) –> Retest Before the Next Drop?Hello guys!
After a strong run inside the ascending channel, Bitcoin has finally broken its trendline support. This is often the first warning that momentum is shifting from bullish to bearish.
Right now, price action is pulling back and looks ready to retest the broken trendline around the 111,300

Bitcoin continue to move up to resistance levelHello traders, I want share with you my opinion about Bitcoin. The prolonged corrective phase for Bitcoin appears to be concluding, as the price action signals a significant shift in momentum. After a complex journey through various corrective patterns, the price established a strong support base in
See all crypto ideas
GOLD Overview: Rose sharply and broke important resistanceIf we zoom out and take a look at how the price moved on GOLD, we can see the following:
The price repeatedly tested the area of resistance while setting consecutively higher lows.
The highs around the resistance price formed a horizontal line. Then, it recently broke it with strength.
This forms

Xauusd Going to moonThis analysis shows Gold (XAUUSD) retesting its support trendline and forming a new support zone around 3530. As long as this level holds, the chart suggests a potential bullish move targeting 3578 and a new high zone near 3611.

Gold Hits New ATH – Is a Bearish Crab Reversal Next?Gold ( OANDA:XAUUSD ) started to rise today after the release of the
ISM Manufacturing PMI index formed a new All-Time High(ATH) .
The question is what price range could the new ATH price range for gold be in?
Gold is currently moving near the Potential Reversal Zone(PRZ)($3,557-$3,531)

Gold will continue to grow inside upward channelHello traders, I want share with you my opinion about Gold. The market context for Gold has been firmly bullish since the price broke out of its prior consolidation range, a move that originated from the deep buyer zone. This breakout shifted the market structure, initiating a new impulsive phase th

GOLD → The uncertainty factor before the news. Down / up?FX:XAUUSD after updating another high to 3578 went into the phase of profit taking before two busy news days. The trend is aggressively bullish, but the risks of correction are quite high due to the uncertainty factor....
The price pulled back from record highs amid profit taking and reduced pan

Gold Continues to Create New HistoryHello, it’s a pleasure to see you again in today’s discussion about OANDA:XAUUSD . In this analysis, I have chosen the D1 chart for evaluation.
At the time of writing, gold continues to rise higher. The metal has reached the highest level in history, trading at 3535 USD. Previously, we had expect

Lingrid | GOLD Price Correction and Bullish Trend ContinuationOANDA:XAUUSD has surged to test the resistance zone above 3,500 after strong bullish momentum carried price through the wedge breakout. The structure is defined by an upward channel, with the latest higher low aligning with trend continuation. As long as price holds above 3,490, the bullish bias re

Gold Market Live Update Bulls Broke 3500 USD S/R💰 Gold Prices Live Update
• Spot gold consolidating $3,535–$3,545/oz, after a decisive breakout above the multi-month range ($3,300–$3,450).
• Fresh all-time highs were set this week, with spot hitting $3,575 and U.S. futures spiking to $3,602 intraday.
• Current pullback appears mild and orderly,

GOLD (XAUUSD): Bullish Trend ContinuesGOLD is currently exhibiting a robust bullish trend, having recently reached a new higher high.
Following this upward movement, the market entered a phase of consolidation within a narrow parallel channel on the hourly time frame.
The recent violation of the resistance indicates a likely contin

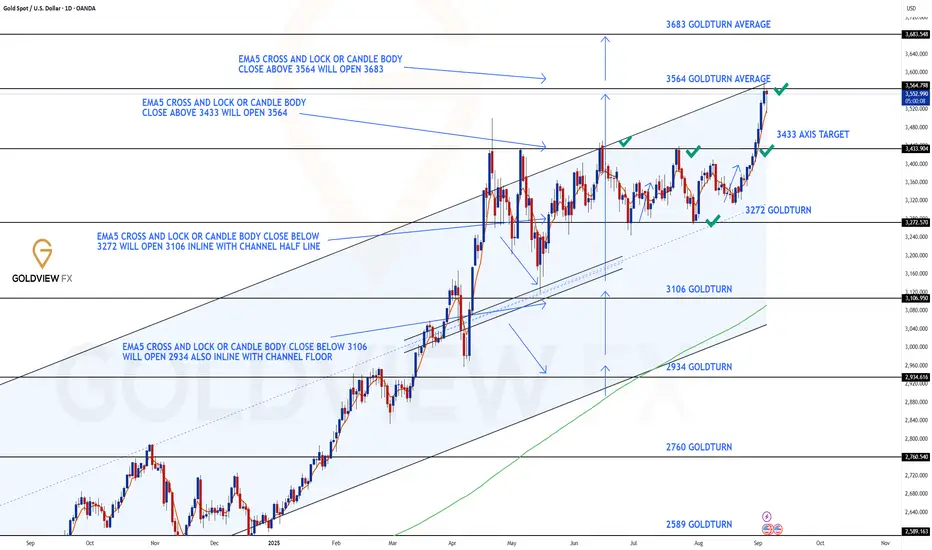
DAILY CHART ROUTE MAP UPDATEHey Everyone,
After completing our 1h and 4H chart this week, please now see update on our daily chart idea that we have been tracking. This chart idea has also played out to perfection!!
Sunday we advised that 3433 had now produced a candle body close above this level leaving gap target open for
See all futures ideas
USD/CAD - Bullish Pennant (04.09.2025)The USD/CAD pair on the M30 timeframe presents a Potential Buying Opportunity due to a recent Formation of a Bullish Pennant Breakout Pattern. This suggests a shift in momentum towards the upside and a higher likelihood of further advances in the coming hours.
Possible Long Trade:
Entry: Conside

GBP/USD –> Bearish Channel in Play, Watching for Short EntriesHello guys!
The pair remains under pressure, trading inside a descending channel that has been guiding price action for several weeks. Each rally attempt has been capped by the channel’s upper boundary, confirming the overall bearish sentiment.
Observations:
Resistance Zone: The upper boundary o

GBPUSDHello Traders! 👋
What are your thoughts on GBPUSD?
After rejecting a resistance area, GBP/USD has entered a corrective phase and is now approaching a high-confluence support zone, where multiple technical elements align
Price is expected to show bullish reaction within the support zone after some

EURUSD – Struggling in the Decision Zone👋Hello everyone, what do you think about the FX:EURUSD trend?
Today, EURUSD continues to move within a narrow range, reflecting a sideways market after several sessions of consolidation. At the moment, price is still supported by the rising trendline and the 1.1620 – 1.1580 support zone. This re

EURUSD – Short-Term Uptrend ResumesRecent news shows that U.S. economic data has weakened (JOLTS and Factory Orders came in below expectations), increasing market expectations that the Fed may cut interest rates soon. This has weakened the USD, providing upward momentum for EURUSD.
On the 4H chart, the pair is maintaining its bullis

04.09.25 Morning ForecastPairs on Watch -
FX:GBPAUD
FX:EURJPY
FOREXCOM:COFFEE
FX:NZDCAD
A short overview of the instruments I am looking at for today, multi-timeframe analysis down to what I will be looking at for an entry. Enjoy!

Could we see a bearish reversal?USD/JPY is rising towards the resistance level which his an overlap resistance that lines up with the 23.6% Fibonacci retracement and could reverse from this level to our take profit.
Entry: 148.14
Why we like it:
There is an overlap resistance level that lines up with the 23.6% Fibonacci retraceme

GBP/USD|EMA200 Support&Trendline Holding–Bullish Potential AheadThe GBP/USD daily chart is respecting the 200 EMA (blue line) as dynamic support, while also holding above the long-term uptrend line.
Key points from the chart setup:
✅ EMA200 acting as strong support – price rejected near this level multiple times.
✅ Uptrend structure intact – higher highs & hi

NZD/CHF – Ready to Rebound?NZD/CHF – Ready to Rebound?
NZD/CHF recently touched 0.4670, which may have been the bottom—unless the SNB surprises the market again.
The pair is showing signs of a bullish reversal. The structure looks supportive of an upward move, and price is currently in extremely oversold territory.
If con

EURUSD Potential continuation setup from OBPrice took out Monday range liquidity in fib61.8 weekly move.
I will be looking for long. On Thursday mornings.
Most traders don’t lost because they’re wrong.
They lose because they’re active on days they should be silent.
NFP week , be careful
David Perk

See all forex ideas
| - | - | - | - | - | - | - | ||
| - | - | - | - | - | - | - | ||
| - | - | - | - | - | - | - | ||
| - | - | - | - | - | - | - | ||
| - | - | - | - | - | - | - | ||
| - | - | - | - | - | - | - | ||
| - | - | - | - | - | - | - | ||
| - | - | - | - | - | - | - |
Trade directly on the supercharts through our supported, fully-verified and user-reviewed brokers.


