Wall Street Weekly Outlook - Week 44 2025 [27.10.- 31.10.2025]Wall Street Weekly Outlook – Week 44, 2025 📊💥
Let’s dive into another exciting trading week! 🚀
Rate decisions, month-end flows, and fresh quarterly earnings are setting the stage for strong market moves.
Sit back, enjoy the overview, and dive into the world of banks, hedge funds, and institution

The best trades require research, then commitment.
Get started for free$0 forever, no credit card needed

Scott "Kidd" PoteetThe unlikely astronaut

Where the world does markets
Join 100 million traders and investors taking the future into their own hands.

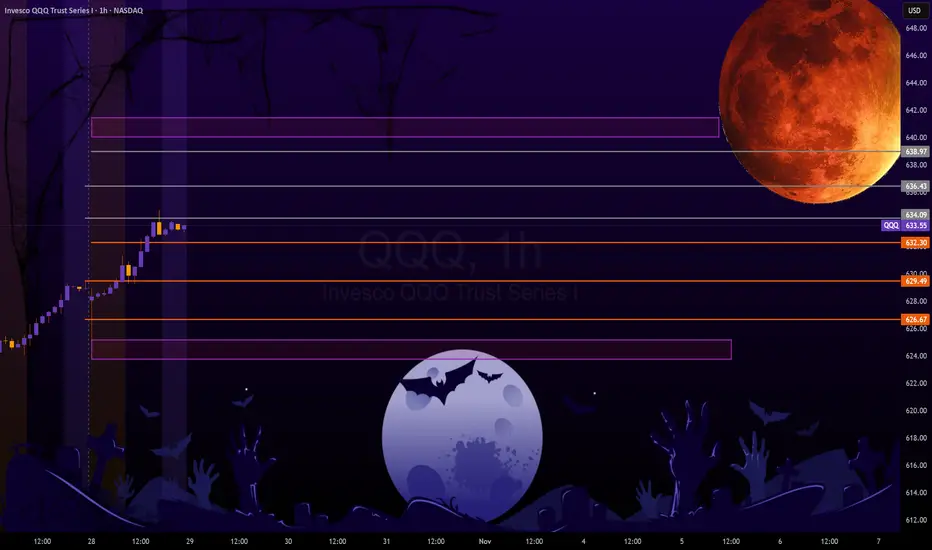
QQQ: Preparation for FOMC... and Halloween Okay, so here is my annual Halloween themed post! Have to stick to tradition I guess.
Here I am sharing intra-day predictions in anticipation for FOMC release tomorrow.
The FEDS are between a rock and a hard place. As the Federal reserve depends on the federal government to release statistics, i
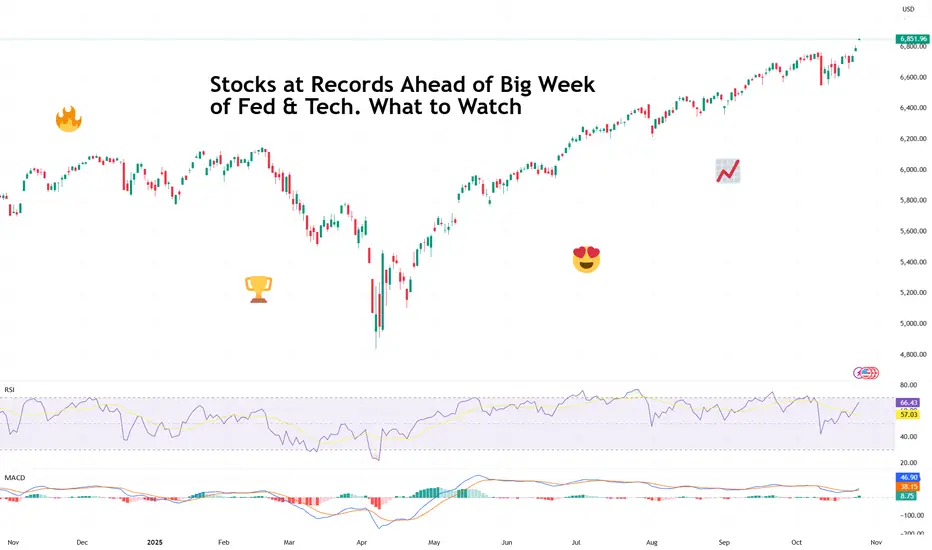
Stocks at Records Ahead of Big Week of Fed & Tech. What to WatchRecord highs, rate-cut optimism, five tech giants on deck — what a time to be a market participant!
It’s Monday, and Wall Street is back doing what it does best — setting new records and pretending not to worry about what comes next.
After a cooler-than-expected inflation print and some diplomat
BTCUSDT – When the Bullish Wave ReturnsBitcoin is showing a notable recovery phase after a series of previous corrections. On the daily timeframe, price continues to move within an ascending channel that has been forming since the beginning of Q3.
Currently, BTC is approaching the midline of the channel around 115,000–116,000 USD , w

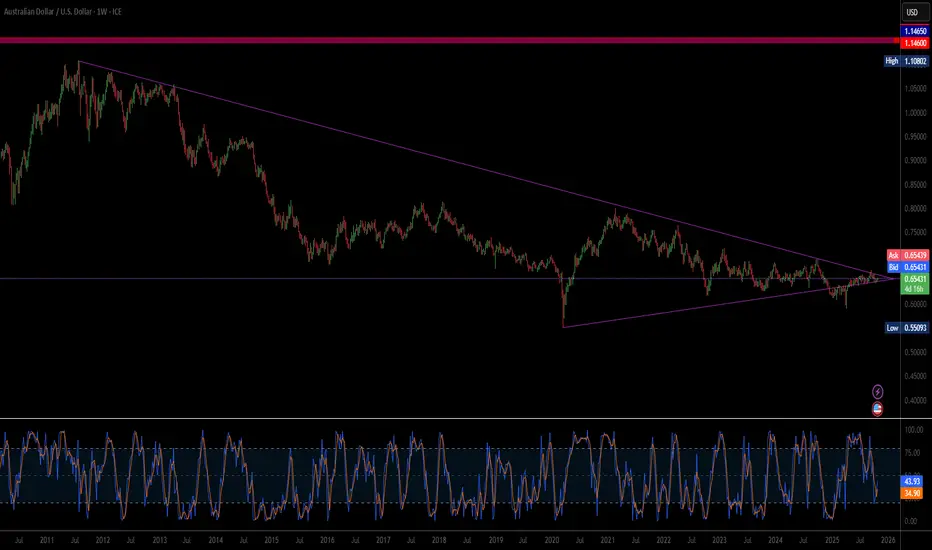
Is Geopolitical Re-Alignment the New AUD Catalyst?The Australian Dollar's (AUD) sharp surge against the US Dollar (USD) is driven by a powerful synergy of geopolitical de-escalation and structural economic realignment. Near-term momentum stems from optimism surrounding an imminent US-China trade deal. As a primary commodity exporter and a financial
Can WTI’s 8% Rally Hold After Trump-Putin Summit Collapse?WTI just staged its biggest two-day rally since June, as hopes for a Trump-Putin summit were dashed, leading to new US sanctions on Russian oil exports.
Here’s what’s fuelling the move and what traders should watch next:
- US sanctions on Russia’s top oil producers after failed Budapest summit tr

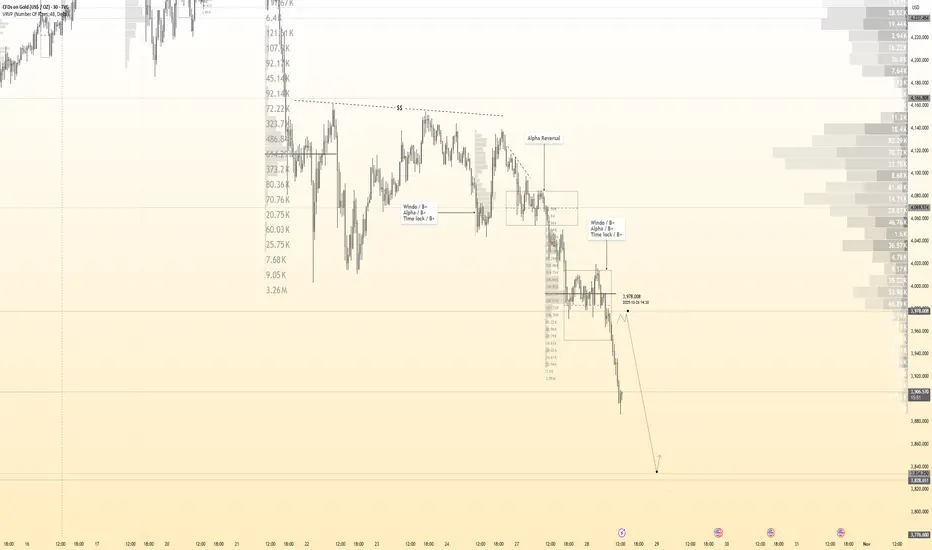
XAUUSD-seeking $4,000 region?As my H4 chart shows, gold did make a double top a few days ago and then crashed. You can give credit for this massive 3,800 points move to profit taking or economic uncertainty or any technical reason, maybe a combination but it really does not matter.
What does matter is that we now have a double

BTCUSDT: Bounce from Support Could Ignite Rally Toward $114KHello everyone, here is my breakdown of the current Bitcoin setup.
Market Analysis
Bitcoin (BTCUSDT) has recently transitioned from a bearish phase to a bullish structure after breaking out of a prolonged downward channel. The market had been forming a sequence of lower highs and lower lows until

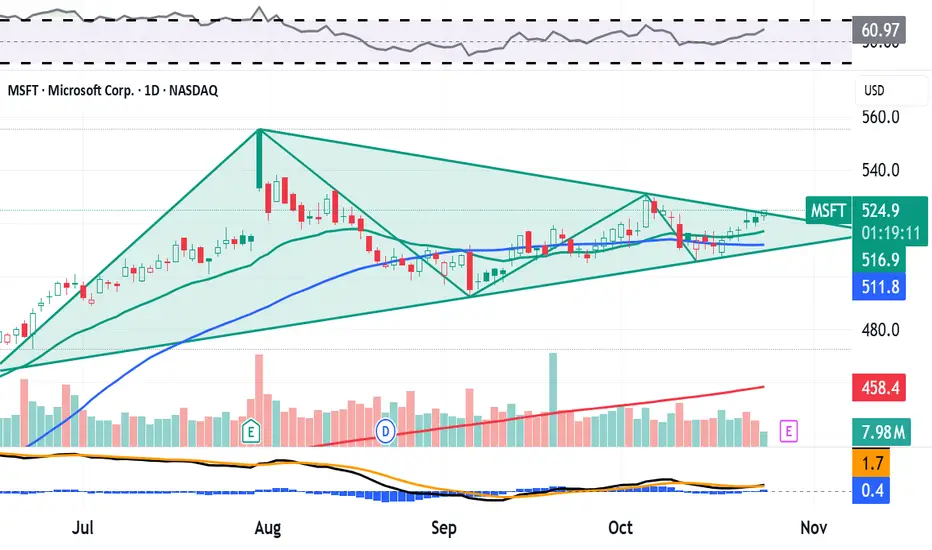
Here's What Microsoft's Chart Says Heading Into EarningsMicrosoft NASDAQ:MSFT , which will release earnings next week, is beating the S&P 500 SP:SPX year to date -- up 24.4% vs. about 15.7% for the SPX. MSFT has also gained roughly 112% over the past three years, while the S&P 500 has added just 78.9%. What does the company's chart show us ahead of e
Tesla Stock Wobbles as Profit Dives 37%, Revenue Pops. Now What?Tesla NASDAQ:TSLA posted a 12% jump in revenue on Wednesday, reaching $28.1 billion, well above Wall Street’s $26.37 billion estimate. And yet, the stock slipped nearly 1% on the day before paring back that loss with a 2.3% Thursday gain.
Why? Because profits fell faster than Cybertruck’s reput

See all editors' picks ideas
Range Oscillator (Zeiierman)█ Overview
Range Oscillator (Zeiierman) is a dynamic market oscillator designed to visualize how far the price is trading relative to its equilibrium range. Instead of relying on traditional overbought/oversold thresholds, it uses adaptive range detection and heatmap coloring to reveal where pri

Volume Surprise [LuxAlgo]The Volume Surprise tool displays the trading volume alongside the expected volume at that time, allowing users to spot unexpected trading activity on the chart easily.
The tool includes an extrapolation of the estimated volume for future periods, allowing forecasting future trading activity.
🔶 U

Smooth Theil-SenI wanted to build a Theil-Sen estimator that could run on more than one bar and produce smoother output than the standard implementation. Theil-Sen regression is a non-parametric method that calculates the median slope between all pairs of points in your dataset, which makes it extremely robust to o

Fair Value Gaps by DGTFair Value Gaps
A refined, multi-timeframe Fair Value Gap (FVG) detection tool that brings institutional imbalance zones to life directly on your chart.
Designed for precision, it visualizes how price delivers into inefficiencies across chart, higher, and lower (intrabar) timeframes — offering a fl

TASC 2025.11 The Points and Line Chart█ OVERVIEW
This script implements the Points and Line Chart described by Mohamed Ashraf Mahfouz and Mohamed Meregy in the November 2025 edition of the TASC Traders' Tips , "Efficient Display of Irregular Time Series”. This novel chart type interprets regular time series chart data to create an ir

Simplified Percentile ClusteringSimplified Percentile Clustering (SPC) is a clustering system for trend regime analysis.
Instead of relying on heavy iterative algorithms such as k-means, SPC takes a deterministic approach: it uses percentiles and running averages to form cluster centers directly from the data, producing smoo

Adaptive Volume Delta Map---
📊 Adaptive Volume Delta Map (AVDM)
What is Adaptive Volume Delta Map (AVDM)?
The Adaptive Volume Delta Map (AVDM) is a smart, multi-timeframe indicator that visualizes buy and sell volume imbalances directly on the chart.
It adapts automatically to the best available data resolution

Dynamic Equity Allocation Model"Cash is Trash"? Not Always. Here's Why Science Beats Guesswork.
Every retail trader knows the frustration: you draw support and resistance lines, you spot patterns, you follow market gurus on social media—and still, when the next bear market hits, your portfolio bleeds red. Meanwhile, institution

First Passage Time - Distribution AnalysisThe First Passage Time (FPT) Distribution Analysis indicator is a sophisticated probabilistic tool that answers one of the most critical questions in trading: "How long will it take for price to reach my target, and what are the odds of getting there first?"
Unlike traditional technical indicators

PongExperience PONG! The classic arcade game, now on your charts!
With this indicator, you can finally achieve your lifelong dream of beating the Markets. . . at PONG!
Pong is jam-packed with features! Such as:
2 Paddles
A moving dot
Floating numbers
The idea of a net
This indicator is solel

See all indicators and strategies
Community trends
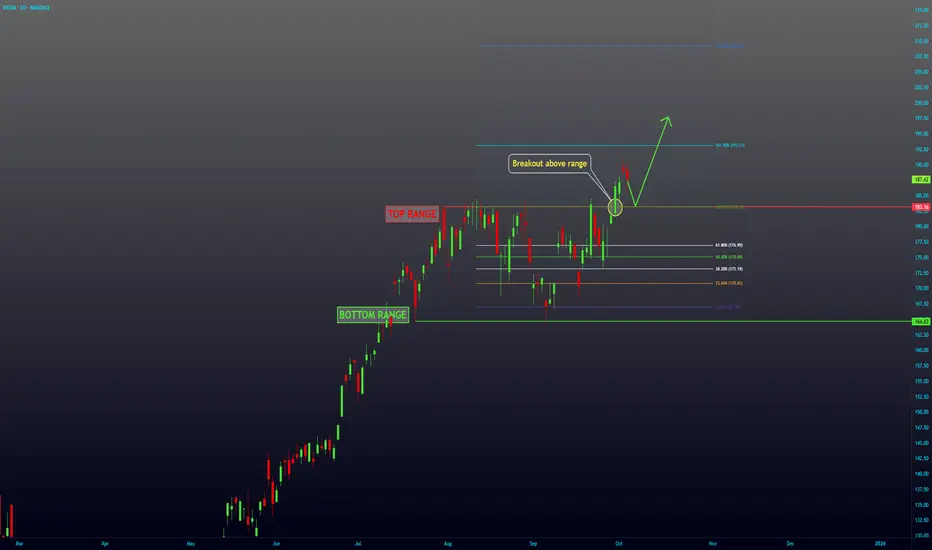
Nvidia - Squeezing every single bear!🧯NVidia ( NASDAQ:NVDA ) is finally breaking out:
🔎Analysis summary:
Over the course of the past couple of months, Nvidia has been rallying +125%. Considering the market cap of Nvidia, this is already an insane move but clearly not the end. We can still see another +25% from here, before Nvidi

Nuburu, Inc. Common Stock (BURU)Stock is ready to move up in Motive powerful 3rd wave.
Target short term period is = 1.46$ - 1.55$ .
5ith wave looks will end at between 2.19$ - 2.46$ .
Highly & Strongly recommended for BUY 💥 👌 💥💥💥💥💥

$BYND - The Next GMELet's look at the thesis behind this idea :-
1) Massive Short interest.
2) Falling Wedge Pattern.
3) Diamond Hands are back again and This time they are supporting BYND.
4) Untapped Liquidity Resting above and possibility of liquidating Shorts would also be appealing to Market makers to supply L

Low Risk, Newbie Swing TradeJetBlue Airways (JBLU) Trade Plan
Ticker: JBLU
Exchange: NASDAQ
Current Price: ~$4.72
Chart Timeframe: 1D (Daily)
Upcoming Catalyst: Earnings – October 28, 2025
Resistance Zones:
$5.55 – Strong resistance from past highs.
$5.07 – Near-term resistance where price has repeatedly rejected.
Su

Netflix: A Correction Within a Strong UptrendNetflix: A Correction Within a Strong Uptrend
NASDAQ:NFLX has gone through a lot over the past few years, from huge growth to deep corrections, and lately we’ve seen a (healthy?) 20% pullback that brought the price right to the lower boundary of its long-term ascending channel.
At first glanc

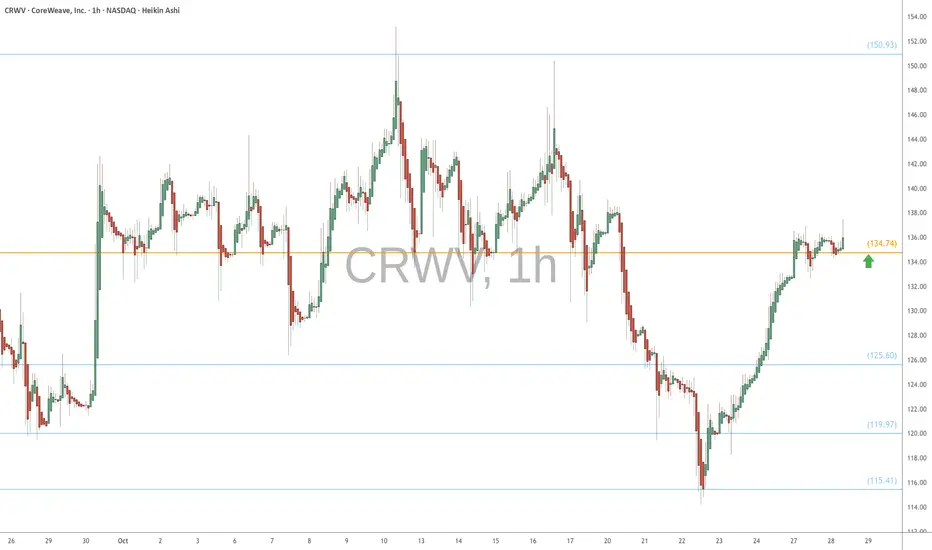
CRWV eyes on $134.74: proven Golden Genesis fib the KEY supportCRWV recovery wave is at a very important stage.
Now trying to launch from Golden Genesis at $134.74
Looking for a new ATH from here, stop loss just below.
.
See "Related Publications" for previous plots such this EXACT BOTTOM call:
Hit BOOST and FOLLOW for more such PRECISE and TIMELY charts.
=
NVDA Breakout -- Continuation UPNASDAQ:NVDA has been in a range since end of July until September 30th, where it broke above the range. I expect to see more upside from here.
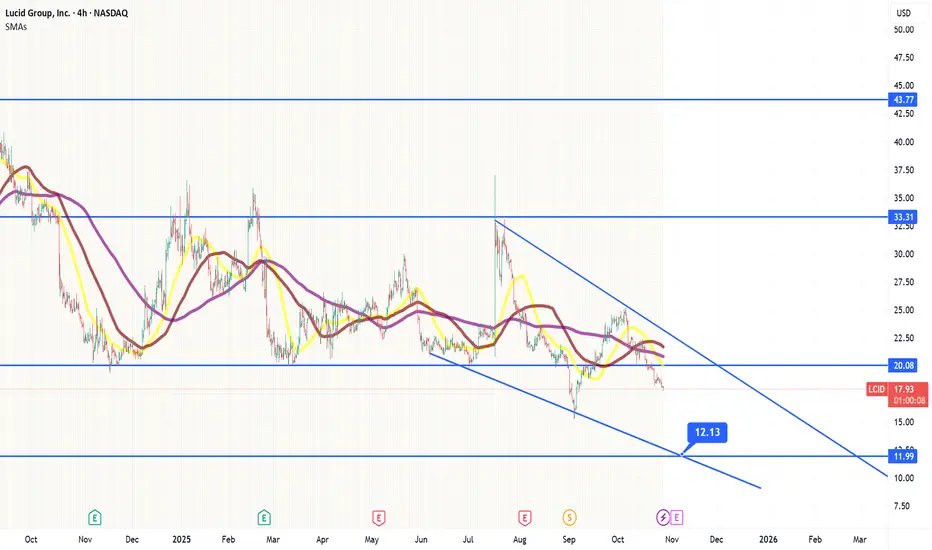
$12 after q3 resultsLucid is bleeding cash and not meeting goals. $12 after q3 seems reasonable.
Superior EV's don't matter when they cost you $200k per car.
I doubt Lcid is around in 5 years time.
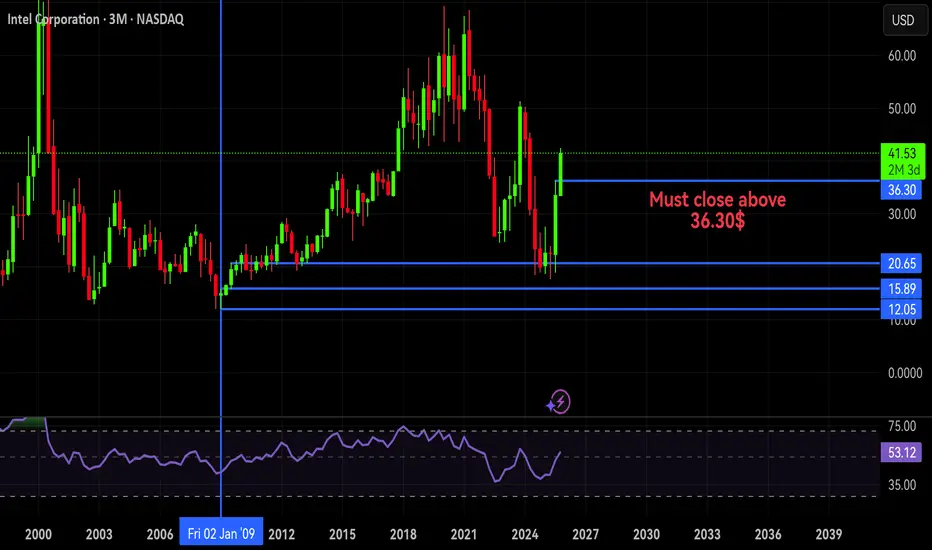
Intc 3 months chartIntel stock (INTC)
If it closes above the $36.30 level by the end of this year,
it will turn bullish 😉😉
Wish you a good catch! 🎣
Ahmad adly🃏
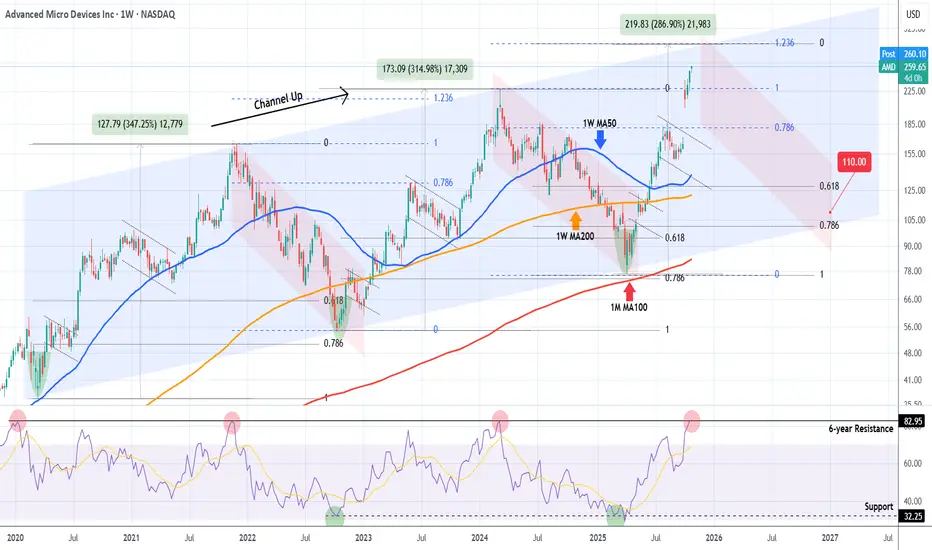
AMD Is it approaching a multi-year top and turning into a Sell ?Almost 8 months ago (March 07, see chart below) we made a bold call (for the time) on Advanced Micro Devices (AMD), expecting it to bottom on its 1M MA100 (red trend-line) and then rebound, targeting $320:
Well the Bullish Leg of its 6-year Channel Up had been even more aggressive than we expe
See all stocks ideas
Today
CPFCentral Pacific Financial Corp New
Actual
—
Estimate
0.72
USD
Today
SITESiteOne Landscape Supply, Inc.
Actual
1.46
USD
Estimate
1.28
USD
Today
RDWRRadware Ltd.
Actual
0.28
USD
Estimate
0.27
USD
Today
CNCCentene Corporation
Actual
0.50
USD
Estimate
−0.14
USD
Today
TELTE Connectivity plc
Actual
2.44
USD
Estimate
2.29
USD
Today
CLVTClarivate Plc
Actual
—
Estimate
0.16
USD
Today
CSTMConstellium SE
Actual
—
Estimate
0.35
USD
Today
UTHRUnited Therapeutics Corporation
Actual
7.16
USD
Estimate
7.32
USD
See more events
Community trends
Bitcoin Setting Up a Bullish Megaphone Toward $160KBTCUSDT has completed its previous falling wedge pattern, fully reaching its projected target.
Price is now consolidating within a developing bullish megaphone structure, suggesting continued expansion and volatility.
If structure holds, the next projected upside target points toward the $160K zone

BITCOIN (BTC/USD): Rise to 120,000 Confirmed!There is a strong possibility that 📈Bitcoin will continue its bullish trend this week.
Following the completion of a correctional movement on a 4-hour time frame,
which has been confirmed by a bullish Change of Character (CHoCH).
The price will probably ascend to the $120,000 resistance level, p

BTC Bulls Break the FlagBitcoin price has been pushing higher.
After that impulsive leg, momentum started to cool off, forming a tight descending flag.
This pullback isn’t weakness, it’s a pause.
Sellers are trying to push price lower, but notice how shallow the retracement is. Buyers are still defending every dip.
Now,

Bitcoin Rally Heating Up – Watch This Zone Carefully!As the new week kicked off, Bitcoin ( BINANCE:BTCUSDT ) started to climb, fueled by a pump in the S&P500 index ( SP:SPX ) and the creation of a gap in the S&P500 index.
It seems Bitcoin has successfully broken above the 100_SMA(Daily) and 50_SMA(Daily) , as well as a Resistance zone($114

Bitcoin Approaches Key Resistance — Bulls Eye 117K BreakoutHello traders, I want to share my view on Bitcoin (BTCUSD). The current market structure shows a gradual recovery phase following the previous breakdown from a large range near the 118,000 level. After a sharp decline and retest of the 106,400 support zone, the market found strong buying interest, f

BTCUSD Short: Sellers Aiming for a Pullback Toward 109,600Hello, traders! Bitcoin (BTCUSD) continues to trade within a broader corrective structure after losing momentum from its previous bullish phase inside the Ascending Channel. The breakdown from the channel shifted the short-term sentiment from bullish to neutral-bearish, with sellers now defending th

Ethereum (ETH/USDT): Possible Short OpportunityHi guys!
ETH is currently testing the ascending trendline support after forming a potential lower high near the $4,165 zone. The structure shows early signs of weakness as buyers failed to maintain momentum above the last swing top.
A clean break below the trendline could confirm a short-term bear

#XRPUSDT: Swing Buy At 2.60, Possible Target At 3.50! We have strong bullish confirmation in smaller time frames that we can take a swing buy entry on XRPUSDT. There is a single major target at 3.50 but the price could move beyond that region. Please like and comment on the next cryptocurrency pair you would like us to analyse.
Team Setupsfx

COAI 4.25 bottom looking goodbasic tip a massive capitulation is opportunity
with volume and heavy participation
this looks like an easy riskless trade back to at least $14 or better yet after FOMC on Thur Oct 30 towards $31++

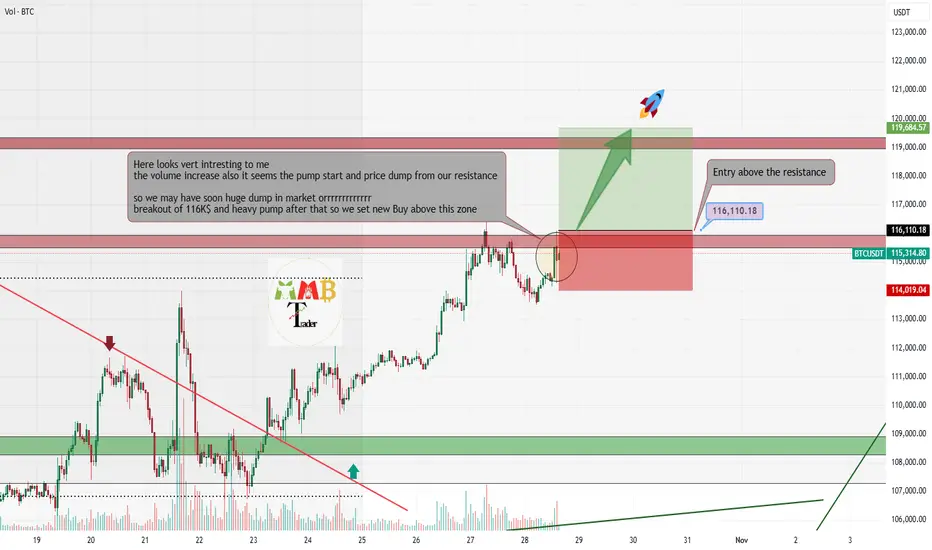
Bitcoin next hours can bring massive dump or Pump!!!The upcoming trading session is critical for Bitcoin as price approaches the significant $116,000 resistance zone. We are observing a notable increase in trading volume, which often serves as a precursor to a decisive price movement.
This volume surge ahead of a key level increases the probability
See all crypto ideas
Gold Drops Sharply – Losing Over 1000 Pips👋Hello everyone , what do you think about OANDA:XAUUSD ?
Gold continues to lose value for the third consecutive session on Tuesday, dropping to its lowest level in three weeks. Currently, the price is hovering around 3,930 USD, down more than 50 USD from the start of the session and losing more

XAU/USD : Gold Breaks $4,000 Support – Can Bulls Hold the Line?By analyzing the Gold (XAUUSD) chart on the 2-hour timeframe, we can see that after rising to $4,138 and entering the marked supply zone, gold faced strong selling pressure and continued to drop, finally breaking below the $4,000 support and reaching $3,971.
As shown on the chart, this area is a k

Gold Market Update: Correction Mode 3750/3500 USD possible🟡 Where We Are Right now
After ripping to fresh records, gold snapped hard — WSJ logged the steepest one-day loss in years last week and a follow-through weekly drop as longs unwound.
Analysts across Kitco and others frame this as a technical/positioning correction after a parabolic run, with a f

XAUUSDHello Traders! 👋
What are your thoughts on Gold?
Gold experienced a sharp decline last week, but found support around the $4,000 zone, leading to a modest rebound.
Since then, the price has entered a range-bound phase, oscillating between key support and resistance levels.
Current Outlook:
The nex

Lingrid | GOLD Weekly Support Zone: Short Term Upside MoveOANDA:XAUUSD is approaching the weekly support area near 3,880, suggesting a short-term bullish impulse might be formed within the downward channel. Price action now moved below the 4,050, which aligns with prior breakdown structure and acts as a potential resistance level. As long as price sustain

GOLD → Sell-off due to uncertainty FX:XAUUSD is falling, the trend is downward, and we have confirmation of this. Profit-taking is leading to a decline, which is causing buyers to exit the market...
Caution ahead of the Fed: Markets are pricing in a 25 bp rate cut, but the main thing is the tone of the statement and Powell's commen

GOLD - Stop Trading Gold For NowGOLD - Stop Trading Gold For Now
For now, stay away from gold. I just see that something strange is happening and the reason is just some manipulation and nothing more.
Below is what I am reading, but it doesn't make sense:
💬A thaw in US-China trade relations has kind of pulled the rug out from u

XAUUSD Crashes 1500 Pips — Key Supports Gone!Gold started the week poorly, dropping around 1500 pips and, more importantly, breaking three key support levels:
• the rising trendline that started back in August,
• the 4020 horizontal support zone,
• and even the psychological 4000 level.
Overnight, the price attempted to reclaim 4000, but fail

( Gold Protocol ) Bearish Reversal Detected( Gold Protocol ) Bearish Reversal Detected
Bearish Reversal : 3978
Status: Active Reversal Protocol
Symbol: Gold
Session: London–New York Overlap (Smart Exit Window)
➕Bias: Bullish & bearish Reversal
☄️ Volume Surge Confirmed — Sellers dominate exhausted highs
☄️ Session Aligned — Smart mon
Gold A waiting for rebound raising hopes for a potential tradeGold prices regained some lost ground on Tuesday after breaking below the key 4,000 support level. Following a sharp 32% decline in the previous session, the market is showing signs of stabilization. The rebound was supported by encouraging progress in U.S.–China trade negotiations, as both countrie

See all futures ideas
EURUSD Breakdown Looms: Sellers Target 1.1560 Support ZoneHello traders, I want to share my opinion about the current EURUSD setup. After an extended bearish movement, EURUSD continues to trade within a descending channel, clearly defined by a Resistance Line connecting recent lower highs and a Support Line connecting the local lows. This structure outline

EUR/GBP - Bullish Channel (28.10.2025)🧠 Setup Overview:
EUR/GBP continues to trade within a well-defined bullish channel, holding strong above the key support zone near 0.8720–0.8715. The pair has respected the trendline multiple times, showing consistent buying interest. As long as price stays within the channel, the short-term bias re

EURUSD Short: Retest of Resistance Before Next Leg DownHello traders! The overall market structure for EURUSD continues to favor the bears, following a sharp rejection from the 1.1720 supply zone. This area marked a strong pivot point where the price failed to sustain any further bullish momentum and began forming a clear descending channel, establishin

USD/JPY 30-Min — Volume Sell Reversals TriggeredStatus: Active Reversal Protocol
🆚Symbol: USDJPY
Session: London–New York Overlap (Smart Exit Window)
Bearish Reversal 152.850
☄️ Volume Surge Confirmed — Sellers dominate exhausted highs
☄️ Session Aligned — Smart money exit window open
☄️ Cluster Shield Active — Supply imbalance verified

AUDUSD → Attempt to reverse the trend to bullish FX:AUDUSD is forming a correction after breaking through the resistance of the downward channel. The market needs a trading range or consolidation above 0.6526.
The dollar is consolidating but is not ready to continue growing. Pressure on the currency is emerging ahead of the Fed meeting. This

AUDUSD Rebounds Strongly: Double Bottom Signals Bullish ReversalAUDUSD Rebounds Strongly: Double Bottom Signals Bullish Reversal
AUDUSD has formed a Double Bottom Pattern around the 0.6460 support zone — a classic bullish reversal signal.
The pair has since broken above a minor resistance, confirming short-term bullish momentum.
Currently trading near 0.6550,

Euro Under Pressure from Strong USDThe euro continues to show weakness against the dollar as global risk sentiment cools and investors shift toward safer assets. Market participants remain cautious ahead of key inflation data from the Eurozone and upcoming comments from Federal Reserve officials, which could clarify the next phase of

EURUSD: Buyers Gaining Momentum Near Key Support ZoneHello everyone, here is my breakdown of the current Euro setup.
Market Analysis
EURUSD has been moving within a clear downward channel, forming consistent lower highs and lower lows over the past few weeks. Each attempt to break above the resistance line has resulted in a fake breakout, confirmin

USDJPY Breaks Out Strongly, Next Target 153.700!Based on the current chart and recent news, USDJPY is showing strong signs of an uptrend. The pair has recently found support at 151.000 and has bounced back strongly from there, creating an ascending triangle price structure. Technical indicators like the EMA are supporting the bullish momentum, es

USD/JPY Selling pressure from key resistance area at 153,200USD/JPY SELL Setup
Pair is reacting from a key resistance zone around 153.200
Currently showing signs of rejection on the 1H time frame
📌 Technical Targets:
🎯152.500
🎯151.600
Bias: Bearish
momentum expected while below 153.200
Watching for confirmation candles before entry
#USDJPY #ForexSign

See all forex ideas
| - | - | - | - | - | - | - | ||
| - | - | - | - | - | - | - | ||
| - | - | - | - | - | - | - | ||
| - | - | - | - | - | - | - | ||
| - | - | - | - | - | - | - | ||
| - | - | - | - | - | - | - | ||
| - | - | - | - | - | - | - | ||
| - | - | - | - | - | - | - |
Trade directly on the supercharts through our supported, fully-verified and user-reviewed brokers.


