IBEX 35 Hits Historic LevelIBEX 35 Hits Historic Levels, Facing the Challenge of Winning Back Retail Investors
Ion Jauregui – Analyst at ActivTrades
01/12/2025
The IBEX 35 has officially returned to territory unseen since 2007. The Spanish benchmark is trading at historic highs and has established itself in 2025 as the b

The best trades require research, then commitment.
Get started for free$0 forever, no credit card needed

Scott "Kidd" PoteetThe unlikely astronaut

Where the world does markets
Join 100 million traders and investors taking the future into their own hands.

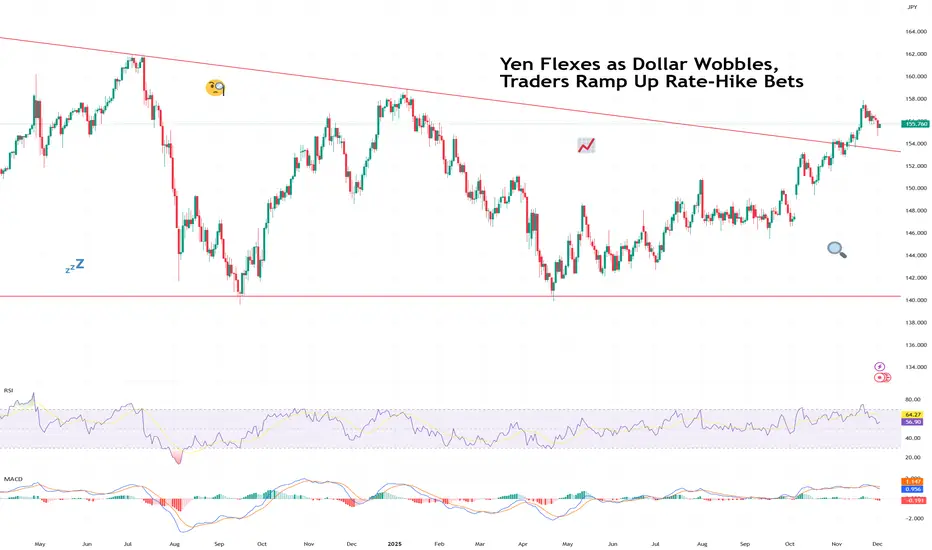
Yen Flexes as Dollar Wobbles, Traders Ramp Up Rate-Hike BetsThe yen came into Monday looking calm… and then proceeded to bench-press the dollar.
The FX:USDJPY pair slid under ¥155, hitting a session low of ¥154.65, after BoJ Governor Kazuo Ueda dropped one of the most powerful phrases in global FX:
“We will weigh the pros and cons of tightening.”
In Tok
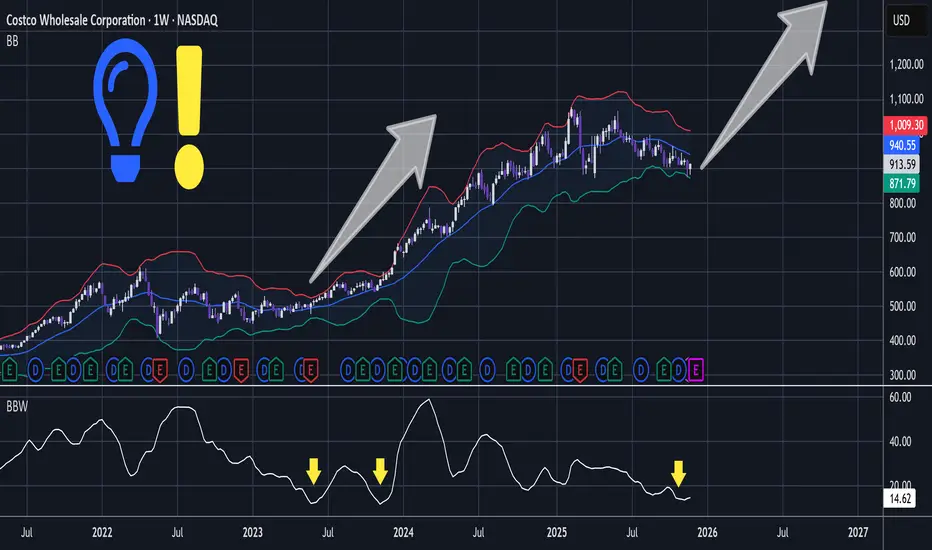
COST - Retail Powerhouse In Ideal HTF PositionShallow compressive action has printed contracting Bollinger Bands.
Notice that the BBW - Bollinger Band Width is similar to the previous correction before breakout.
In lower time frame the significantly sized slump has whipsawed through support and wedge trendline to become a bullish engulf:
T
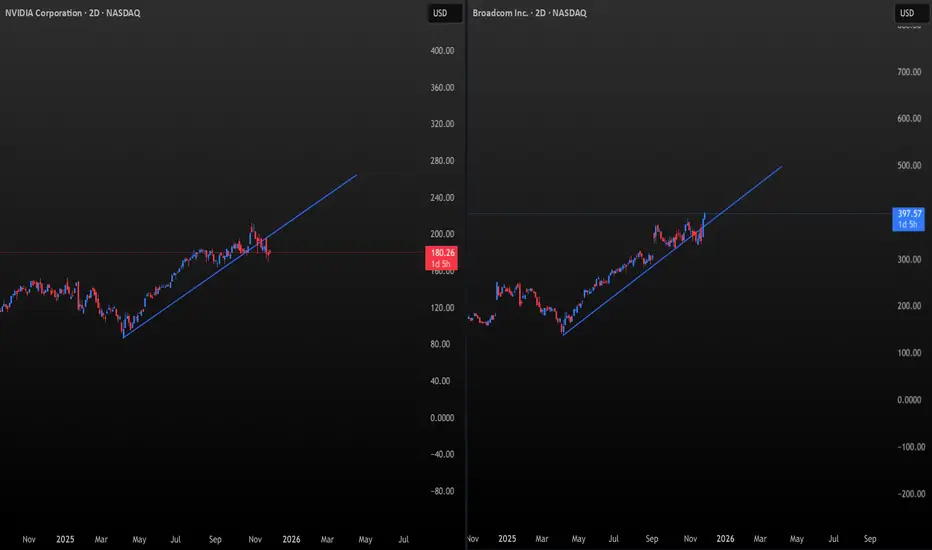
NVDA vs AVGO: The Battle for the AI Throne Has Begun⚡A New Leader Emerges in the Semiconductors
For years, NVDA was the undisputed titan — the gravitational center of the semiconductor universe.
But now, the geometry tells a different story.
THE CHARTS 📐
Both charts use the same natural scaling:
1° of time = $1 of price per unit.
And here’s the
SPX to Money Supply WARNING!If the charts aren’t showing bubble setups, I’m not going to invent them. I post what the data shows. So please don’t shoot the messenger when I say GTFO & STFO.
And just to keep the facts straight:
Brokerage, stock, and crypto accounts are not part of M2.
Why does M2 matter?
It’s the actual spe

Stocks Stage Comeback in Time for Thanksgiving. What's Behind ItIt’s Thanksgiving, and you know what that means. “Hey, sweety, why don't you come here and let us know how your high-beta stocks are doing. Here’s our little investor.”
And for once, the answer isn’t followed by a sigh. Stock traders are heading into the holiday with something they haven’t had in

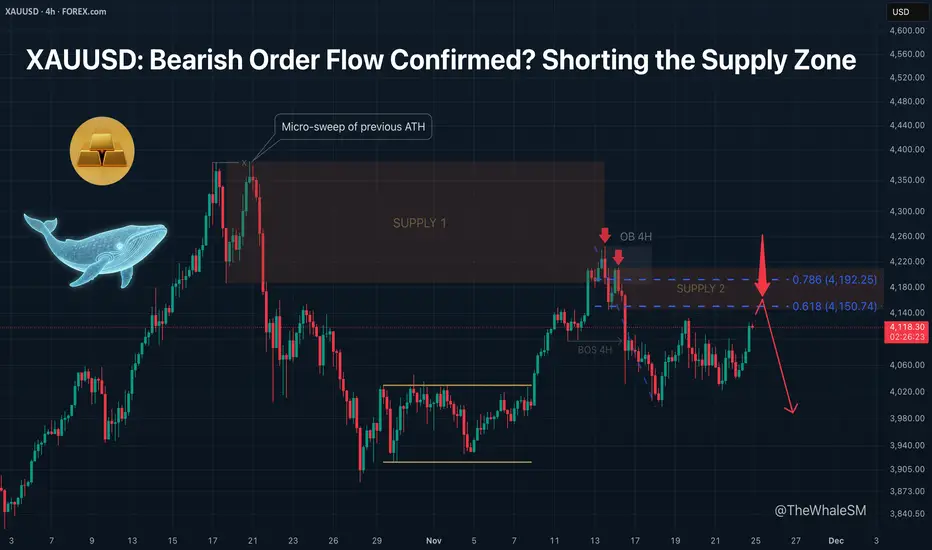
XAUUSD: Bearish Order Flow Confirmed? Shorting the Supply Zone.After updating the All-Time High (ATH), Gold performed a micro-sweep of liquidity from the previous ATH. This move was engineered via a Supply Zone . Following the sweep, this zone was mitigated, initiating a bearish order flow that broke the 4H structure to the downside (BOS 4H).
After the struc
ETHUSD H1 | Bullish Bounce Off Key SupportMomentum: Bullish
Price is currently above the ichimoku cloud.
Buy entry: 2,867.08
- Pullback support
- 61.8% Fib retracement
- 100% Fib projection
Stop Loss: 2,777.16
- Overlap support
Take Profit: 2,972.69
- Swing high resistance
High Risk Investment Warning
Stratos Markets Limited (tradu.com

NZDUSD downtrend continuation below falling resistanceThe NZDUSD currency pair continues to display a bearish outlook, in line with the prevailing downward trend. Recent price action suggests a corrective pullback, potentially setting up for another move lower if resistance holds.
Key Level: 0.5675
This zone, previously a consolidation area, now acts

PYPL USPayPal is a rare combination of value and growth.
The company demonstrates strong fundamentals, is strategically focused on the future, and trades at record-low multiples. The combination of financial discipline, capital return, and AI innovation makes it an attractive asset for long-term investor

See all editors' picks ideas
Match Finder [theUltimator5]Match Finder is the dating app of indicators. It takes your current ticker and finds the most compatible match over a recent time period. The match may not be Mr. right, but it is Mr. right now. It doesn't forecast future connection, but it tells you current compatibility for today.
Jokes aside,

Trend Line Methods (TLM)Trend Line Methods (TLM)
Overview
Trend Line Methods (TLM) is a visual study designed to help traders explore trend structure using two complementary, auto-drawn trend channels. The script focuses on how price interacts with rising or falling boundaries over time. It does not generate trade sign

Breakouts & Pullbacks [Trendoscope®]🎲 Breakouts & Pullbacks - All-Time High Breakout Analyzer
Probability-Based Post-Breakout Behavior Statistics | Real-Time Pullback & Runup Tracker
A professional-grade Pine Script v6 indicator designed specifically for analyzing the historical and real-time behavior of price after strong All-Ti

Count█ OVERVIEW
A library of functions for counting the number of times (frequency) that elements occur in an array or matrix.
█ USAGE
Import the Count library.
import joebaus/count/1 as c
Create an array or matrix that is a `float`, `int`, `string`, or `bool` type to count elements from, t

Holographic Market Microstructure | AlphaNattHolographic Market Microstructure | AlphaNatt
A multidimensional, holographically-rendered framework designed to expose the invisible forces shaping every candle — liquidity voids, smart money footprints, order flow imbalances, and structural evolution — in real time.
---
📘 Overview
The Hol

PriceFormatLibrary for automatically converting price values to formatted strings
matching the same format that TradingView uses to display open/high/low/close prices on the chart.
█ OVERVIEW
This library is intended for Pine Coders who are authors of scripts that display numbers onto a user's charts. T

LogNormalLibrary "LogNormal"
A collection of functions used to model skewed distributions as log-normal.
Prices are commonly modeled using log-normal distributions (ie. Black-Scholes) because they exhibit multiplicative changes with long tails; skewed exponential growth and high variance. This approach i

Range Oscillator (Zeiierman)█ Overview
Range Oscillator (Zeiierman) is a dynamic market oscillator designed to visualize how far the price is trading relative to its equilibrium range. Instead of relying on traditional overbought/oversold thresholds, it uses adaptive range detection and heatmap coloring to reveal where pri

Volume Surprise [LuxAlgo]The Volume Surprise tool displays the trading volume alongside the expected volume at that time, allowing users to spot unexpected trading activity on the chart easily.
The tool includes an extrapolation of the estimated volume for future periods, allowing forecasting future trading activity.
🔶 U

Smooth Theil-SenI wanted to build a Theil-Sen estimator that could run on more than one bar and produce smoother output than the standard implementation. Theil-Sen regression is a non-parametric method that calculates the median slope between all pairs of points in your dataset, which makes it extremely robust to o

See all indicators and strategies
Community trends
I don't own enough!I don't own enough of NYSE:ZETA even with my massive 15-20% holding across my investment portfolios and leaps galore.
The fundamentals scream buy anything under $25-$30, while the stock sits at sub-$20.
P/S less than 3, DCF model spitting out massive Margin of Safety based on conservative projec

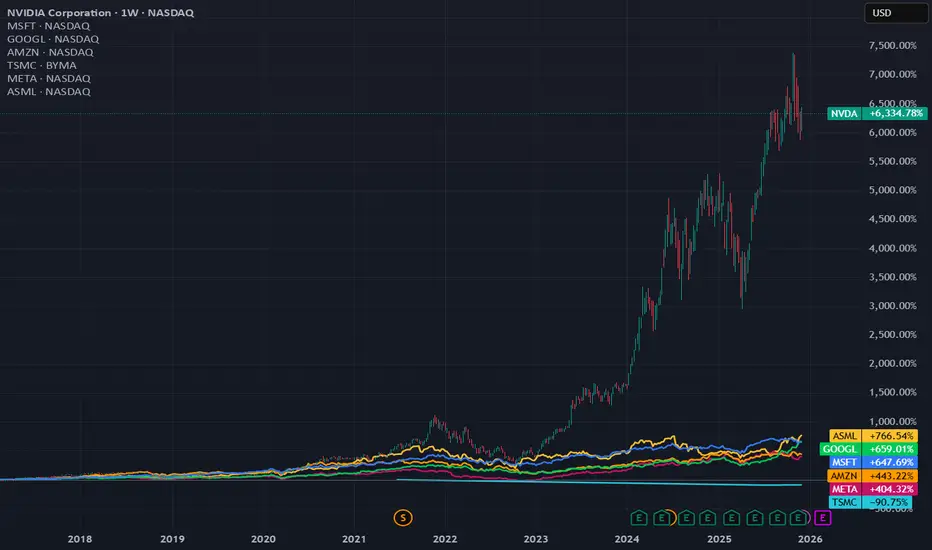
Comparative Performance of Key Stocks in Technology and AIThis chart presents a long-term analysis of the cumulative return of the most influential stocks in the technology ecosystem, focusing on companies central to Artificial Intelligence (AI) infrastructure and application.
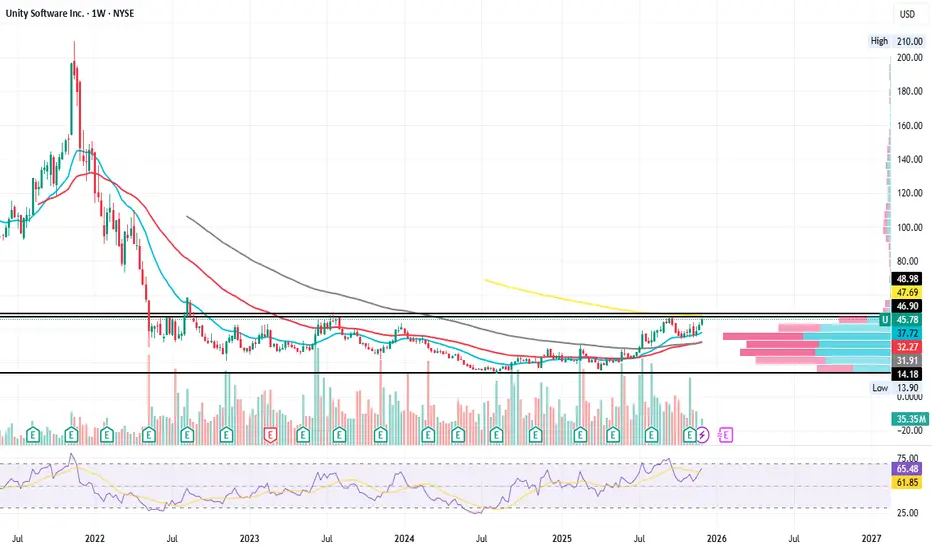
$U (Unity) from Accumulation to the Moon$U (Unity) has entered an accumulation channel and is now testing the channel's highs. The 200dEMA is a resistance, which, once broken, will allow prices to emerge and head towards new highs. I am obviously LONG.
APPLE Just formed its Cycle Top. Best sell opportunity is here.Almost 3 months ago (September 19, see chart below), we gave a buy signal on Apple Inc. (AAPL), which recently hit our final $290 Target:
This week we go back to the long-term 1W time-frame as the Bullish Leg (green) since the April 07 bottom just hit the top (Higher Highs trend-line) of its 4

CVNA - Let's do it againA short squeeze to the upside, right up to the center line. This is exactly where I like price to be.
For one, it’s the 80% target; and secondly, price has to make a decision at this equilibrium level.
If I see any weakness below the center line, I’ll hit it on the head again. §8-)
🔱 Happy tradin

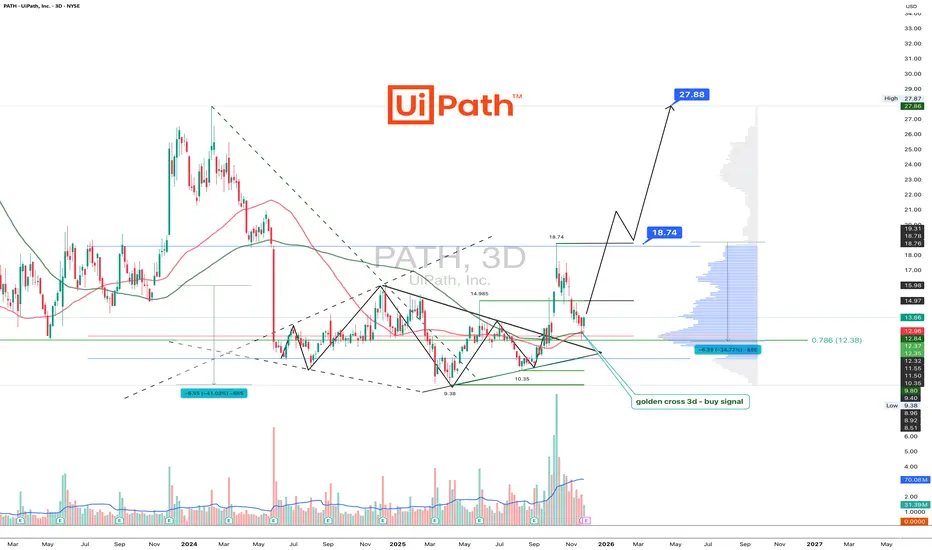
UiPath automates workflows and apparently the chart tooPATH pretends nothing happened after a perfect diamond breakout
PATH is trading at 13.86 after the diamond pattern completed a clean breakout toward 18.74 and shifted into a corrective phase. The pullback landed precisely in the Fibonacci 0.786 zone between 12.00 and 12.50 where a clear demand a
Netflix Buys Warner Bros in Historic $82.7B TakeoverNetflix’s $82.7B Warner Bros Discovery Takeover Signals a Historic Power Shift in Hollywood
Netflix (NASDAQ: NFLX) has officially struck a landmark deal to acquire the film and streaming divisions of Warner Bros. Discovery (WBD) in a transaction valued at $82.7 billion, including debt — the biggest

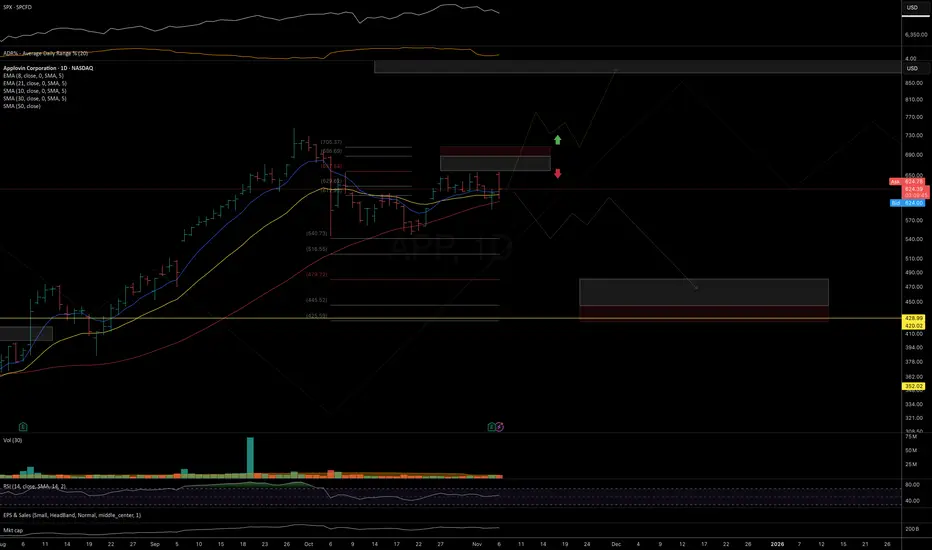
APP: at risk of deeper correctionAs long as price stays below today’s high and the 700 level, I’m watching for a deeper pullback toward 515–480 or a potential re-test of the June 2025 highs.
Alternatively, a sustained breakout above 700 would open the door for a continuation move toward the next macro resistance zone at 900–1100.
let's buy appleMy analysis is purely technical, supported by multiple factors:
1) We've been within an ascending channel for several months now, specifically since August. This gives us a sense of the market's general trend and allows us to identify potential retracement zones.
2) Subsequently, we can observe a d

Waiting for correction. and then buy in declineIdeal buy price : 570
SL : 525
Target : 990, 1308
Manage your risk.
It is at trap zone. It can rise to 708 then it may be fallen to ideal price levels 570-550.
Let's see.

See all stocks ideas
Tomorrow
YEXTYext, Inc.
Actual
—
Estimate
0.13
USD
Tomorrow
PLCEChildren's Place, Inc. (The)
Actual
—
Estimate
0.70
USD
Tomorrow
NTRBNutriband Inc.
Actual
—
Estimate
−2.13
USD
Tomorrow
HOFTHooker Furnishings Corporation
Actual
—
Estimate
−0.14
USD
Tomorrow
TBHCThe Brand House Collective, Inc
Actual
—
Estimate
−0.42
USD
Tomorrow
USAUU.S. Gold Corp.
Actual
—
Estimate
−0.13
USD
Tomorrow
FIZZNational Beverage Corp.
Actual
—
Estimate
0.51
USD
Tomorrow
BNEDBarnes & Noble Education, Inc
Actual
—
Estimate
—
See more events
Tomorrow
HWEPHW ELECTRO Co. Ltd.
Exchange
NASDAQ
Offer price
—
Dec 9
J
JMGJM Group Ltd.
Exchange
AMEX
Offer price
4.00 - 5.00
USD
Dec 10
CDNLCardinal Infrastructure Group Inc.
Exchange
NASDAQ
Offer price
20.00 - 22.00
USD
Dec 11
LMRILumexa Imaging Holdings Inc.
Exchange
NASDAQ
Offer price
17.00 - 25.00
USD
Dec 12
S
SFDXSFIDA X Inc.
Exchange
NASDAQ
Offer price
5.00 - 6.00
USD
Dec 12
W
WLTHWealthfront Corp.
Exchange
NASDAQ
Offer price
12.00 - 14.00
USD
Dec 15
DTDTDt House Ltd.
Exchange
NASDAQ
Offer price
4.00 - 5.00
USD
Dec 15
ELCGELC Group Holdings Ltd.
Exchange
NASDAQ
Offer price
4.00 - 6.00
USD
See more events
Community trends
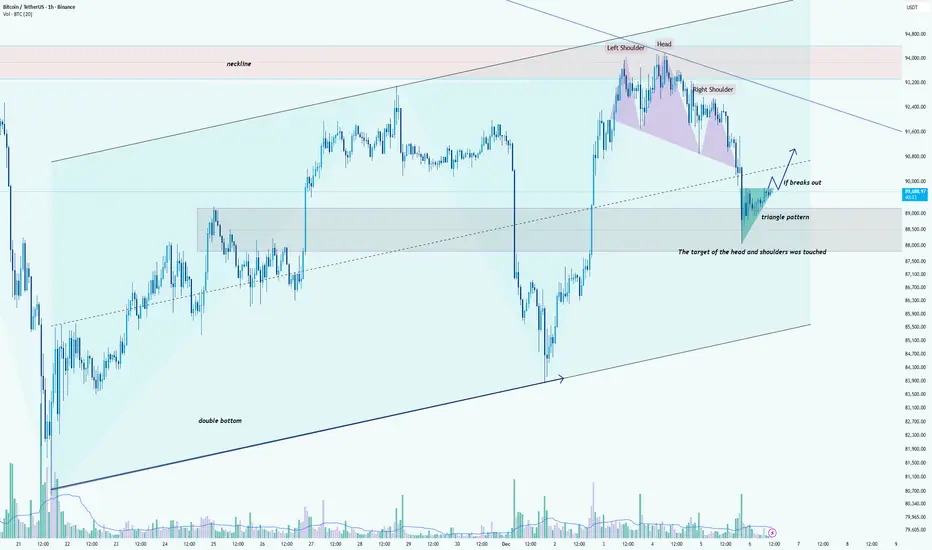
Bitcoin (BTCUSDT) – Intraday Trend & Pattern AnalysisHi!
Bitcoin continues to trade within a broader ascending structure, supported by an established rising trendline that has guided price higher over the past weeks. After forming a double bottom near the lower boundary of this channel, BTC initiated a strong rally toward the major resistance zone ar
PIPPIN/USDT — Massive Accumulation Base Breaking After 10 MonthsNovember 29, 2025
PIPPIN has spent almost the entire year trapped inside one of the most extended accumulation ranges in its chart history.
Now, for the first time since early 2025, it is breaking above the key resistance zone that capped every rally attempt.
This is the cleanest, strongest bullis

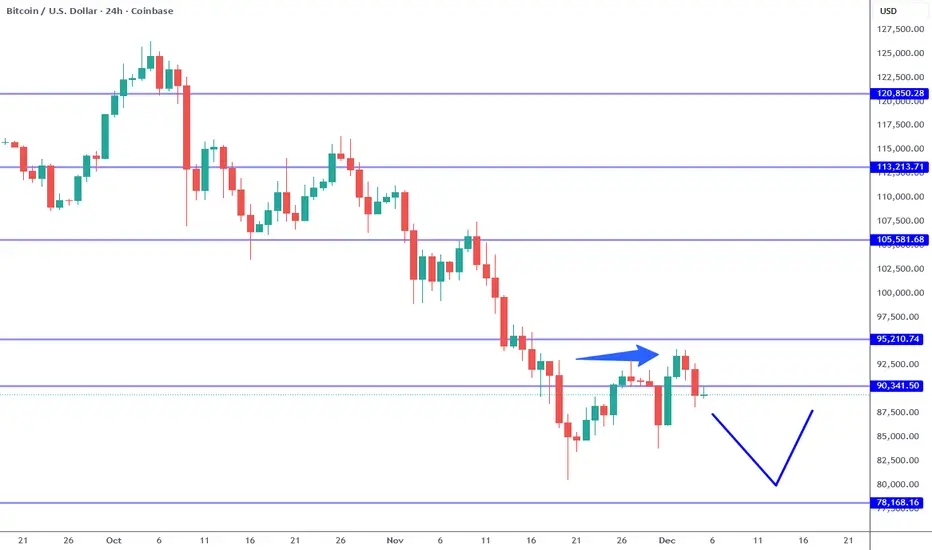
BTC USDT Next 5 price movesBTC seems poised for a downward correction. Expect few down moves over the next week or so.
Key Support levels below
S 1: 88,200
S 2: 87,000
S 3: 85,400
S 4: 83,500
S 5: 74,100
S 6: 69,100 (Market Bottom)

SOLUSDT – Gains Limited, Price Faces a Key Decision ZoneHello everyone, SOL experienced an impressive upward move over the past weekend, but the current momentum has noticeably weakened as the price hits the EMA 89 (blue), an area that has previously created strong selling pressure last month.
After bouncing around the 145 USD mark, SOL retraced to tes

BTCUSD Next Selling Move Analysis
The chart points to a Target Level (purple zone).
Below that sits a Strong Support Level (blue zone).
Short Idea (Based on the chart’s logic)
This is an interpretation — not a recommendation:
1. Weak High = Liquidity Zone
A weak high often suggests price may reverse after grabbing liquidity —

#AVAXUSDT: Targeting $60 Long Term View! Swing TradeThis crypto pair has a big potential of going back to its previous all time high, in our opinion price should reverse from $9 to $10 that area looks more appealing. We expect a swing volume to kick in the market.
Use accurate risk management while trading cryptocurrency. Like and comment for more.

Bitcoin Setting Up For New Low.Bitcoin short term trend is STILL bearish. The 95K resistance defines the structure which implies a lower low is likely to follow in the near future. There is also a failed high off the 93,500 area which suggests further weakness as well (see arrow). IF the 88K area breaks again (trend line break),
LUNC 0.000057 Holy Cow $500in Volumethis is one of the biggest token this year end
that volume and other versions are getting the best of it
interest is coming back
and strong hands and those who got a lot of this at below 0.00005
should be lucky
good luck guys and this holiday pump is surely
going to be as rewarding as before
ho

BTC Pullback: Buying 50-78.6% Discount LevelsAfter the aggressive internal liquidity grab on December 1st, which subsequently manifested as a Daily Bullish Order Block , Bitcoin continued its local bullish structure from the global 78.6% level, which I analyzed in my global overview: Bitcoin: The ATH Was a Trap. Here's the Real Roadmap.
Cu

ZECUSDT Forming Falling WedgeZECUSDT is forming a clear falling wedge pattern, a classic bullish reversal signal that often indicates an upcoming breakout. The price has been consolidating within a narrowing range, suggesting that selling pressure is weakening while buyers are beginning to regain control. With consistent volume

See all crypto ideas
Gold - The bullrun top happens now!✂️Gold ( OANDA:XAUUSD ) is heading for a major reversal:
🔎Analysis summary:
After the all time high breakout back in 2024, Gold has been rallying about +115% until today. During this entire move, Gold did not create any real correction. Considering that Gold is currently retesting a major res

GOLD MARKET UPDATEHey Everyone,
As we close out the week, price action on the 1 hour chart continues to consolidate within the defined Goldturn range between 4193 and 4233. The 4193 weighted Goldturn has held as a structural support level, generating the rebound that carried price back into 4233.
Earlier in the wee

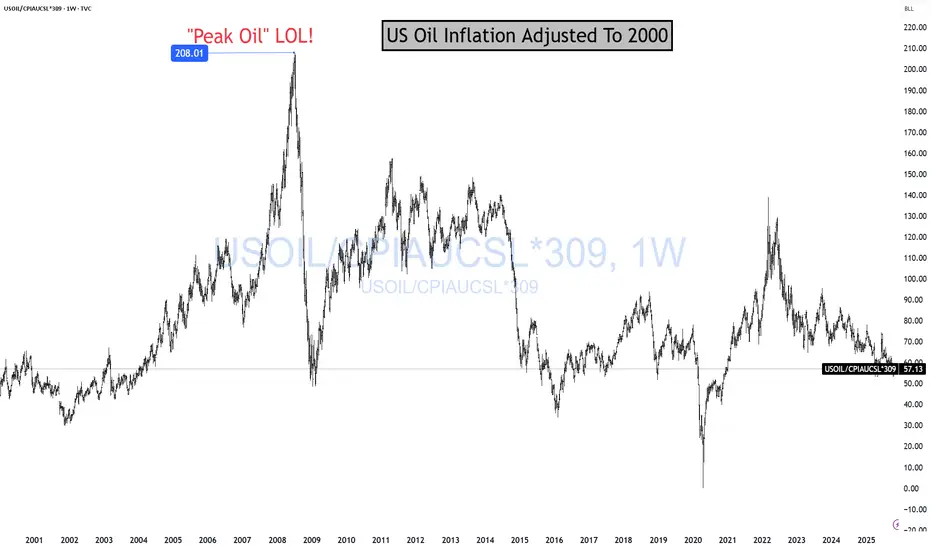
OIL Is Cheap For A ReasonOil is cheap because the global economy sucks! And it is "sucking" more and more every day. That's why Oil is on sale! Cheap! Cheap! And likely going to get more "cheap! cheap!" Me love you long time! Before I continue, story time.
In 2008, I could not convince anyone for the life of me that "PEAK
GOLD → Consolidation above 4220. Bullish structureFX:XAUUSD is trading in a narrow range around $4,200, maintaining sideways momentum ahead of US inflation data. The market confirms a bullish structure...
The probability of a Fed rate cut in December remains at ≈90%.
Mixed US employment data:
– Jobless claims fell to their lowest level since

XAUUSD Long: The 4,160 Support Holds – Path to 4,260 is OpenHello, traders! The price action for XAUUSD is currently developing within a well-defined ascending trend structure, supported by a rising major Trend Line from the lows. The market previously showed multiple rejections from the Triangle Supply Line, each marked by clear breakout attempts followed b

Brainiak | Gold forming short term Pull-Back?After price managed to break above 4240 yesterday, which had been acting as a cap for a while, it still failed to break 4264. That leaves price stuck within the 4163–4264 range, and this type of behavior is basically sideway in nature.
From a wave-theory perspective, this kind of structure is usual

XAUUSDHello Traders! 👋
What are your thoughts on GOLD?
Gold continues to trade within a short-term ascending channel and is now approaching the upper boundary of this structure. This region also aligns with a major resistance zone formed by the previous swing high, creating a strong confluence area.
As

Gold Trade ideaGold (XAUUSD) is holding above the rising trendline support. A pullback toward the support zone is expected before a bullish continuation. A breakout above 4245 resistance could open the way toward the 4275–4299 levels.

Gold 1H – Will 4242 Displace or 4170 Unlock the Next Leg?🟡 XAUUSD – Intraday Smart Money Plan | by Ryan_TitanTrader (04/12)
📈 Market Context
Gold squeezes into engineered liquidity as Donald Trump signals policy authorization for ultra-compact car production in the U.S., adding risk-on volatility to USD narratives. Markets may front-run sentiment shifts i

Selena | XAUUSD 30m –Fresh Demand Inside Channel Monday OutlookPEPPERSTONE:XAUUSD
The left-hand range zone provided accumulation before price broke out and built this bullish structure. Each major dip into the rising trendline has produced strong upside continuations. The latest move created a new swing high and then a controlled, corrective decline inside a

See all futures ideas
EURUSD – Upswing Slows at Key Resistance 1.1680Hello everyone, EURUSD is clearly slowing on the H4 chart as it touches the resistance zone 1.1670–1.1680 – overlapping with previous highs, a bearish FVG, and the upper edge of the Ichimoku cloud. Sellers reacted strongly, reflected in the H4 candle closing below the FVG, indicating weakening bull

EURUSD: Buying the Dip on Central Bank Divergence⚡ Macro Thesis: Monetary Divergence underway.
Fed (Dovish): Market convinced of a rate cut in December.
ECB (Neutral/Hawkish): Lagarde signals there is no rush to cut further given that service inflation remains sticky. This narrowing of the interest rate spread favors the euro against the dollar

USD/JPY) Bearish trend analysis Read The captionSMC Trading point update
Technical analysis of USD/JPY 1H chart and the exact trade logic behind your idea:
---
Market Structure
Overall structure is bearish:
Clear lower highs
Clear lower lows
Price is moving inside a descending channel → confirms trend continuation to the downside.

CHFJPY AnalysisCHFJPY is heading towards a demand zone on the 30min timeframe. We can expect price to bounce from there with a bullish momentum. Place your entry in the dark grey box (5min demand) for a better entry.

after GU Running the buyside liquidity i expect a massive dropafter GU Running the buyside liquidity i expect a massive drop. that is supported by the daily candle and also the FVG formed on H1 . Considering a steady run on buys i now expect it to drop massively

EUR/USD Long Position Idea (December 7th-13th)Leaving a longer stop loss for Wednesday news. This is on H1 time frame so will be very noisy but EURO still outperforming dollar especially with US FED turning more dovish Initiating Quantitative Easing and dropping tightening (likely).

EUR/USD Trading Strategy for Next Week1. Guidance from U.S.-EU Bond Market Spread
The spread between the 10-year U.S. Treasury bond and German Treasury bond has been continuously narrowing to 120 basis points, a notable drop from 150 basis points recorded in October. Since the Federal Reserve halted its balance sheet reduction on Decemb

EUR/USD: Important Bullish Breakout The EURUSD pair has successfully violated and closed above a significant resistance level, which was established by a prior higher high.
This confirmed break of structure suggests a strong likelihood of continued bullish movement.
The subsequent resistance level is observed at the 1.1700 psycholog

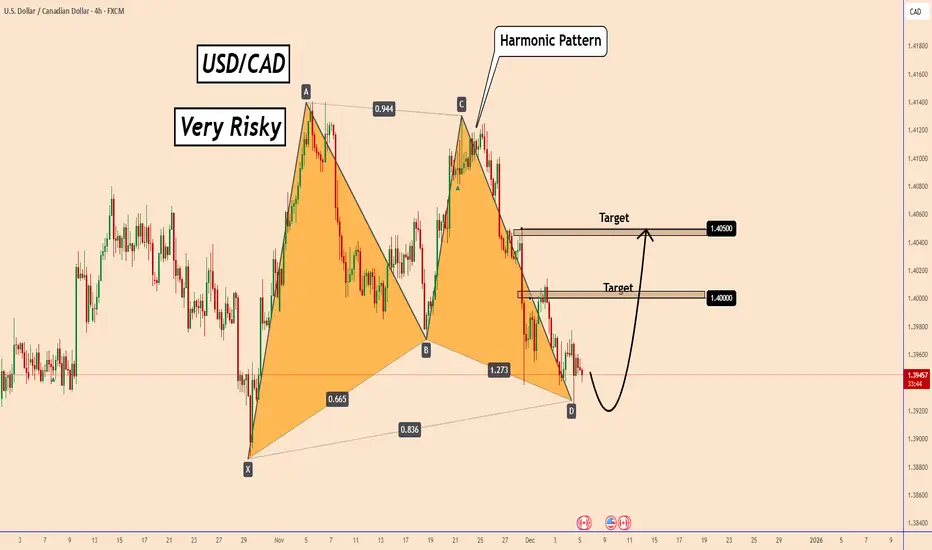
USDCAD: FED Cut Speculation Keeps Pair on a TightropeUSDCAD: FED Cut Speculation Keeps Pair on a Tightrope
In the current environment, where the market expects the FED to cut rates next week by 25 to 50 basis points, trading USDCAD comes with a very high level of risk.
The market today will also speculate on the US PCE data and its potential impact
Elite | USD/JPY – Neutral Structure | Breakdown or FakedownFX:USDJPY
Price is currently ranging between rejection supply and lower support. We have BOS confirmations both ways, which keeps structure neutral. A decision will come only when market confirms either direction.
🔹If Buyers Take Control
• Break + retest above 156.00–156.450 supply activates bul

See all forex ideas
| - | - | - | - | - | - | - | ||
| - | - | - | - | - | - | - | ||
| - | - | - | - | - | - | - | ||
| - | - | - | - | - | - | - | ||
| - | - | - | - | - | - | - | ||
| - | - | - | - | - | - | - | ||
| - | - | - | - | - | - | - | ||
| - | - | - | - | - | - | - |
Trade directly on the supercharts through our supported, fully-verified and user-reviewed brokers.


