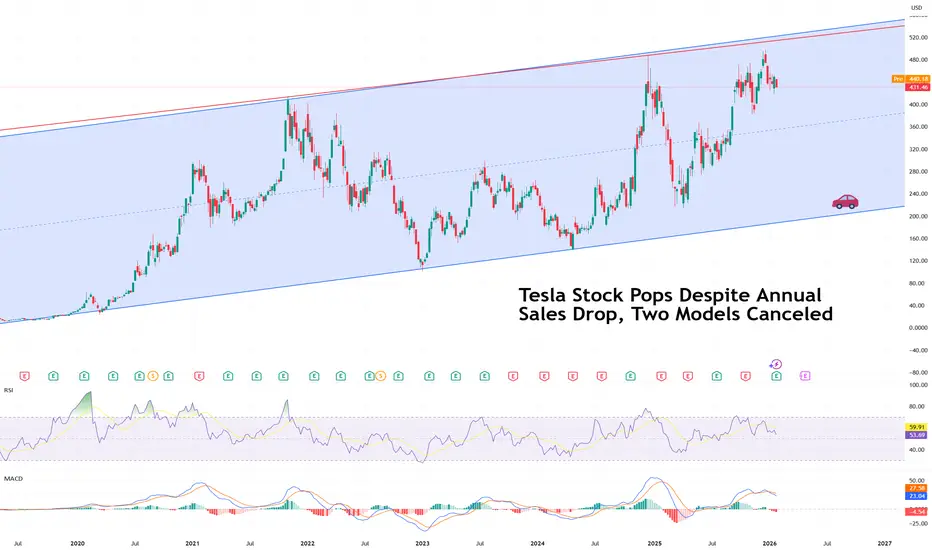
Tesla Stock Pops Despite Annual Sales Drop, Two Models CanceledTesla stock NASDAQ:TSLA managed a modest pop pre-market Thursday, rising about 3%, even as the company delivered a quarter that, on the surface, looked anything but celebratory.
Profits slid. Revenue dipped. Vehicle sales declined. Two iconic models were sent quietly into retirement. And yet, the

The best trades require research, then commitment.
Get started for free$0 forever, no credit card needed

Scott "Kidd" PoteetPolaris Dawn astronaut

Where the world does markets
Join 100 million traders and investors taking the future into their own hands.
EURUSDHello Traders! 👋
What are your thoughts on EURUSD?
EUR/USD has successfully broken above the descending trendline as well as a key resistance zone, confirming a bullish breakout on the daily timeframe.
At current levels, price is approaching a resistance area. Therefore, a short-term correction

Hellena | GOLD (4H): LONG to resistance 5200.Since the movement continues and clearly shows no signs of reversing, I had to slightly revise the wave count, and it looks as if the impulse has been extended.
This means that the higher-order wave “3” has just ended or will end soon.
This means that wave “5” is not over yet and we should expect a

Silver’s Generational Super Cycle: 31 Years of Waiting, 15 YearsWelcome to a special macro edition of the Mubite market analysis.
Today, we are zooming out to the 12-Month (Yearly) timeframe on Silver (XAG/USD).
In trading, patience is not just a virtue; it is a requirement for generational wealth. The chart we are looking at today tells a story of massive cyc

Silver at $110 in Fierce Rally, Gold Tops $5,100. What’s Behind?(What a chart.)
Silver OANDA:XAGUSD is on a tear. Actually, scratch that — silver is on a mission. Prices have surged more than 250% over the past year, including a blistering 50% jump in January alone, lifting the metal to around $109 an ounce and placing the $110 level firmly in sight .
That

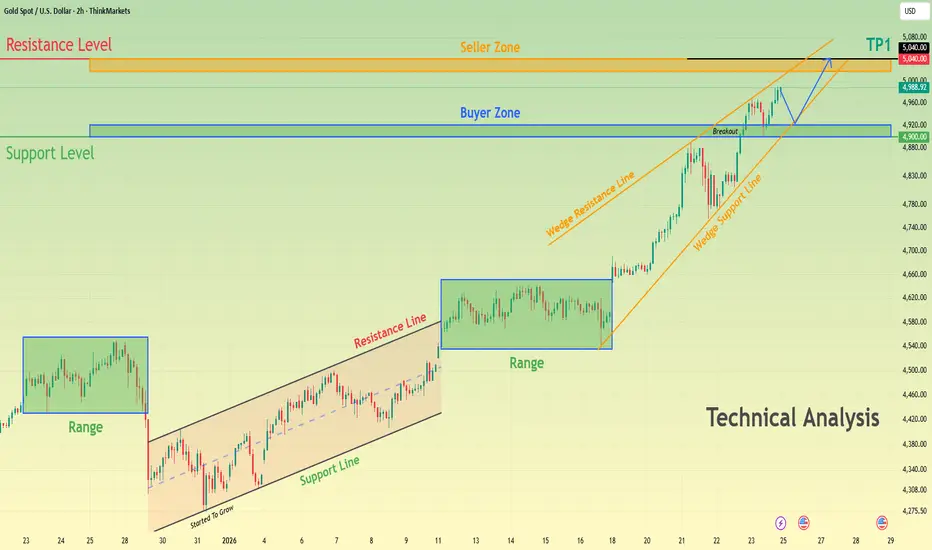
XAUUSD Bullish Structure Intact - $5,040 AheadHello traders! Here’s my technical outlook on XAUUSD (2H) based on the current chart structure. Gold continues to trade within a broader bullish context, maintaining a sequence of higher highs and higher lows. Earlier in the move, price spent a significant amount of time consolidating inside multipl
Again C3.AI - 90 % potential profit - TARGET 24 USDOn the daily chart, the stock remains in a long-term downtrend; however, downward momentum has clearly weakened in recent weeks. Price has stabilized around the 12–13 USD area, which previously acted as a demand zone. This price behavior suggests a possible accumulation phase following a prolonged d

Only God or Nuclear War Can Break This Weekly Gold ResistanceA Resistance That Has Stopped Gold for 20 Years
On the weekly chart, gold has respected the same rising resistance line through every major global crisis:
May 2006 – ~$723
September 2011 – ~$1,900
Now / early 2026 projection – ~$5,000–$5,200
Each time price reached this zone, the world was u

UJ, Yen takes over, Weekly Overview and Upcoming week PlanThe week:
Exiting week for the pair, first signs of weakness in the trend confirmed both by the pattern and level where it happen. A text book evening star at the same level where the found resistance and reversed on the week of 13 January last year, so know we have 3 confirmations: Time, Pattern

BTC Is Not Weak — It’s Just Quiet Before the Next Big WaveIf I look at BTCUSDT right now through the lens of someone who has lived through multiple market cycles, what I see is a market that is calm rather than weak.
Recent news hasn’t delivered a major catalyst, and that is actually a positive sign. There is no new macro pressure, no unexpected bad ne

See all editors' picks ideas
Hyperfork Matrix🔱 Hyperfork Matrix 🔱 A manual Andrews Pitchfork tool with action/reaction propagation lines and lattice matrix functionality. This indicator extends Dr. Alan Andrews' and Patrick Mikula's median line methodology by automating the projection of reaction and action lines at equidistant intervals, cr

Arbitrage Matrix [LuxAlgo]The Arbitrage Matrix is a follow-up to our Arbitrage Detector that compares the spreads in price and volume between all the major crypto exchanges and forex brokers for any given asset.
It provides traders with a comprehensive view of the entire marketplace, revealing hidden relationships among d

Wyckoff Schematic by Kingshuk GhoshThe "Wyckoff Schematic" is a Pine Script indicator that automatically detects and visualizes Wyckoff Method accumulation and distribution patterns in real-time. This professional tool helps traders identify smart money movements, phase transitions, and critical market structure points.
Key Features

Volume Cluster Profile [VCP] (Zeiierman)█ Overview
Volume Cluster Profile (Zeiierman) is a volume profile tool that builds cluster-enhanced volume-by-price maps for both the current market window and prior swing segments.
Instead of treating the profile as a raw histogram only, VCP detects the dominant volume peaks (clusters) insid

DeeptestDeeptest: Quantitative Backtesting Library for Pine Script
━━━━━━━━━━━━━━━━━━━━━━━━━━━━━━━━━━
█ OVERVIEW
Deeptest is a Pine Script library that provides quantitative analysis tools for strategy backtesting. It calculates over 100 statistical metrics including risk-adjusted return ratios (Sharpe

Arbitrage Detector [LuxAlgo]The Arbitrage Detector unveils hidden spreads in the crypto and forex markets. It compares the same asset on the main crypto exchanges and forex brokers and displays both prices and volumes on a dashboard, as well as the maximum spread detected on a histogram divided by four user-selected percenti

Multi-Distribution Volume Profile (Zeiierman)█ Overview
Multi-Distribution Volume Profile (Zeiierman) is a flexible, structure-first volume profile tool that lets you reshape how volume is distributed across price, from classic uniform profiles to advanced statistical curves like Gaussian, Lognormal, Student-t, and more.
Instead of forcin

Multi-Ticker Anchored CandlesMulti-Ticker Anchored Candles (MTAC) is a simple tool for overlaying up to 3 tickers onto the same chart. This is achieved by interpreting each symbol's OHLC data as percentages, then plotting their candle points relative to the main chart's open. This allows for a simple comparison of tickers to tr

Vdubus Divergence Wave Pattern Generator V1The Vdubus Divergence Wave Theory
10 years in the making & now finally thanks to AI I have attempted to put my Trading strategy & logic into a visual representation of how I analyse and project market using Core price action & MacD. Enjoy :)
A Proprietary Structural & Momentum Confluence System

Per Bak Self-Organized CriticalityTL;DR: This indicator measures market fragility. It measures the system's vulnerability to cascade failures and phase transitions. I've added four independent stress vectors: tail risk, volatility regime, credit stress, and positioning extremes. This allows us to quantify how susceptible markets are

See all indicators and strategies
Community trends
$SNDK — rarely have I seen analysts this wrong going into earninNASDAQ:SNDK — rarely have I seen analysts this wrong going into earnings.
Personally, I wouldn’t sleep well holding trends as stretched as Scandisk, so I’ve stuck to day trading only and already taken profits. I do share how I manage these trades, but that’s kept members-only, as full transparency

ALAB Daily: Rising Trendline Under PressurePrice is slipping after testing the rising trendline. Failure to reclaim and hold above it would signal a breakdown of the bullish structure and increase the risk of a deeper pullback.

Opendoor Technologies Inc (OPEN)Opendoor Technologies Inc keen interest to buy at 5.90 with a tight SL at 5.60 with upside potential 15+

Palantir - The short signal from the PitchforkPalantir is great for trading with the Alan Andrews Pitchfork.
Palantir follows the Pitchfork rulebook very accurately. This builds confidence, helps me stick to my trading plan, and ultimately leads to solid profits.
This time, Palantir gave me a new signal to the short side. Since I like to play

HUBS reversal soon?HubSpot is a dominant leader in the midmarket CRM and automation space, leveraging a "freemium" model that effectively converts free users into paid tiers, with approximately 60% of customers now utilizing multiple hubs. The company’s narrow economic moat is underpinned by high switching costs and a

Microsoft (NASDAQ: $MSFT) Sheds ~$360 Billion in Market ValueMicrosoft (NASDAQ: NASDAQ:MSFT ) took a shocking tumble this week after reporting its second-quarter earnings for fiscal 2026, wiping out roughly $360 billion in market value in a single session as shares plunged about 10–12% amid heavy selling. This huge decline not only hit Microsoft’s valuation

160-250% returns with Resources Connection, Inc - January 2026Business consulting is back.
On the above 2 week chart price action has collapsed 80% since July 2022. That can only mean one thing, it’s time to sell. Yes. Everyone is saying it a market crash is imminent, time to get out and buy Gold. (Massive sarcasm).
Welcome to the world of a contrarian. Whi

ONDS swing trade ideaNASDAQ:ONDS
The wave 4 pullback seems to be almost done!
Several confluences:
Weekly 10 SMA @ 10.28 (blue staggering line)
50 daily SMA @ 10.04
Respecting the lower TL since Nov 25 lows.
50% fib retracement level!
Finishing a cup and handle (bull flag) pattern!
Good place to bounce from!
I

BULL Weekly Alert: Extreme Oversold Setups SignalQS V4 ELITE: BULL – Weekly
Trend: Neutral / Mean Reversion
Conviction: Moderate
Time Horizon: Weekly (Expiry: Jan 30, 2026)
Alpha Score: 68
Core Thesis:
BULL is extremely oversold (RSI 13.7) at major support ($6.96). Katy AI’s bullish vector suggests a high-probability relief rally toward the wee

A High-Stakes,Long-Term Bet on the Urban Air Mobility RevolutionSynthesized Investment Thesis for Archer Aviation (ACHR): A High-Stakes, Long-Term Bet on the Urban Air Mobility Revolution
Archer Aviation represents one of the purest forms of a long-duration, pre-revenue growth investment. The stock embodies the tension between visionary potential and present-day

See all stocks ideas
Tomorrow
IDXXIDEXX Laboratories, Inc.
Actual
—
Estimate
2.93
USD
Tomorrow
APTVAptiv PLC
Actual
—
Estimate
1.85
USD
Tomorrow
CCECCapital Clean Energy Carriers Corp.
Actual
—
Estimate
0.47
USD
Tomorrow
BSRRSierra Bancorp
Actual
—
Estimate
0.87
USD
Tomorrow
XIFRXPLR Infrastructure, LP
Actual
—
Estimate
−0.18
USD
Tomorrow
BEPCBrookfield Renewable Corporation
Actual
—
Estimate
−0.07
USD
Tomorrow
PAMTPAMT CORP
Actual
—
Estimate
−0.20
USD
Tomorrow
CLBKColumbia Financial, Inc.
Actual
—
Estimate
0.15
USD
See more events
Tomorrow
P
PLYXPolaryx Therapeutics Inc.
Exchange
NASDAQ
Offer price
—
Tomorrow
HWEPHW ELECTRO Co. Ltd.
Exchange
NASDAQ
Offer price
—
Feb 3
J
JAGUJaguar Uranium Corp.
Exchange
AMEX
Offer price
4.00 - 6.00
USD
Feb 4
M
MANEVeradermics Inc.
Exchange
NYSE
Offer price
14.00 - 16.00
USD
Feb 5
F
FPSForgent Power Solutions Inc.
Exchange
NYSE
Offer price
25.00 - 29.00
USD
Feb 5
B
BOBSBob’s Discount Furniture Inc.
Exchange
NYSE
Offer price
17.00 - 19.00
USD
Feb 6
L
LFTOLiftoff Mobile Inc.
Exchange
NASDAQ
Offer price
26.00 - 30.00
USD
Feb 6
OFRMOnce Upon A Farm PBC
Exchange
NYSE
Offer price
17.00 - 19.00
USD
See more events
Community trends
Which Tokens Should I Analyze Next? (You Decide!)Hey Traders!
Hope you're all enjoying an amazing weekend!
Want me to analyze your favorite token next?
Just drop your request below using this format
Request Format:
Project Name: Bitcoin
Token Symbol: BTC( BINANCE:BTCUSDT )
Important Rules:
I’ll analyze only the first 10 requests.
One requ

Bitcoin - Must see, bear flag target 42k in 2026!Bitcoin is forming a huge bearish flag on the daily/weekly chart! This is an extremely good pattern for all bears around, but for the bulls, it's indeed not that good because the classic profit target of this pattern is 42k (by classical technical analysis of a bear flag pattern). How to measure the

Bitcoin - Outlook for the Upcoming WeeksMarket Overview
Bitcoin is currently trading under clear higher timeframe pressure after a strong reaction from a premium zone. Price tapped into a confluence area of weekly and monthly Fair Value Gaps and showed immediate rejection, confirming that sellers are active at these levels. This reaction

SONIC (FTM) - TA For Potential Dip BuyFantom (Migrated To "Sonic") just hit a long term support from all the way back in 2020 before previous crypto bull market.
So it is already very deep here.
Of course deep can go deeper but its already wiped out 2 cycles worth of bullish action and now already touching into the pre-bull accumulati

Elise | BTCUSD – 30M – Post-Impulsive Drop ConsolidationBITSTAMP:BTCUSD
The sharp sell-off suggests institutional distribution followed by short-term stabilization. Current price action shows range-bound behavior after liquidity was taken on the downside. This consolidation may act as a base for either a corrective pullback into supply or continuation

SOL/USDT | Slowly going back up (READ THE CAPTION)By examining the daily chart of SOLUSDT we can see that after dropping as low as 112.14 and touching the high of the Bullish OB, it bounced back up and its currently being at 116.00.
Considering that Solana has swept the liquidity pool, I expect it to slowly move higher.
Targets for Solana: 116.50,

BTCUSDTHello Traders! 👋
What are your thoughts on BITCOIN?
Following its recent sell-off, Bitcoin entered a corrective phase and managed to rally up to the $98,000 area, where it faced strong selling pressure and got rejected. After this rejection, price broke below its ascending trendline and is now tra

Hedera (HBAR): Looks Like Bear Market For That One | -50%HBAR is not looking good. After breaking the bounce zone, sellers secured it with a proper re-test, and now price has also broken the local lows. This looks like a potential break of structure, assuming sellers manage to hold this breakdown.
If that happens, this would be the confirmation we need,

BITCOIN Rebuy Zone (1D)Honestly, the major and most critical support levels have already been lost, which significantly changes the overall market structure. Given the current price behavior, the pressure from sellers, the decline in momentum, and the way recent candles are forming, it appears that the ongoing bearish wav

BITCOIN - WHERE TO?? $81k or $85kGive this idea a thumbs up if you agree 👍
Here is a 30min timeframe analysis. Price is at the verge of breaking to the upside so we can either see a break to the upside and price gets bullish or a dump to $81k and the downtrend continues.
What do you think? 🤔

See all crypto ideas
Gold (XAUUSD): a trend conversion happenedHi!
Gold has shifted into a short-term bearish phase after losing key technical support. The market broke the ascending trendline, signaling trend exhaustion, followed by a bearish engulfing reaction near resistance that confirmed selling pressure.
Price has now broken below the marked structure l

Gold Pulls Back DeeplyHello everyone, Domic here
On the H4 timeframe, what stands out is not the recent drop itself, but the distance gold had traveled beforehand. The steep rally pushed price far away from EMA 34 and EMA 89 within a short period, and the current decline is essentially bringing the market back toward i

GOLD(XAUUSD): +8000 Pips Possible Swing Buy, Is This Possible?Dear Traders,
The market has been extremely volatile recently, fuelled by widespread uncertainty. Trading in these conditions is extremely dangerous and could easily wipe out your accounts. However, we see an excellent opportunity. The price could drop around $4740, which would be a critical leve

XAUUSD: Smart Money Is Offloading While Retail Keeps BuyingOn XAUUSD, we still observe a bullish market structure, but price is clearly in an extended condition after the vertical impulse that pushed quotations toward the 5,150 area. The rejection candle formed after the high signals selling pressure and a potential start of a corrective phase toward the fi

High Volatility After Sharp SellOff, Market in Rebalancing PhaseMarket Context
Gold has just experienced a sharp and aggressive sell-off on H1, breaking the short-term bullish structure after an extended impulsive rally. This type of move typically reflects liquidity distribution and capital rebalancing, common during periods of heightened macro-driven volatili

XAUUSD 1H chart pattern market is making lower lows and lower highs it is strong down trend
entry at 5003
target should be 4720
trade active active

Elise | XAUUSD – 30M – Strong Bearish ContinuationOANDA:XAUUSD
After rejecting from the premium supply zone, sellers took full control, driving price aggressively lower. Momentum remains bearish with no strong bullish absorption so far. The current structure favors continuation toward deeper liquidity resting below.
Key Scenarios
❌ Bearish Case 📉

XAUUSD Long: Defends Trend Support, Targeting $5,190 SupplyHello traders! Here’s a clear technical breakdown of XAUUSD (2H) based on the current chart structure. Gold remains in a broader bullish environment after a strong impulsive move that developed from a well-defined accumulation range. Following this consolidation phase, price broke to the upside and

XAUUSD (Gold) – 1H Support Reaction After Sharp SelloffAfter a strong rejection from the higher resistance area, price made a sharp bearish correction into a major support zone. Current reaction suggests a possible relief bounce, but structure remains corrective unless resistance is reclaimed.
Major Support: 4760 – 4800
Recovery Resistance: 5050 – 5

Gold Crashes 10% from ATH – Major Buying Opportunity?In the past 24 hours, Gold( OANDA:XAUUSD ) prices experienced a sharp decline, dropping from record highs above $5,600 per ounce to around $4,970, representing a 10-11% correction. This pullback follows a strong rally driven by geopolitical tensions and economic uncertainties. While the drop may see

See all futures ideas
EUR/USD – H1 - Fundamental Pressure Takes Control 📝 Description🔍 Setup (Fundamental + Technical) FX:EURUSD
EUR/USD has lost bullish structure after breaking below the rising trendline and confirming a bearish retest. Price is also trading below the Ichimoku cloud, with a bearish cloud crossover, signaling trend weakness.
📉 Fundamental catalys

AUD/USD – H1 - Head & Shoulders BreakdownAUD/USD has printed a clean Head & Shoulders pattern on the H1 timeframe , signaling a potential trend reversal after a strong bullish run. Price has now broken below the neckline, confirming bearish momentum and opening the door for a deeper correction. OANDA:AUDUSD
🔍 Technical Analysis
🧠 Cla

AUDNZD: One Hour Timeframe, Possible Intraday Buying Setup! Dear traders,
The AUDNZD dropped in the hourly timeframe today following a heavy sell-off in metals like gold and silver. However, we anticipate a bullish trend for AUDNZD to begin next week as the market settles down. Please manage your risk accurately while trading in these current conditions.

USDJPY: Signals Deeper Correction RiskUSDJPY: Signals Deeper Correction Risk
USD/JPY has broken down from a rising channel on the daily chart, signaling that bullish momentum is weakening and a broader correction may already be underway.
Price is now trading below key daily support, and the recent rebound on the 60-minute chart appea

USDCAD Eyes Breakout | New Fed Chair Boosts USD BiasHey Traders,
In the coming week, we are closely monitoring USDCAD for a potential buying opportunity around the 1.36100 zone. While USDCAD has been trading in a broader downtrend, recent US Dollar strength suggests the pair may be attempting a bullish breakout from that structure.
From a fundament

EURUSD Bearish Continuation ConfirmationQuick Summary
EURUSD is expected to continue its bearish move and The downside target is 1.16672, Price is aiming to fill the H4 liquidity void
A confirmed break below 1.18329 will validate further selling
Sell entries should only be taken after this level is clearly broken
Full Analysis
After th

GBPUSD Price Update – Clean & Clear ExplanationGBP/USD is currently trading within a broader bullish structure, but recent price action shows signs of short-term bearish pressure after rejection from a key resistance zone.
A Price previously respected an ascending channel, making higher highs and higher lows. However, the latest impulsive beari

AUD/USD | Testing the IFVG (READ THE CAPTION)As you can see in the hourly chart of AUDUSD, it is currently going towards the IFVG, and I expect a drop in price from AUDUSD once it reaches there.
Afterwards, I would like to see it go down and sweep the sellside liquidity and then make another upwards move.
Current bullish targets: 0.70350, 0.7

EURUSD: Rally Stalls at Resistance - Correction To 1.1860Hello everyone, here is my breakdown of the current EURUSD setup.
Market Analysis
EURUSD has recently transitioned from a prolonged consolidation into a strong impulsive bullish move. After respecting a rising trend line and repeatedly breaking above the descending triangle resistance, price show

GBPJPY - Bearish Continuation with DiNapoli OP TargetsGBPJPY is currently developing a bearish continuation structure, with price consolidating below prior support. The technical picture remains aligned with the downside, and the current formation favors further weakness.
From a technical perspective, the setup is supported by a bearish flag formation

See all forex ideas
| - | - | - | - | - | - | - | ||
| - | - | - | - | - | - | - | ||
| - | - | - | - | - | - | - | ||
| - | - | - | - | - | - | - | ||
| - | - | - | - | - | - | - | ||
| - | - | - | - | - | - | - | ||
| - | - | - | - | - | - | - | ||
| - | - | - | - | - | - | - |
Trade directly on Supercharts through our supported, fully-verified, and user-reviewed brokers.


