NVDA - Techs Fail and Insiders BailThis chart looks ugly for the bulls. That red trendline has been holding the price up for months, but now it is finally giving way. When a major support level like this cracks, it usually means the uptrend is over and we are heading lower.
But the real red flag is what the leadership is doing.
Ins

The best trades require research, then commitment.
Get started for free$0 forever, no credit card needed

Scott "Kidd" PoteetPolaris Dawn astronaut

Where the world does markets
Join 100 million traders and investors taking the future into their own hands.

Nvidia May Be RangeboundNvidia has gone nowhere since October, and some traders may think the AI giant is rangebound.
The first pattern on today’s chart is the December 26 high of $192.69. NVDA probed that level in late January and again this month without breaking out. That may suggest that resistance is in place.
Secon

Nasdaq Crash Incoming: Wave 3 of 3 DownOver in this video, I go through the 5th wave up and identify 2 key things for this top:
1. Wave 5 = Wave 3, since wave 1 is the longest, wave 3 cannot be the shortest wave.
2. 2 Spinning tops marks the peak on 29th and 30th Oct 2025.
The first wave down is a "leading diagonal" because wave 4 overl

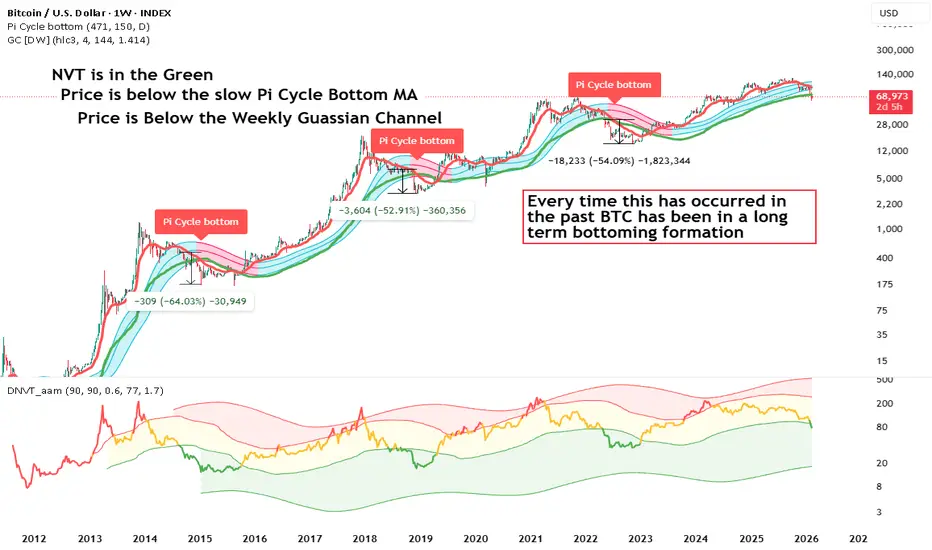
Bitcoin flashing traditional accumulation signals (alt season?)TL:DR
Bitcoin is finding a bottom but probably still has some downside. Strong hand are probably accumulating Bitcoin and especially alts.
Introduction
Bitcoin is flashing multiple accumulation signals. But this downtrend has been so gradual and lacking in volatility it barely feels like a bea
Bitcoin: Is the WXYXZ Correction Setting Up Wave C?Bitcoin: Is the WXYXZ Correction Setting Up Wave C?
During the last 5 days BTC declined by nearly 5% from 72250 to 65170
Looks like the B wave has more a corrective movement and is expanding as WXYXZ pattern. If the price manages to move above the previous X near 68300 it will add the chances t

Microsoft: a major technical support at $350–$400Should Microsoft stock once again be considered in a DCA zone, after having corrected on the stock market since last November and now being the most expensive (in valuation terms) among the Magnificent 7 stocks?
This is the question I will address in this new analysis on TradingView. Feel free to f

Job Growth Takes Off but Traders Stay Put. What’s Happening?Are these jobs in the room with us right now?
📊 A Blockbuster Headline
The delayed January jobs report arrived Wednesday. Nonfarm payrolls ECONOMICS:USNFP showed 130,000 new hires , more than double the 55,000 estimate. On paper, that looked like a strong start to the year.
Wall Street’s re

$TAO Sitting on a Level That Has Never FailedGETTEX:TAO is sitting on a major long-term support level and this isn’t the first time.
If we look at the last three times we touched this support, we bounced strongly.
We may see some drop to form a wick below the support, just as we’ve seen in the last three instances. However, in each case, we

BTC: The "Invisible Wall" at $70k (Why We Flush to $59.8k)The retail narrative is that Bitcoin is "consolidating" at $70k. The On-Chain data says Bitcoin is DISTRIBUTING . We just hit an "Invisible Sell Wall" driven by three massive structural failures. This is not a dip to buy; it is a Rational Deleveraging triggered by a $6.3B supply shock that the ma

Silver Under Pressure – Sellers Are in ControlXAGUSD is currently clearly leaning toward a short-term BEARISH trend, as both recent news and the technical structure fail to support a sustainable bullish move.
From a news perspective , silver is facing pressure from profit-taking after the previous strong rebound , while the U.S. dollar and

See all editors' picks ideas
Peak Trading Activity Graphs [LuxAlgo]The Peak Trading Activity Graphs displays four graphs that allow traders to see at a glance the times of the highest and lowest volume and volatility for any month, day of the month, day of the week, or hour of the day. By default, it plots the median values of the selected data for each period. T
Pine Script® indicator

Smart Trader, Episode 03, by Ata Sabanci, Candles and TradelinesA volume-based multi-block analysis system designed for educational purposes. This indicator helps traders understand their current market situation through aggregated block analysis, volumetric calculations, trend detection, and an AI-style narrative engine.
━━━━━━━━━━━━━━━━━━━━━━━━━━━━━━━━━━━━━━━
Pine Script® indicator

Asset Drift ModelThis Asset Drift Model is a statistical tool designed to detect whether an asset exhibits a systematic directional tendency in its historical returns. Unlike traditional momentum indicators that react to price movements, this indicator performs a formal hypothesis test to determine if the observed d
Pine Script® indicator

Hyperfork Matrix🔱 Hyperfork Matrix 🔱 A manual Andrews Pitchfork tool with action/reaction propagation lines and lattice matrix functionality. This indicator extends Dr. Alan Andrews' and Patrick Mikula's median line methodology by automating the projection of reaction and action lines at equidistant intervals, cr
Pine Script® indicator

Arbitrage Matrix [LuxAlgo]The Arbitrage Matrix is a follow-up to our Arbitrage Detector that compares the spreads in price and volume between all the major crypto exchanges and forex brokers for any given asset.
It provides traders with a comprehensive view of the entire marketplace, revealing hidden relationships among d
Pine Script® indicator

Wyckoff Schematic by Kingshuk GhoshThe "Wyckoff Schematic" is a Pine Script indicator that automatically detects and visualizes Wyckoff Method accumulation and distribution patterns in real-time. This professional tool helps traders identify smart money movements, phase transitions, and critical market structure points.
Key Features
Pine Script® indicator

Volume Cluster Profile [VCP] (Zeiierman)█ Overview
Volume Cluster Profile (Zeiierman) is a volume profile tool that builds cluster-enhanced volume-by-price maps for both the current market window and prior swing segments.
Instead of treating the profile as a raw histogram only, VCP detects the dominant volume peaks (clusters) insid
Pine Script® indicator

DeeptestDeeptest: Quantitative Backtesting Library for Pine Script
━━━━━━━━━━━━━━━━━━━━━━━━━━━━━━━━━━
█ OVERVIEW
Deeptest is a Pine Script library that provides quantitative analysis tools for strategy backtesting. It calculates over 100 statistical metrics including risk-adjusted return ratios (Sharpe
Pine Script® library

Arbitrage Detector [LuxAlgo]The Arbitrage Detector unveils hidden spreads in the crypto and forex markets. It compares the same asset on the main crypto exchanges and forex brokers and displays both prices and volumes on a dashboard, as well as the maximum spread detected on a histogram divided by four user-selected percenti
Pine Script® indicator

Multi-Distribution Volume Profile (Zeiierman)█ Overview
Multi-Distribution Volume Profile (Zeiierman) is a flexible, structure-first volume profile tool that lets you reshape how volume is distributed across price, from classic uniform profiles to advanced statistical curves like Gaussian, Lognormal, Student-t, and more.
Instead of forcin
Pine Script® indicator

See all indicators and strategies
Community trends
$RIME Technical AnalysisNASDAQ:RIME had a huge run on heavy volume in the last 2 hours of trading on Friday, Feb 13, 2026.
In order to maintain its uptrend look for price to maintain above 2.50 area for a test of highs and possible further breakout to the upside.
Rumors about buyouts as well as fund raising fuel senti
$AG - Monthly structure testing a multi-year decision area First Majestic Silver - Long-term resistance after years of compression.
Watching acceptance above 22-24$
Rejection keeps this in a range.
Ideally, tightening consolidation below resistance would support continuation.
Earnings next week 👀

GOOGL Stock Analysis | Pullback Within an Established Uptrend🎯 GOOGL: The Great Heist Setup | Moving Average Pullback Play 💰
📊 Market Intelligence Brief
Asset: GOOGL (Alphabet Inc.) - NASDAQ
Strategy Type: Day/Swing Trade - Bullish Momentum
Risk Profile: Medium | Reward Potential: High 🚀
🔍 THE MASTER PLAN
We're eyeing a classic moving average pullback scenar

TSLA: DoubleTop Confirmed–BWave Ends 436, CWave target 395-380TSLA from 498 high unfolded a major A-B-C correction.
Primary Count:
- Wave A completed at 387.55. Wave B rallied to 436.35 forming a double top (Feb 11-12).
- Feb 13 CPI day closed with a spinning top, confirming B wave end.
- C wave started from 436, Wave C1 underway.
-- Short-term Wave C1

Apple viewMy stance on apple stock with its current reject off the monthly timeframe, this trade when tagged in should be completed in a max due to liquidity that is already taken out
Palantir is Starting the Fear PhasePalantir is Starting the Fear Phase
Wall Street has seen several popular stocks lately.
NASDAQ:NVDA is the clear leader but we've recently seen a Head and Shoulders pattern unconfirmed, but there is a high risk to break it!
We cannot forget Palantir as another leader. The market believes t

NVDA (USA) - NVIDIA "Stuck" Looking for a Direction.I was inspired to post this after seeing a similar idea posted by @Bull-Investor here:
I often think that area / line charts are underutilised. I like how they cut out a lot of the short term noise candlesticks add to the charts so thought I'd post my own after seeing what very much looks like a

TSLA Compression Near 410–420: Breakout orBreakdown? Feb 16–20TSLA is heading into this week trading inside a tightening range on the 1H timeframe, following a broader pullback from the 440s. Structure is no longer impulsively bullish, but it has not fully transitioned into a clean bearish trend either. Price is compressing between 410 support and the 420–424

Nvidia already bearish —Money will flow to the altcoins marketNvidia peaked October 2025. It is already bearish based on many chart signals. It seems a major correction cannot be avoided at this point, it has been in the making for months.
A drop is being consolidated after NVDA failed to move higher late last year. Last week closed red and the week before. T

Rare opportunity to buy MSFT for short and long term BIG opportunity to buy MSFT
recent fears in AI and software sector prompted a 30% correction
MSFT now trades just above long term VWAP and fibo support
weekly and daily RSI levels also suggest a big buy the dip opportunity
Aside from CapEx concerns, Microsoft has strong fundamentels and will re

See all stocks ideas
Today
RNWReNew Energy Global plc
Actual
0.00
USD
Estimate
−0.11
USD
Today
CMBMCambium Networks Corporation
Actual
—
Estimate
0.10
USD
Today
CVMCel-Sci Corporation
Actual
—
Estimate
—
Today
TSETrinseo PLC
Actual
—
Estimate
−3.19
USD
Today
MOFGMidWestOne Financial Group, Inc.
Actual
—
Estimate
0.87
USD
Today
LITSLite Strategy, Inc.
Actual
—
Estimate
—
Today
EEXEmerald Holding, Inc.
Actual
—
Estimate
0.05
USD
Today
BIOXBioceres Crop Solutions Corp.
Actual
—
Estimate
0.07
USD
See more events
Community trends
Bitcoin at Strong Demand Zone – Next Big Move Loading!📊 Description✅ Setup BINANCE:BTCUSDT
BTC has been in a clear downtrend, respecting a descending trendline with multiple rejections.
Now price has reached a strong support/demand zone and we’re seeing a reaction.
Confluences on chart:
✔ Descending trendline break attempt
✔ Strong horizontal de

Bitcoin - Weekly Outlook: Smart Money Defends the WickMarket Context
Bitcoin recently delivered an aggressive move lower, printing a large weekly wick that immediately signaled strong participation from buyers. Instead of allowing price to drift deeper, the market reacted precisely around the midpoint of that wick, an area that often acts as a technic

BTCUSDT: Range Compression Signals Incoming Move To $72,300Hello everyone, here is my breakdown of the current BTCUSDT setup.
Market Analysis
BTCUSDT previously traded inside a clearly defined range near the highs, where price moved sideways while forming equal highs and lows. This structure reflected temporary balance between buyers and sellers rather t

Bitcoin H4 Breakout | Compression Ends, Momentum Begins📊 Technical Overview BINANCE:BTCUSDT
Bitcoin has been consolidating inside a well-defined symmetrical triangle on the H4 timeframe, forming higher lows while facing consistent trendline resistance.
Price has now broken above the descending trendline, signaling a potential shift in short-term m

Bitcoin - Small correction before a big move upBitcoin is currently trading around $70,000 after recovering from a recent low. The market structure on the 4-hour timeframe shows a clear reaction from a liquidity event followed by a controlled move higher. However, price is now approaching a decision point as momentum begins to slow. The interact

Pippin, the perfect short (Major crash in the making!)Timing is of the essence. Here we have a perfect chart setup for a massive short, one that cannot be missed.
PIPPINUSDT went ultra hyper bullish recently hitting a new all-time high. This bullish move just now is running its course. It is over.
After a strong rise comes a major correction—the perf

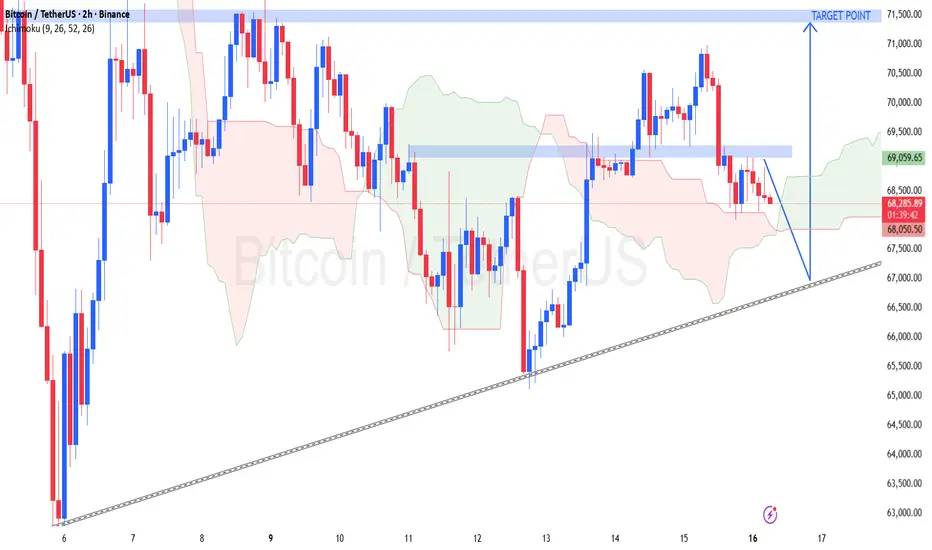
Bitcoin: Is the WXYXZ Correction Setting Up Wave C?Bitcoin: Is the WXYXZ Correction Setting Up Wave C?
During the last 5 days BTC declined by nearly 5% from 72250 to 65170
Looks like the B wave has more a corrective movement and is expanding as WXYXZ pattern. If the price manages to move above the previous X near 68300 it will add the chances t
Bitcoin - All ETF investors will get liquidated! (here is why)Bitcoin can drop below 40k later this year! But before that, in the short term, we may see a final drop to 58k, followed by a huge bear market rally to 85k. If you are confused, let's take a look at my prediction:
Short-term: 58k (wave A on the chart)
Mid-term: 85k (wave B on the chart)
Long-te

BITCOIN - Correction against the global bearish trend BINANCE:BTCUSDT.P is recovering from an interim low of 65K. The area of interest is 71,500, but it is too early to talk about a bull market, as the influence of buyers may be short-term within the global downtrend.
The main growth factor that emerged on Thursday/Friday was cooling inflation in

BTCUSDT (2H) —CHART)...BTCUSDT (2H) —CHART).
Based on MY chart, BTC is currently trading inside a healthy ascending structure with price respecting a rising trendline and reacting from a key demand/support zone. The market recently faced rejection from the upper resistance area and is now making a controlled pullback, wh
See all crypto ideas
XAUUSDHello Traders! 👋
What are your thoughts on Gold?
Gold is currently moving within a well-defined ascending channel. In the short term, price is expected to continue fluctuating inside this channel structure. A breakout above the channel and the previous swing high resistance appears unlikely at thi
GOLD 1H CHART ROUTE MAP UPDATE & TRADING PLAN FOR THE WEEKHey Everyone,
Please see our 1h chart levels and targets for the coming week.
We are seeing price play between two weighted levels with a gap above at 5085 and a gap below at 4954, as support. We will need to see ema5 cross and lock on either weighted level to determine the next range.
We will se

Gold Holding Support - Path Toward 5,150 OpensHello traders! Here’s my technical outlook on XAUUSD (4H) based on the current chart structure. Gold previously traded within a steady bullish structure, moving inside a clearly defined ascending channel where price respected both the dynamic support and resistance boundaries. This phase showed cons

Gold next move (weekly forecast) (16th Feb - 20th Feb-2026)Go through the analysis carefully, and do trade accordingly.
Anup 'BIAS for the week (16th Feb - 20th Feb-2026)
Current price- 5005
"if Price stays below BIAS LEVEL 5080-85, then the next target is 4900, 4800 and 4760 and Above it 5200 and 5350"
Reason:
WEEK= previous week candle swept the BSL

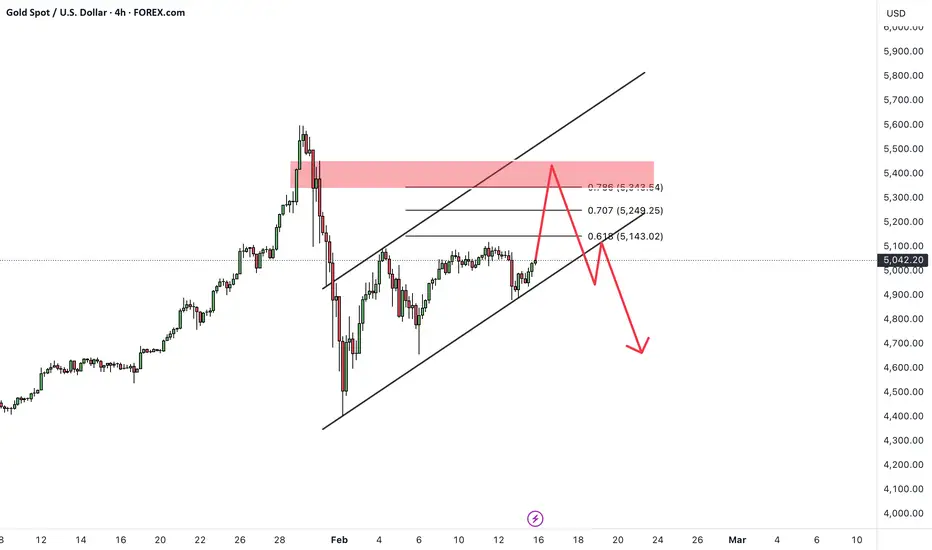
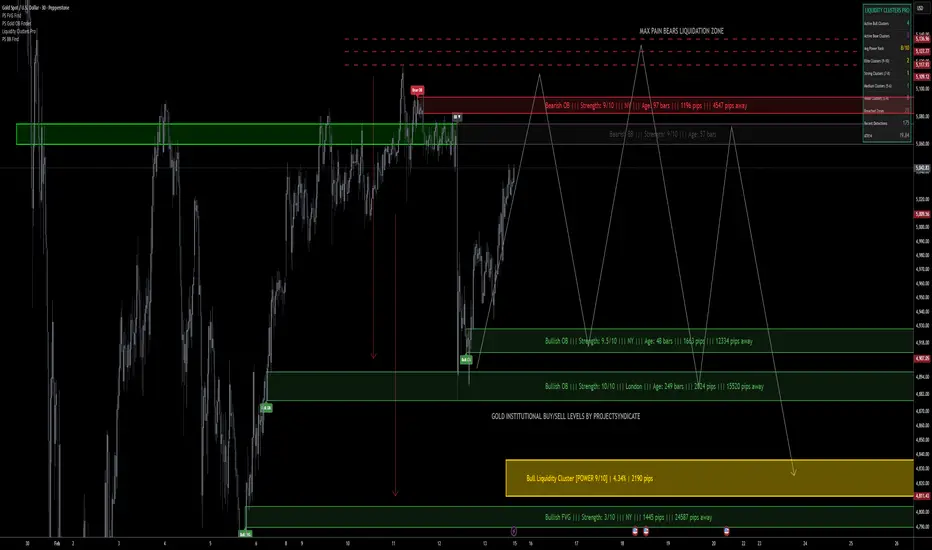
Gold Weekly Levels: Bears will target Liquidity: 4800 → 4900🔱 XAUUSD — GOLD WEEKLY OUTLOOK Price now: 5042
⬛ ProjectSyndicate FREE TradingView Smart Money Concepts Indicators
🩶 Want to get all key levels marked up on your gold chart Automatically?
🩶 Get the latest FREE SMC 2026 PS script via link below.
🩶 Add to your Favorites List and then just add to
XAUUSD Bullish Break: Higher Low Confirms Gold UpsideGold (XAUUSD) is currently trading around the 5,040 – 5,050 zone, holding above a key internal support area after printing a clear Change of Character (ChoCH) followed by a Higher Low (HL).
The structure shows:
Previous Lower High (LH) formation
Break in structure → ChoCH
Formation of Higher Hig

Selelna | Xauusd Market Analysis Structure Buy MondayPEPPERSTONE:XAUUSD
Market Overview:
Price pulled back into a strong demand zone after rejecting 5,100 resistance.
Holding above 4,920 keeps the short-term bullish continuation bias intact.
TP1: 5,040
TP2: 5,100
Entry: 4,950 – 4,980
Stoploss: 4,900
(For educational purposes only.)

Lingrid | GOLD Weekly Outlook: Coiling for Next Leg Up ?OANDA:XAUUSD week of indecision—oscillating between $4,900 and $5,080—reflects a market testing buyer resolve amid conflicting signals. The price action remains trapped in a tight range as traders debate whether the recent pullback is a pause or a reversal, with multiple resistance and support leve

GOLD - Bulls in the game? Attempting to break through 5100...Last week was volatile for FX:XAUUSD : it rose to $5,100, then fell sharply by 3%, and then rebounded on the back of new US inflation data. Technically and fundamentally, the outlook is positive.
The CPI, which traders had been eagerly awaiting, slowed more than expected, which boosted buyer i

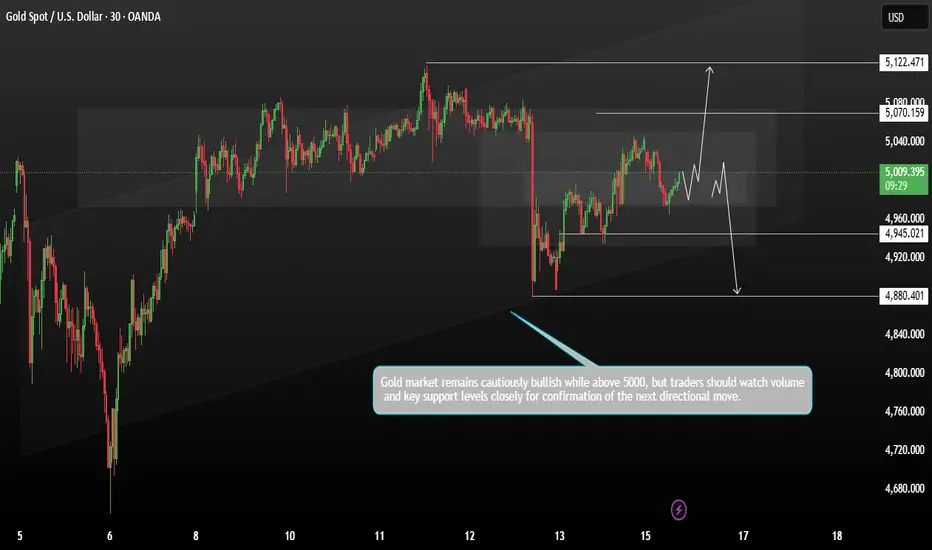
GOLD Consolidation Phase Both sides defined rangeGold remains in a consolidation phase, with price action moving within a defined range. The broader bias stays bullish as long as the key 5000 support level holds.
Technically, today’s price decline appears to be driven by thin trading volume. With the U.S. and China markets partly inactive due to
See all futures ideas
EURUSD Short: Bearish Triangle Building Below SupplyHello traders! Here’s my technical outlook on EURUSD (1H) based on the current chart structure. EURUSD was previously trading within a well-defined descending channel, where price respected both the dynamic resistance and support boundaries while forming consistent lower highs and lower lows. This s

GBPJPY Range Accumulation – Risky Long Setup Toward 210.15GBPJPY Range Accumulation – Risky Long Setup Toward 210.15
GBPJPY is showing signs of accumulation after multiple rejections from the 207.60–207.90 demand zone.
Price is currently consolidating above support while forming higher lows, suggesting bullish pressure is building.
Immediate resistanc

|SetupsFX_| #EURUSD: 592+ Pips Buying OpportunityDear Traders,
We have identified an excellent buying opportunity on EURUSD. The current price behaviour and momentum suggest a strong bullish volume will enter the market in the coming days. We recommend entering the market on Monday and having it settled during the Asian session. A suitable entry

GBPUSD Rebounds From Demand Bullish Move....
On the 1-hour chart, GBPUSD is trading inside a descending channel where overall structure remains bearish. However, price reacted strongly from the marked demand zone and climbed back above the Ichimoku cloud support, showing short-term bullish momentum. The market is now pushing into a supply/FVG

EURCAD Coiling at Resistance Breakout Brewing or Quick FakeoutEURCAD is tightening up right under a well-defined resistance band after a messy pullback from the highs. What I like here is the structure: we’ve got compression, higher reaction lows, and repeated tests into the same ceiling. That usually means pressure is building. But with CAD tied closely to oi

16.02.26 Daily ForecastPairs on Watch -
FX:GBPAUD
FX:GBPCAD
FX:GBPJPY
A short overview of the instruments I am looking at for today, multi-timeframe analysis down to what I will be looking at for an entry. Enjoy!

NZD/JPY - Trendline Break – Bulls Taking Control? (16.02.2026)📊 Description ✅ Setup OANDA:NZDJPY
NZDJPY has been in a clear downtrend, respecting a descending trendline with multiple rejections (A–C). Now price is reacting from a key demand/support zone and attempting a trendline breakout.
Confluences:
✔ Descending trendline breakout attempt
✔ Demand/sup

EURUSD Holding Demand, Preparing for a Move Toward 1.1930Hello traders! Here’s my technical outlook on EURUSD (3H) based on the current chart structure. EURUSD previously transitioned from a bearish environment into a clear bullish recovery after breaking out of a descending channel. This breakout marked a shift in market control, as buyers stepped in agg

EURUSD: Support & Resistance Analysis For Next Week 🇪🇺🇺🇸
Here is my latest support and resistance analysis for EURUSD
for the next week.
Consider these structures for pullback/breakout trading.
❤️Please, support my work with like, thank you!❤️
I am part of Trade Nation's Influencer program and receive a monthly fee for using their TradingView char

EURUSD Price Update – Clean & Clear ExplanationEUR/USD is currently trading around 1.1864, moving within a short-term consolidation phase after a strong bullish rally earlier in the week. Price initially broke above the ascending channel but failed to sustain momentum, leading to a sharp pullback and a transition into sideways movement.
The EUR

See all forex ideas
Trade directly on Supercharts through our supported, fully-verified, and user-reviewed brokers.


