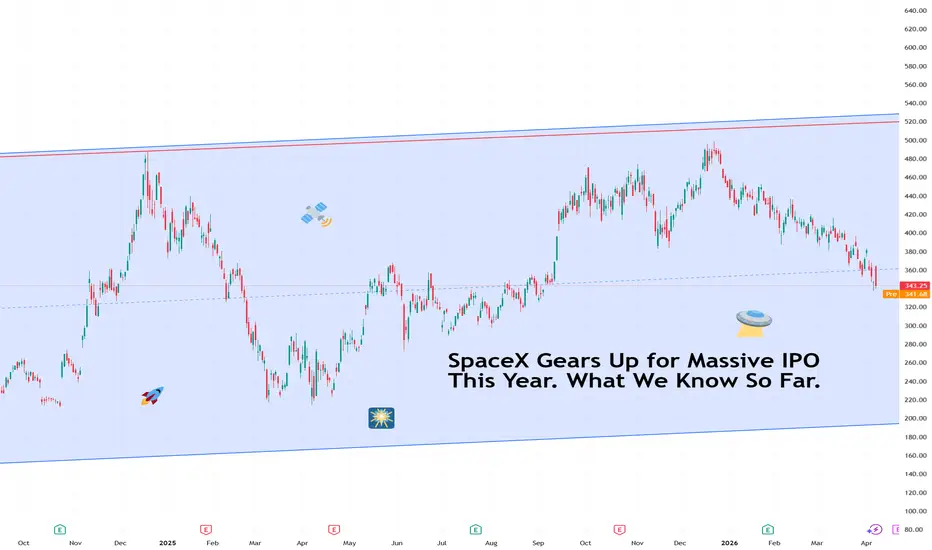
SpaceX Gears Up for Massive IPO This Year. What We Know So Far.At some point in the next few months, you may have the opportunity to own a piece of a rocket company . Not just any rocket company.
It’s the biggest privately-held rocket company that lands boosters on drone ships in the middle of the ocean and has made reusable spaceflight so routine that the l

The best trades require research, then commitment.
Get started for free$0 forever, no credit card needed

Scott "Kidd" PoteetPolaris Dawn astronaut

Where the world does markets
Join 100 million traders and investors taking the future into their own hands.
BTC Structure at Decision Point Hold $60K or Correct to $34KPrice is currently pulling back into a key horizontal level (Support & Resistance Block) which previously acted as a strong resistance, rejecting price on multiple occasions before the eventual breakout. That breakout flipped the level into support, and the current retest is a critical validation of

BTCUSD: We are exactly halfway through the Bear Cycle.Bitcoin remains extremely bearish on its 1W technical outlook (RSI = 36.027, MACD = -9332.300, ADX = 26.249) despite the consolidation of the past 2 months. One would assume that would make the market neutral but being in a Bear Cycle, this consolidation is simply an accumulation period for sellers.

EUR/USD testing AB=CD resistancesFrom the daily chart of the EUR/USD, the pair gained traction today amid a broad-based USD sell-off following the recent US-Iran ceasefire.
Technically, the unit is now shaking hands with a resistance zone between US$1.1734 and US$1.1690 – a base made up of a 1.272% Fibonacci projection and a 100%

GOLD: Bulls Denied at the Ceiling! Target $4,640 in SightGold's recent recovery has slammed into a massive wall of institutional supply. On the 2-hour chart, the technical confluence is screaming "rejection," and history looks ready to repeat itself.
The Macro Context: The Great Compression 🛰️
Since the mid-March volatility, Gold has been coiling within

Litecoin | Logics Say One Thing But Market Structure Say OtherLTC is in a very interesting situation similar to 2022, where the political situation and tensions were similar or even lighter compared to current one but the psychological impact on traders showed that we had a quick dip and recovery before a bigger downside momentum here.
So maybe we will see a

Oil Crash + Softer USD | Ceasefire Sparks Risk-On NASDAQ Rally!Hey Traders, in today’s trading session we are monitoring NASDAQ for a buying opportunity around the 24,600 zone. NASDAQ was previously trading in a downtrend and has now successfully broken out of that structure. Currently, price is in a correction phase and is approaching the retracement area near

GC: Holding the Line After a Historic UnwindMacro Crosscurrents Driving Gold’s Volatility
Reaching a meaningful milestone in any ongoing market coverage often coincides with periods of reflection, and the current backdrop in gold provides exactly that. The macro landscape surrounding Gold Futures has been anything but stable, offering a fit

The 2025 TradingView Community Awards Are OfficialThe markets were loud in 2025.
Throughout the year, the TradingView community shared ideas, challenged narratives, built tools, and kept discussions moving forward.
Let us show you what we mean by that.
📊 2025 by the Numbers
Last year, the community delivered at scale.
Authors
✔️ Public idea

WTI Holds $100 Threshold Ahead of US-Iran DeadlineAs we enter Q2 2026, crude oil prices continue to point toward further upside risks in line with ongoing energy disruptions in the Middle East, despite headlines on potential de escalations.
From a price action perspective, crude is:
• Holding above the 2023 highs and resistance at $91–93 per barr

See all editors' picks ideas
CVD Profiles [TradingIQ]Hello Traders!
🔹 CVD Profiles
CVD Profiles is a profile-based order flow visualization tool designed to show how participation distributes across price levels - not just over time, but through price itself .
Think volume profile data + TPO time segmenting!
Instead of looking at cumulative delt
Pine Script® indicator

Volume Bubbles [QuantAlgo]🟢 Overview
The Volume Bubbles indicator is a multi-layered volume cluster detection system that identifies statistically significant volume events directly on your price chart, classifying them by magnitude (Small, Medium, Big) and direction (Buy, Sell, Mixed). By combining adaptive percentile t
Pine Script® indicator

Monte Carlo CT [SS]This is the Monte Carlo CT indicator.
CT stands for "central tendencies" and is the real distinguishing characteristic of this indicator against other Monte Carlo based indicators.
In statistics, Central Tendency is a single value that attempts to describe a set of data by identifying the central
Pine Script® indicator

HTF Volume Spike & Imbalance Projection [LuxAlgo]The HTF Volume Spike & Imbalance Projection indicator provides a comprehensive multi-timeframe analysis tool that projects higher timeframe (HTF) candle structures, volume spikes, and volume profiles directly onto the current chart. This script aims to bridge the gap between different time horizon
Pine Script® indicator

Swing Structure Forecast [BOSWaves]Swing Structure Forecast - Statistical Swing Projection System with Volatility-Adaptive Support and Resistance Detection
Overview
Swing Structure Forecast is a statistically-driven swing analysis system that maps directional price structure through confirmed pivot identification, where supp
Pine Script® indicator

TASC 2026.04 A Synthetic Oscillator█ Overview
This script implements a Synthetic Oscillator as presented by John F. Ehlers in the April 2026 TASC Traders' Tips article "Avoiding Whipsaw Trades". The indicator aims to provide a smooth, low-lag oscillator for timely trading signals by dynamically mapping a sine wave to price data
Pine Script® indicator

Volume Spread Analysis IQ [TradingIQ]Hello Traders!
🔹Volume Spread Analysis IQ
This indicator was most voted on for our indicator competition - so here it is! Hope you guys like it :D
Volume Spread Analysis IQ is a chart-reading tool built to help traders judge effort, result, and background context in a way that is visual and
Pine Script® indicator

Market Microstructure AnalyticsThe Hidden Toll on Every Trade
Every time you buy or sell a financial instrument, you pay a cost that never appears on your brokerage statement. It is not a commission. It is not a fee. It is the spread between the price at which someone is willing to sell to you and the price at which someone is
Pine Script® indicator

Fair Value Gap Profile + Rolling POC [BigBeluga]🔵 OVERVIEW
FVG Profile builds a price-level profile based on detected Fair Value Gaps (FVGs) over a fixed lookback period.
Instead of measuring traded volume alone, this tool aggregates bullish and bearish FVG occurrences into horizontal bins, allowing traders to see where price inefficienci
Pine Script® indicator

PineScript integration with Notepad++ (UDL)THIS IS NOT AN INDICATOR!
This is PineScript integration with Notepad++ text editor (NPP). It supports PineScript v6 as of January 2026. Provides autocompletion, function list and syntax highlighting for *.pine files.
Why would anyone need this?
Pine Editor doesn't provide function list yet
Pi
Pine Script® indicator

See all indicators and strategies
Community trends
SpaceX Gears Up for Massive IPO This Year. What We Know So Far.At some point in the next few months, you may have the opportunity to own a piece of a rocket company . Not just any rocket company.
It’s the biggest privately-held rocket company that lands boosters on drone ships in the middle of the ocean and has made reusable spaceflight so routine that the l
Intel - New highs after 26 years!🚀Intel ( NASDAQ:INTC ) is respecting all structure:
🔎Analysis summary:
Over the past 10 days, Intel has been rallying another +40%. And while some think that this was a surprise, all of this has absolutely been expected. Looking at the higher timeframe, Intel can actually create new all time

BERKSHIRE HATHAWAY, Massive Bull-Pennant On Huge Earnings Boost!Hello,
Welcome to this analysis about the Berkshire Hathaway Stock on the 4-hour timeframe perspectives. As I detected the stock has shown up with great earnings numbers recently with the earnings showing substantial percentages upward, besides that I spotted a main pivotal formation forming here

$NIO no brakes, pure momentumNYSE:NIO no brakes, pure momentum
- March 2026 deliveries: +136% YoY
- Q1 2026 deliveries: +98% YoY (83,465 vehicles)
- Over 1.08M cumulative deliveries
👉 In a slowing EV market, NIO is still growing aggressively.
While others are stalling, NYSE:NIO is accelerating.
Still holding NIO and will

Alphabet (GOOGL) Technical Update: Bulls Regain ControlOver the past months, we discussed GOOGL’s recent five-wave impulse, which set the stage for the recent corrective structure. As expected, the stock has seen a strong rebound over the last two weeks after completing a three-wave decline into the 270 area that we had been tracking.
After a three-wav

RIOT and Miners strong bouncedA nice bounce from NASDAQ:RIOT recovering the daily 200EMA and pivot and breaking out of the local downtrend.
Bulls want to see follow though now, not another rejection back into the range lows
The previous bullish divergence was negated.

Not sayin’ it’ll happen, def couldWhen you zoom out on the Meta chart and move to the weekly, downturn with H&S pattern is undeniable, a retrace to 437 area on 50% fib retrace would be first target, 350ish at .618 I will get long. I am not short…. But if this starts moving my way after the shooting star dojo from yesterday, I will

TSLA - ELONG or ESHORT ? Why Wyckoff ISN'T WORKINGTESLA on the multi month view gives an interesting perspective.
If we consider the WyckoffMethod, it tells us that investors are always accumulating, swinging, selling, repeat.
Wyckoff Method says:
It goes into a hec of a lot detail which I will not cover for the simple reason that, it's likel

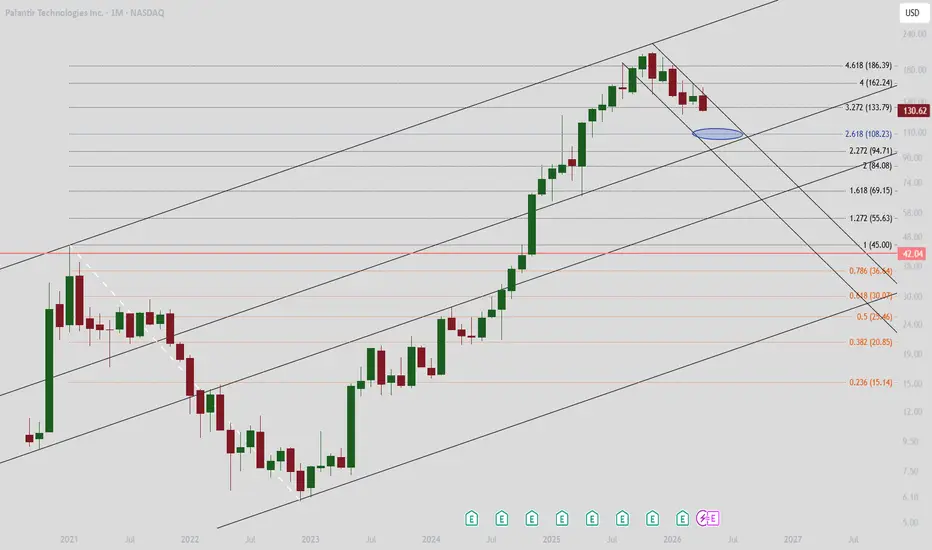
PLTR: look out belowbreaking below $130 is a clear downward trend.
Next support is $105-110. Another 15% down.
Who's buying???
UnimaginableA company that, in past years, faced some legal issues for having facilitated hospital admissions was punished by the market with a massive sell‑off.
However, revenue and sales keep rising, and the huge trading volumes show strong interest in the stock.
Last week’s confirmed breakout triggered the

See all stocks ideas
Today
COSMCosmos Health Inc.
Actual
—
Estimate
−0.04
USD
Today
PLCEChildren's Place, Inc. (The)
Actual
—
Estimate
−0.96
USD
Apr 13
FASTFastenal Company
Actual
—
Estimate
0.30
USD
Apr 13
GSGoldman Sachs Group, Inc. (The)
Actual
—
Estimate
16.47
USD
Apr 13
ALOTAstroNova, Inc.
Actual
—
Estimate
—
Apr 13
FBKFB Financial Corporation
Actual
—
Estimate
1.10
USD
Apr 14
BLKBlackRock, Inc.
Actual
—
Estimate
11.75
USD
Apr 14
JNJJohnson & Johnson
Actual
—
Estimate
2.68
USD
See more events
Community trends
BTC Structure at Decision Point Hold $60K or Correct to $34KPrice is currently pulling back into a key horizontal level (Support & Resistance Block) which previously acted as a strong resistance, rejecting price on multiple occasions before the eventual breakout. That breakout flipped the level into support, and the current retest is a critical validation of
BTCUSDT Long: 2022 Fractal in Play – Will BTC Break Higher?Hello traders! Here’s my technical outlook based on the current BTCUSDT (1D) chart structure, with a comparison to the 2022 cycle. BTC previously traded inside an ascending channel, forming higher lows and showing bullish continuation. The structure very similar to the 2022 cycle. In both cases, the

Is BITCOIN Preparing the Next Wave Down? Wyckoff Distribution!Hello There,
welcome to my updated analysis about Bitcoin and the Wyckoff distribution I mentioned in my first analysis about this topic. In recent times, major bearish pressure increased, pushing the price below crucial zones. Also, massive bearish dumping accelerated. Over 100 million long liqui

The MEME is currently the most bullish meme coin in crypto!Considering the higher lows formed after extended corrections and the bullish CH (Change of Character) visible on the chart, it is possible to take a buy/long position in the direction of the bulls.
There are specific entry points identified, and it is recommended to enter them gradually using a DC

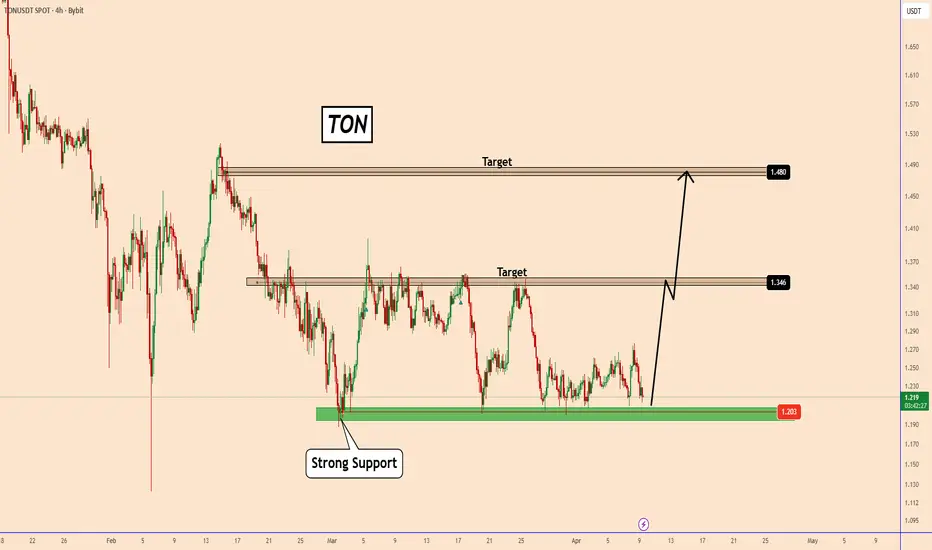
TON Holds Strong Support – Bullish Recovery Could Happen SoonTON Holds Strong Support – Bullish Recovery Could Happen Soon
TON is currently consolidating above a well-defined strong support zone, showing signs of accumulation after a prolonged downtrend.
Price has repeatedly respected this support area near $1.2 , indicating buyer interest and potential ba
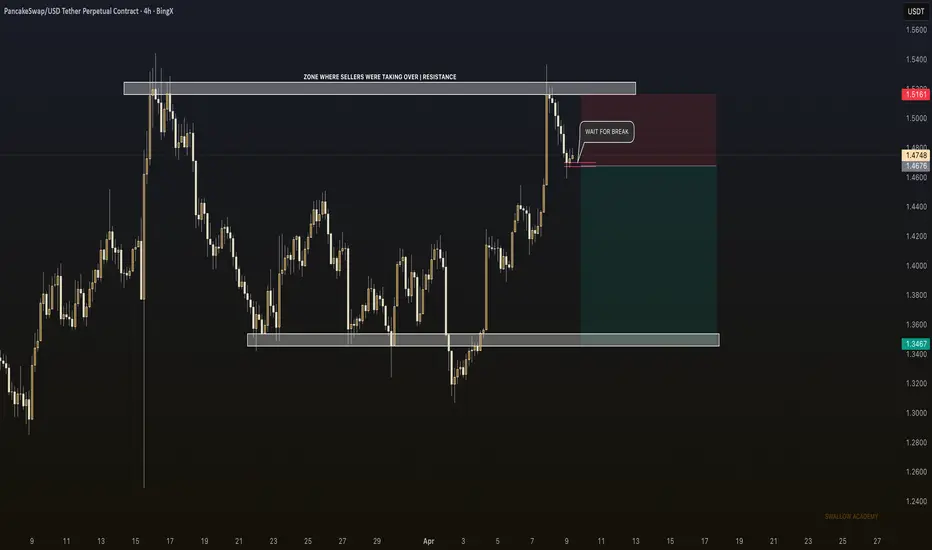
Pancake Swap (CAKE) | Resistance Rejected – Range TradingCAKE did reach recently the resistance zone from where the sellers took over the movement and rejected the price completely.
Going to be trading here within the ranges of resistance and approximate support area, which we have set as a zone at $1.353.
So all we need now is another break of structur
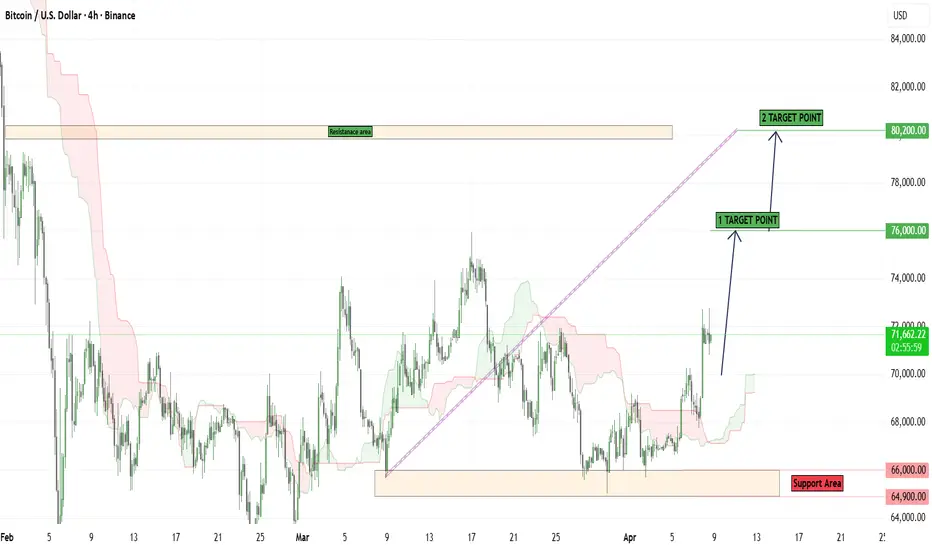
BTCUSDT: Rejected at 72.8K - 70.5K Support in FocusHello everyone, here is my breakdown of the current BTCUSDT setup.
Market Analysis
BTC previously traded inside a downward channel, forming lower highs and confirming bearish pressure. After multiple breakdown attempts, price found support and entered a range, showing consolidation before the nex

BTCUSDT Holding Support - Upside Liquidity in FocusHello traders! Here’s my technical outlook based on the current BTCUSDT (1H) chart structure. Price previously moved inside an ascending structure, forming higher lows after a recovery from the bottom. BTC then entered a range, showing consolidation before continuation. After the breakout from the r

XRP Lovers… The Setup Is BrewingXRP is once again mirroring its previous cycle, and the structure is starting to look very familiar.
Back then, after a prolonged correction, price bottomed right as RSI dipped into oversold territory… followed by a reclaim above the signal line that kicked off a strong bullish move.
Now? We’re se

BTCUSD – Market Bullish AnalysisBTCUSD – Market Structure Analysis
Following a prolonged corrective phase, Bitcoin established a consolidation base, indicating a period of accumulation. The recent impulsive move to the upside suggests a shift in market sentiment, with price breaking above short-term resistance and confirming early
See all crypto ideas
Gold Update: Key Levels and Dip BuyingHey everyone,
Please see our 1H chart market update.
After clearing 4698 and 4778, we saw EMA5 cross and lock above 4778 opening 4876, price moved in the expected direction; however, the full gap was not completed.
Price then rejected back into 4778 for a bounce, followed by a move lower into 46

Pullback Buy Bias Into Marked SupportsXAUUSD – Pullback Buy Bias Into Marked Supports
Gold is no longer sitting in the cleanest sell location.
The current structure is better described as a bullish displacement out of a prior balance area, followed by a pullback phase into well-defined support. The larger Fibonacci levels on the char

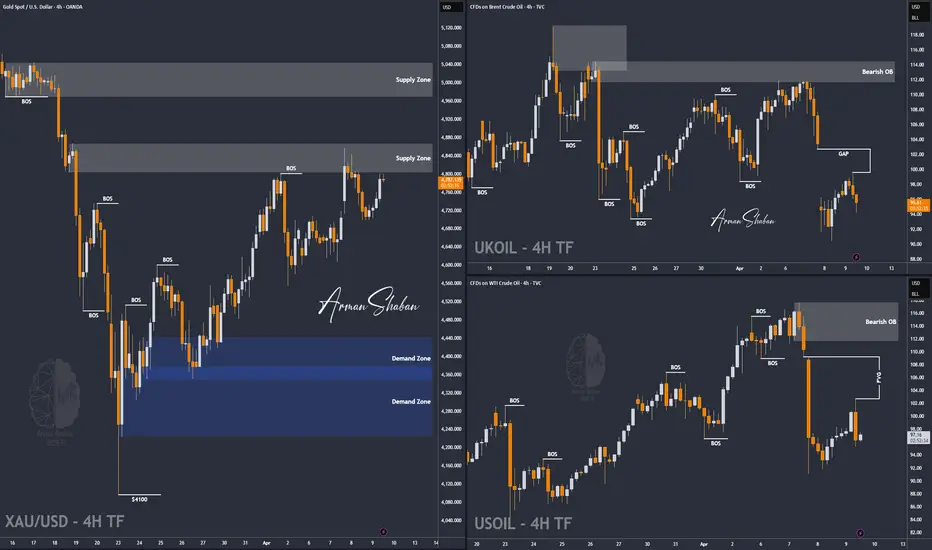
Gold, Oil & Geopolitics | Markets Waiting For The Next Move!By analyzing the #Gold chart on the 4H timeframe, we can see that the market is currently trading around the $4795 region after the strong reaction from the $4800 – $4850 supply zone. This level continues to act as a key resistance where sellers have repeatedly stepped in.
What makes the current
Gold Price Action Analysis – Key Support and Resistance LevelsThis chart provides an in-depth technical analysis of Gold (XAU/USD), focusing on crucial support and resistance levels. The Key Resistance at 5,211.636 USD is a significant level where the price could face strong rejection, while the Minor Resistance at 4,865.079 USD is another key level to watch f

XAUUSD: Ascending Channel Holds – Gold Ready to Move HigherHello everyone, here is my breakdown of the current XAUUSD setup.
Market Analysis
Gold previously traded inside a downward channel, forming lower highs and confirming bearish pressure. After a breakout, price entered a consolidation range, showing accumulation before the next move. Following this

Gold Bulls Trapped – Reversal Signals Are Building1. What happened yesterday
Yesterday was a nasty session for Gold bulls.
Price completely erased Tuesday’s breakout attempt, reversing sharply and dropping back toward the 4700 zone. What initially looked like a continuation turned into a classic failure move.
The key takeaway:
- The market reje
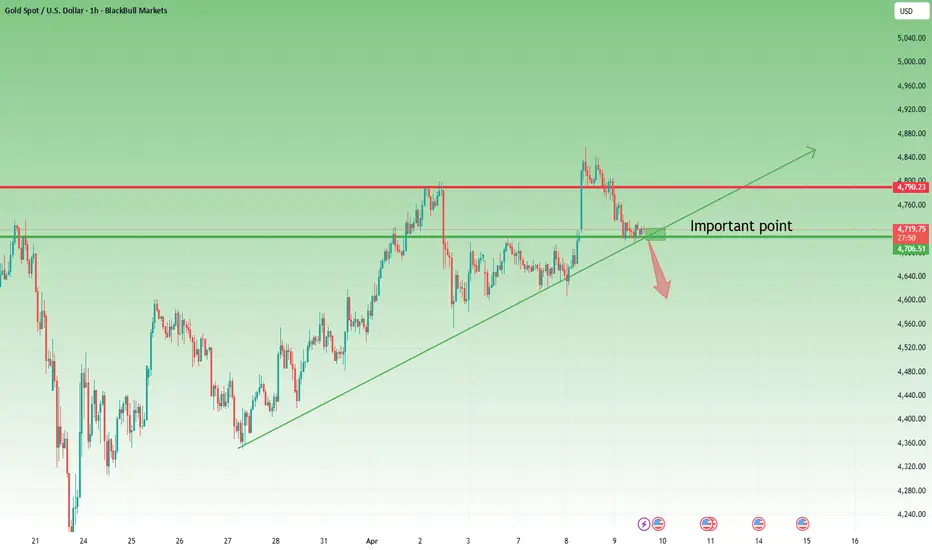
GOLD (XAU/USD): Your Trading Plan to Buy Gold TodayGold is currently consolidating at a strong intraday/daily support level.
📈If you are looking for a bullish confirmation,
I suggest waiting for a bullish breakout of an upper boundary of the range.
A confirmed violation would be indicated by an hourly candle closing above 4735.
A bullish continuat

Gold Bullish Breakout SetupGold is moving in a strong uptrend, holding above the support trendline. Price is currently approaching a key resistance zone near 4850.
🔹 If breakout happens → bullish momentum can push towards 5080 (target)
🔹 If rejection → possible pullback to 4745–4665 support zone

XAU/USD | Further drop incoming! (READ THE CAPTION)Gold has been on a wild journey this year! After reaching the Supply zone at 4832-4867, it started to drop in price, going from 4858 all the way to 4698, just below the 4H FVG, but then it bounced back up and is currently being traded at 4754, about to reach the supply zone at 4768-4807.
I expect

GOLD: Bulls Denied at the Ceiling! Target $4,640 in SightGold's recent recovery has slammed into a massive wall of institutional supply. On the 2-hour chart, the technical confluence is screaming "rejection," and history looks ready to repeat itself.
The Macro Context: The Great Compression 🛰️
Since the mid-March volatility, Gold has been coiling within
See all futures ideas
EURUSD - Distribution. Rally following a correction FX:EURUSD is entering a distribution phase following a prolonged consolidation. However, the market is forming a false maneuver to hunt for liquidity...
The dollar is falling amid geopolitical developments, specifically a temporary de-escalation. However, the situation in the Middle East remains t

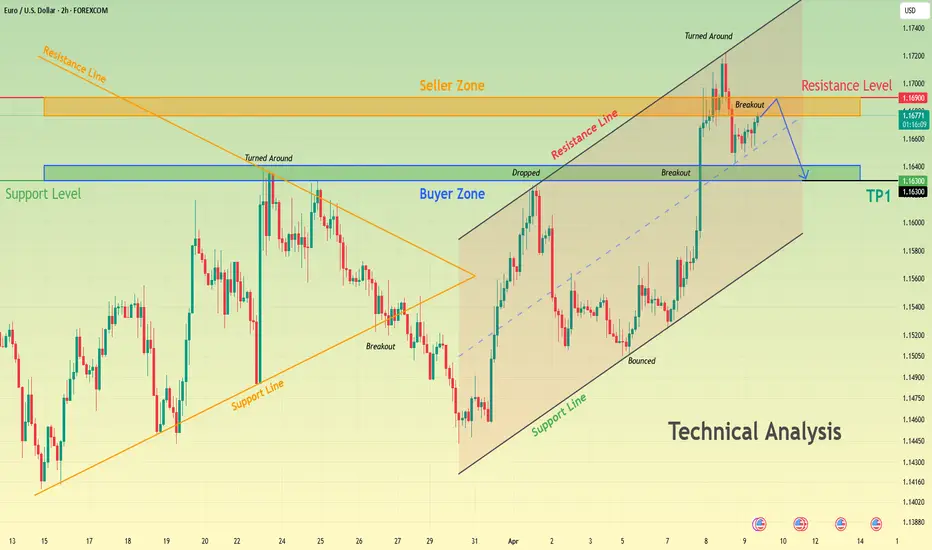
EURUSD Rejection at Resistance – Short Setup in PlayHello traders! Here’s my technical outlook based on the current EURUSD (2H) chart structure. Price previously shifted into an ascending channel after finding support near the buyer zone, forming higher lows and showing bullish momentum. However, the market is now approaching a strong resistance area
USDJPY Bullish Recovery After Liquidity Sweep with Upside TargetThis **USDJPY (1H timeframe)** chart illustrates a complete market cycle — from a bearish trend into consolidation, followed by a recovery phase signaling potential bullish continuation.
Initially, price was moving inside a **clear descending channel**, forming lower highs and lower lows, confirmin
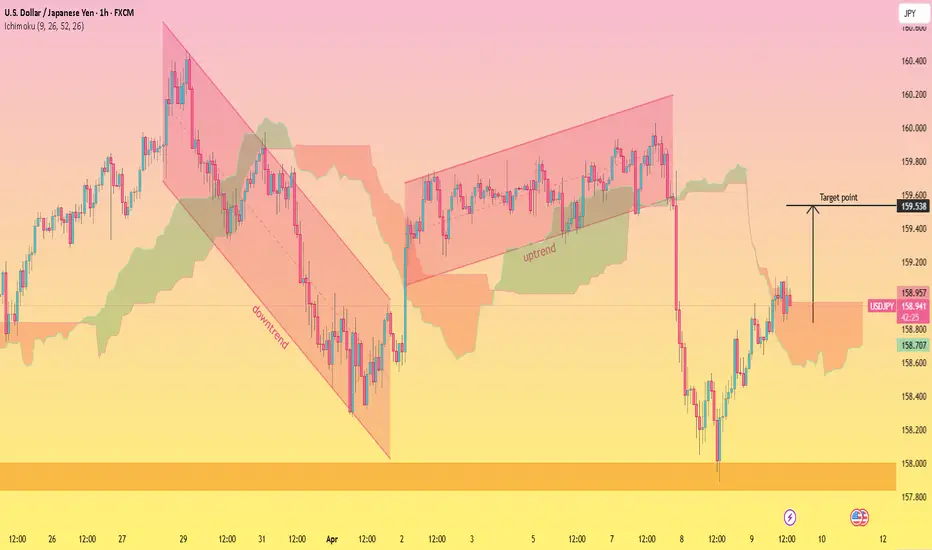
USDJPY Rebounds After Pullback – Uptrend ContinuesUSDJPY Rebounds After Pullback – Uptrend Continues
In the broader picture, USDJPY remains confined to a strong uptrend.
The price is still in a correction and is dominated more by a bullish momentum despite it falling from a pause in the war between the US and Iran.
The price started to rise in a

EURUSD - Can the bulls take control again?EURUSD has been showing a steady recovery after forming a base in the lower range, pushing higher with improving short-term momentum. The recent move upward has brought price into a key higher timeframe resistance zone, making this area crucial for determining whether the pair can continue its recov

USDJPY 30Min Engaged ( Bullish & Bearish Reversal Entry Detecte⚡Base : Hanzo Trading Alpha Algorithm
The algorithm calculates volatility displacement vs liquidity recovery, identifying where probability meets imbalance.
It trades only where precision, volume, and manipulation intersect —only logic.
✈️ Technical Reasons
/ Direction — LONG / Reversal 158.730 Ar

Buy EUR/JPY : Bullish Pennant Breakout (09.04.02026)Description Setup Overview: FX:EURJPY
EUR/JPY is showing a bullish pennant breakout on the 30-minut e chart after a strong impulsive move higher. Price consolidated inside the pennant structure and is now attempting to continue in the direction of the prior trend. This type of setup often signal

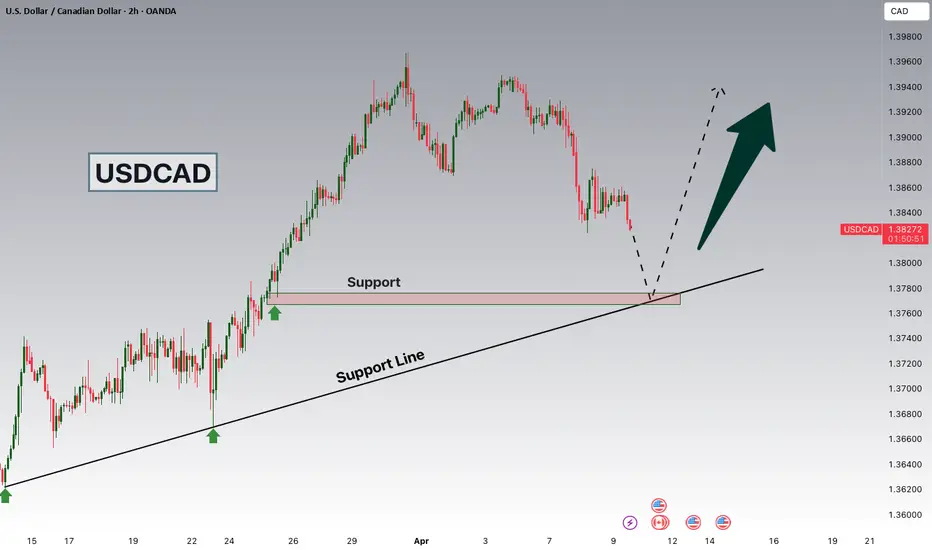
USDCAD Potential Upsides!Hey Traders, in today's trading session we are monitoring USDCAD for a buying opportunity around 1.37700 zone, USDCAD is trading in an uptrend and currently is in a correction phase in which it is approaching the trend at 1.37700 support and resistance area.
Trade safe, Joe.
USDJPY – Key Support & Resistance ZonesPrice approaching major resistance at 159.92; monitor for potential pullback. Support zones at 157.00, 155.00, and 153.00 are key areas to watch for bounces or trend reversal. Short-term reaction expected near minor resistance at 158.71.

EURUSD Short: Weak Momentum at Highs Points to Downside MoveHello traders! Here’s my technical outlook based on the current EURUSD (4H) chart structure. Price previously traded inside a descending channel, forming lower highs and confirming bearish pressure. After a breakdown, EURUSD found support and started forming a recovery phase.
Currently, price broke

See all forex ideas
Trade directly on Supercharts through our supported, fully-verified, and user-reviewed brokers.


