Why the Reaction Matters More Than the Level!!!Most traders spend their time hunting for the perfect level.✖️
Support. Resistance. Demand. Supply.
They draw the zone… and assume price must react.
But professionals know something crucial:
The level itself is not the edge.
The reaction is.
Here’s why.
1️⃣ Levels Are Common Knowledge
Everyone sees the same support.
Everyone sees the same resistance.
If levels alone were enough, everyone would be profitable.
A level is just a location.📍
It doesn’t tell you who is in control.
2️⃣The Reaction Reveals Intent
What matters is how price behaves at the level.
Ask yourself:
- Does price reject immediately or hesitate?
- Are candles impulsive or overlapping?
- Does price leave the level with strength or drift away slowly?
A strong reaction tells you:
➡️ One side stepped in aggressively.
A weak reaction tells you:
➡️ The level exists… but conviction doesn’t.
3️⃣ Clean Rejections Beat Perfect Levels
A slightly imperfect level with a violent reaction
is far more valuable than a textbook level with no follow-through.
Professionals wait for:
- sharp rejections
- momentum expansion
- structure confirmation
They don’t assume... they observe.
4️⃣ Failed Reactions Are Warnings
When price reaches a level and does nothing…
that silence is information.
Failed reactions often lead to:
- level breaks
- deeper moves
- trend continuation
The market is telling you:
➡️ “This level no longer matters.”
📚The Big Lesson
Levels tell you where to look.
Reactions tell you what to do.
If you shift your focus from drawing levels to reading behavior at levels,
your trading instantly becomes clearer and more objective.
⚠️ Disclaimer: This is not financial advice. Always do your own research and manage risk properly.
📚 Stick to your trading plan regarding entries, risk, and management.
Good luck! 🍀
All Strategies Are Good; If Managed Properly!
~Richard Nasr
Chart Patterns

Overtrading Gold – Biggest Account KillerOvertrading Gold – Biggest Account Killer
🧠 What Overtrading REALLY Means in Gold
Overtrading is not just trading too often — it’s trading without edge, patience, or contextual alignment.
In XAUUSD, overtrading usually looks like:
Multiple entries in the same range
Chasing price after impulsive candles
Trading every wick, every breakout, every news spike
📌 Gold gives the illusion of opportunity every minute — but institutions trade very selectively.
🧨 Why Gold Is the Perfect Trap for Overtraders
Gold is engineered (by behavior, not conspiracy) to punish impatience 👇
🔥 Extreme volatility
🔥 Fast candles & long wicks
🔥 Sudden reversals
🔥 News-driven manipulation
🔥 Liquidity sweeps above & below range
💣 Result?
Retail traders feel forced to trade — and end up trading against structure and liquidity.
🧩 The Overtrading Cycle (Account Destruction Loop)
Most gold traders repeat this cycle unknowingly ⛓️
1️⃣ Enter early (no confirmation)
2️⃣ Stop-loss hit by wick
3️⃣ Re-enter immediately (revenge)
4️⃣ Increase lot size
5️⃣ Ignore bias & HTF context
6️⃣ Emotional exhaustion
7️⃣ Big loss → account damage
📉 This cycle has nothing to do with strategy — it’s pure psychology.
🧠 Why Strategy Stops Working When You Overtrade
Even a 60–70% win-rate strategy will fail if:
❌ Trades are taken outside optimal time
❌ Entries ignore higher-timeframe direction
❌ Risk increases after losses
❌ Rules are bent “just this once”
📌 Gold exposes discipline weakness faster than any other market.
⏰ Time Is the Hidden Edge in Gold
Gold does NOT move efficiently all day ⏱️
🟡 Asian Session → Range & traps
🟡 London Open → Liquidity grab
🟢 New York Session → Real direction
Overtraders:
❌ Trade Asian noise
❌ Enter mid-range
❌ Chase NY expansion late
Smart traders:
✅ Wait for liquidity first
✅ Trade after manipulation
✅ Enter once direction is clear
📉 Statistical Damage of Overtrading
Let’s talk numbers 📊
🔻 More trades = more spread & commission
🔻 Lower average R:R
🔻 Lower win probability
🔻 Higher emotional stress
🔻 Faster drawdowns
💡 One A-grade setup can outperform 10 random gold trades.
🧠 Psychology: The Real Root Cause
Overtrading is driven by internal pressure 👇
😨 Fear of missing out
😡 Anger after stop-loss
😄 Overconfidence after win
😴 Boredom during ranges
Gold feeds emotions — and then punishes them.
📌 Institutions wait. Retail reacts.
🛑 How Professionals Control Overtrading
Real solutions — not motivational quotes 👇
✅ Maximum 1–2 trades per session
✅ Trade only at predefined time windows
✅ Fixed risk per trade (no exceptions)
✅ Daily stop after 2 losses max
✅ Journal every impulsive entry
📘 If it’s not planned before price moves, it’s emotional.
🏆 Golden Rule of XAUUSD
💎 Gold is not hard because it’s random
💀 Gold is hard because it exposes impatience
You don’t need more trades.
You need more discipline.
📌 Final Truth
Most XAUUSD accounts don’t blow because of:
❌ Bad indicators
❌ Bad analysis
❌ Bad strategy
They blow because of overtrading driven by emotion.
📉 Overtrading is the biggest account killer in gold trading.

Clean vs Trap Pullbacks — Don’t Get FooledIn trading, a pullback can be an opportunity…
but it is also one of the most common traps that causes traders to lose money.
Some pullbacks allow you to enter with low risk, clean RR, and follow the trend smoothly.
Others look perfectly reasonable… until the market reverses and wipes out your stop loss.
So how do you tell a clean pullback from a trap pullback?
1. Clean Pullback – A Pause Before Continuation
A clean pullback is a healthy correction within a strong, intact trend.
Think of it as the market catching its breath before the next push.
Key characteristics of a clean pullback:
◆ The main trend remains clear
Higher highs – higher lows (uptrend)
Lower lows – lower highs (downtrend)
◆ The retracement is weaker than the impulse move
Smaller candles, shorter bodies, long wicks
No structural break
◆ Volume decreases during the pullback
Selling (or buying) pressure is not aggressive
The market is simply “resting”
◆ Price pulls back into a logical area
Previous support/resistance
Structural zones
Common Fibonacci levels (38.2 – 50 – 61.8)
👉 A clean pullback does not damage the trend’s integrity — it only tests it.
2. “Trap” Pullback – Looks Like a Retracement, Acts Like a Reversal
Trap pullbacks usually appear after a trend has extended too far or when momentum starts to fade.
They make traders think:
“It’s just a normal pullback…”
But in reality, smart money is already distributing.
Signs of a trap pullback:
◆ Trend strength is clearly weakening
New highs fail to exceed previous highs
Previous lows start getting broken
◆ The retracement is strong and aggressive
Large-bodied candles closing deep
Price moves confidently against the trend
◆ Volume increases during the pullback
This is no longer a technical retracement
Real money is changing direction
◆ Market structure breaks
Key highs/lows are violated
Break → retest → continuation in the opposite direction
👉 Trap pullbacks exploit a trend trader’s overconfidence.
3. A Common Mistake: “Price Pulls Back = Enter Trade”
Many traders don’t lose because of bad analysis,
but because they enter too early.
Familiar thoughts:
“It pulled back to support — buy.”
“The trend is still bullish.”
“That candle is just a retracement.”
But the market doesn’t care what you think.
It only cares about where the money is flowing.
4. How to Avoid Trap Pullbacks – Survival Rules
If you remember these three rules, you’ll avoid most pullback traps:
◆ Never enter just because price pulls back
Wait for confirmation:
rejection candles
small break & retest
clear reaction at structure
◆ Always check market structure first
Is the structure intact or broken
Are key highs/lows still respected?
◆ Compare impulse vs retracement
Strong impulse – weak pullback → trend is alive
Strong pullback – weak impulse → reversal risk
How to Use Candlesticks in a High-Probability Way | Tutorial #1In this tutorial, we break down candlestick analysis in a clear, structured, and practical way—focused on probability, context, and confirmation , not guessing.
You’ll learn what candlesticks really represent , how to read market intent behind them, and how to use them correctly within a high-probability trading framework.
🔍 What are candlesticks?
Candlesticks visually represent price behavior, showing the battle between buyers and sellers within a specific time period. Each candle tells a story—but only when read in context.
📘 Candlestick Types Covered in This Tutorial
📌 1) Shrinking Candlesticks
➡️ What is a shrinking candle?
Shows loss of momentum and potential market pause or reversal.
📌 2) Inside Bar Candlestick
➡️ What is an inside bar candle?
Indicates consolidation and compression before expansion.
📌 3) Takuri Line Candlestick
➡️ What is a Takuri Line candle?
A strong bullish rejection candle with a long lower wick.
📌 4) Hanging Man Candle
➡️ What is a hanging man candle?
Warns of potential bearish reversal after an uptrend.
📌 5) Inverted Hammer
➡️ What is an inverted hammer candle?
Shows buyer reaction after downside pressure.
📌 6) Shooting Star
➡️ What is a shooting star candle?
Signals seller dominance near highs.
📌 7) Spinning Top Candle
➡️ What is a spinning top candle?
Represents indecision between buyers and sellers.
📌 8) Spinning Bottom Candle
➡️ What is a spinning bottom candle?
Indicates uncertainty after downside movement.
📌 9) Doji Candle
➡️ What is a doji candle?
Shows balance—often a warning sign before a shift.
📌 10) Engulfing Candle
➡️ What is an engulfing candle?
Strong momentum candle that fully absorbs the previous one.
📌 11) Momentum Candlestick
➡️ What is a momentum candle?
Large-bodied candle showing aggressive participation.
📌 12) Change Color Candle
➡️ What is a change color candle?
Occurs after minimum 5 candles of one color , followed by a candle of the opposite color—often signaling momentum shift.
🧠 Best Practice
Candlesticks work best when multiple candles stack together, forming a story—not when traded individually.
This tutorial shows real chart examples of candle clustering and how to interpret them properly.
⚠️ Important Note
Candlesticks alone are NOT enough.
They should be combined with:
--> Support & Resistance
--> Areas of Confluence
--> Chart Patterns
--> Trendlines
--> Indicators
--> Other high quality traits
This is how high-probability setups are built.
👍 Want PART 2?
Leave a like and a comment below.
Follow for high-quality trading education and clean technical logic.
⚠️ DISCLAIMER
This content is for educational purposes only and does not constitute financial advice.
Trading involves risk—always conduct your own analysis.
I am not responsible for any decisions or losses based on this material.

Why Central Banks Buy Gold — The Ultimate Asset of PowerWhen a central bank decides to buy gold, it is not simply adding another metal to its reserves. It is reinforcing the foundation of national financial power — a form of strength that does not rely on promises, carries no debt obligation, and cannot be manipulated by any superpower. In a modern financial system where nearly every asset represents someone else’s liability — from U.S. Treasuries to fiat currencies like USD or EUR — gold stands apart. It is not anyone’s debt, is immune to political influence, and cannot be printed. This absolute independence makes gold the ultimate anchor of national trust.
Gold carries a dual nature: it is both a durable financial asset and a geopolitical instrument. It protects national wealth in ways fiat currencies cannot. A country with substantial gold reserves possesses a shield for its currency, reducing vulnerability to exchange-rate shocks and enhancing stability during global cycles of volatility. History has repeatedly confirmed this pattern: during major inflationary periods — from 2008–2011, through the 2020 pandemic peak, to the inflation surge of 2022 — gold followed the same rule. When money lost value, gold rose. When central banks expanded money supply, gold became the final line of defense.
On the geopolitical level, gold’s role is even more pronounced. It does not depend on the U.S. dollar system, does not require SWIFT for settlement, and—most importantly—cannot be frozen like foreign exchange reserves. In an increasingly polarized world, gold has become the safest asset a nation can hold: silent power, yet profoundly real.
Central banks do not buy gold like retail investors. They accumulate it gradually and strategically over long periods, quietly, without disturbing prices or signaling intentions. Within reserve structures, gold sits alongside USD and U.S. Treasuries as a three-pillar framework: gold for systemic risk protection, USD for liquidity, and bonds for yield. In times of crisis, gold becomes an “activation asset” — sold to obtain USD, defend the exchange rate, stabilize confidence, and prevent currency collapse. This logic also explains the accelerating trend of de-dollarization across Asia, the Middle East, and especially the BRICS bloc.
Real-world examples reinforce gold’s role. China has consistently increased gold reserves from 2019 to 2025, according to PBoC disclosures, aiming to reduce USD dependence and strengthen the renminbi amid rising trade tensions. Russia provides the clearest case: after sanctions in 2022 froze most USD and EUR assets, gold remained untouched — serving as Russia’s financial immune system. In Turkey, when inflation surged to 60–80% between 2021 and 2023, the central bank expanded gold reserves to stabilize confidence in the lira — a strategy acknowledged in IMF surveillance reports.
The 2023–2025 period has revealed an undeniable truth: in a world marked by high inflation, a strong dollar, geopolitical conflict, and global recession risks, countries with large gold reserves — such as China, Russia, and India — maintained relative stability, while nations with weaker reserves struggled with currency crises, external debt, and inflation. When everything else depends on trust, gold depends on nature — and that is why it remains a pillar of national power even in the 21st century.

How to Use Chart Patterns in a High-Probability Way Tutorial #1In this tutorial, I explain how to use chart patterns in a structured and high-probability way, focusing on confirmation, market logic, and clean execution.
WHAT IS A CHART PATTERN?
A chart pattern is a visual representation of price behavior that forms due to market psychology, supply and demand, and repeated trader reactions.
Chart patterns help identify potential continuations or reversals when confirmed correctly.
CHART PATTERNS COVERED IN THIS TUTORIAL
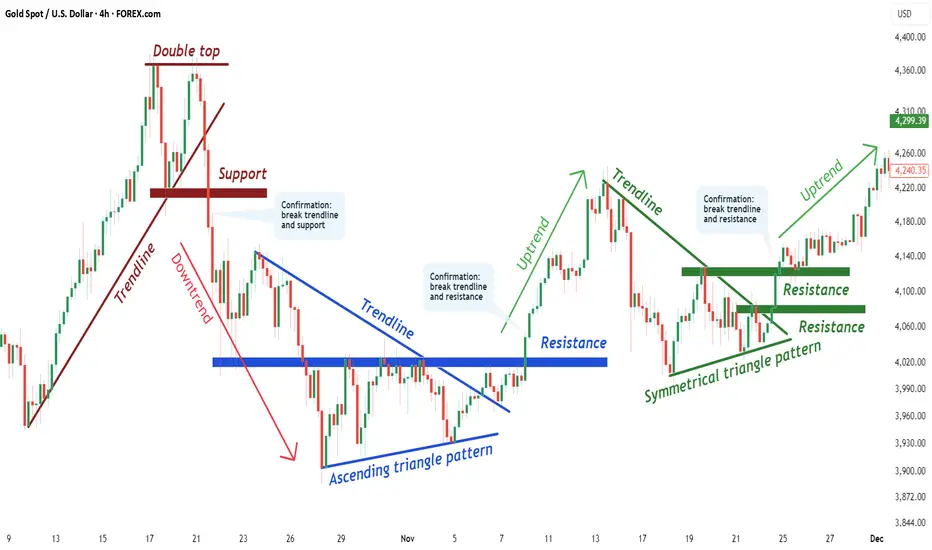
1.) Double Top
2.) Ascending Triangle Pattern
3.) Symmetrical Triangle Pattern
WHAT IS A DOUBLE TOP?
A Double Top is a bearish reversal pattern formed after an uptrend.
Price fails to break a resistance level twice, signaling buyer exhaustion and a potential shift in control from buyers to sellers.
WHAT IS AN ASCENDING TRIANGLE PATTERN?
An Ascending Triangle is a bullish continuation pattern characterized by higher lows pressing against a flat resistance level.
It reflects increasing buyer strength and often leads to a breakout once resistance is broken with confirmation.
WHAT IS A SYMMETRICAL TRIANGLE PATTERN?
A Symmetrical Triangle represents consolidation, where higher lows and lower highs compress price action.
The breakout direction defines the next impulsive move once volatility expands.
GENERAL STEP-BY-STEP PROCESS
1.) Identify the chart pattern on the chart
(Unconfirmed structure forming)
2.) Draw the key trendlines and neckline
(Support and resistance define structure validity)
3.) Wait for a break of BOTH the trendline and the neckline
(This confirms the chart pattern)
4.) Move to a lower timeframe and look for an entry
(Trade in the direction of the confirmed breakout using clean price action)
If you want PART 2 , leave a like and a comment.
Follow for high-quality trading education and clean technical logic.
DISCLAIMER
This content is for educational purposes only and does not constitute financial advice.
Trading involves risk. Always conduct your own analysis.
I am not responsible for any decisions or losses based on this material.
The Crypto Money Flow CycleThe capital rotation cycle in the crypto market is not a theoretical concept, but a phenomenon that has repeated itself across multiple growth cycles. It reflects the natural behavior of capital flows: starting from the safest assets, then gradually spreading to higher-volatility instruments as confidence and risk appetite increase. Typically, capital first flows into Bitcoin — the foundational asset and “anchor” of the entire market — before rotating into Ethereum, a core ecosystem that consistently attracts strong inflows once market conditions stabilize.
When these two pillars begin to slow down, capital expands into large-cap altcoins, then accelerates into meme coins, and ultimately ends in the riskiest assets such as shitcoins. This is the point at which the market reaches peak heat: potential returns are enormous, but risk is also at its highest level.
If Bitcoin is the main river, Ethereum represents the major tributaries, altcoins are the canal system, and meme coins and shitcoins are the stagnant waters at the very end of the flow — the murkiest area, but also the place where many investors are most likely to “drown.” The imagery may sound harsh, but it accurately captures the market’s nature: the higher the potential return, the greater the downside, and near the end of the cycle, even a small variable can push the entire structure into chaos.
Understanding this cycle not only helps investors identify where the market currently stands, but also supports more rational capital allocation decisions. When capital is still concentrated in BTC and ETH, rushing into shitcoins offers little advantage and only increases the risk of capital loss. Conversely, when the market enters its euphoric phase, FOMO often overrides logic: newcomers rush in just as smart money is preparing to exit. Recognizing the cycle helps avoid these traps. It also explains the common frustration of “the coin I hold goes nowhere while others keep pumping,” because you understand where capital is flowing instead of investing based on emotion.
To accurately identify the market’s position within the cycle, it is essential to observe behavior at each stage. When BTC rallies strongly and BTC Dominance rises, capital is in the early phase. This is the time to focus on Bitcoin and avoid smaller altcoins, as they usually underperform when dominance expands. When Bitcoin starts to slow down, moving sideways or correcting slightly while the ETH/BTC pair trends steadily higher, capital is rotating into Ethereum. This phase often favors increasing exposure to ETH.
When both BTC and ETH stall, the market enters Altcoin Season. Altcoins with solid fundamentals, mid-to-large market capitalizations, and clear narratives become the primary destinations for capital. This is when Layer-1, Layer-2, DeFi, AI, and RWA sectors tend to perform strongly. However, this is still not the right time to dive into meme coins and shitcoins, as the market remains in the “mid-cycle” phase, where performance belongs to fundamentally backed assets rather than purely speculative tokens.
The final — and most dangerous — stage is when meme coins and shitcoins explode. The clearest signs are social media being flooded with x20, x50, or x100 stories and near-vertical price charts detached from any real product or utility. This is when smart money gradually exits, leaving the stage to new participants driven by euphoria. If participation is unavoidable, only a very small portion of capital should be allocated, with a mindset of “fast in, fast out,” because risk in this environment can materialize within hours.
To navigate the full cycle effectively, several indicators should be monitored consistently. BTC Dominance reveals whether the market is prioritizing safety or expanding toward risk. Market capitalization and liquidity determine both upside potential and downside resilience. Finally, the risk-on/risk-off environment clearly reflects investors’ willingness to take risk. When the market shifts to risk-on, altcoins and meme coins tend to surge; when it turns risk-off, capital typically flows back into BTC or stablecoins for defense.

Surviving this market for 10 years taught me thisI’ve been trading this market for over 10 years.
In the beginning, all I cared about was how much I could make.
That’s what most people focus on.
What I learned the hard way is this:
If the account doesn’t survive, nothing else matters.
No funds means no next trade.
No next trade means no edge, no learning, no comeback.
There were long periods where I wasn’t making money.
But I was protecting my ability to stay in the game.
That mattered more than being right.
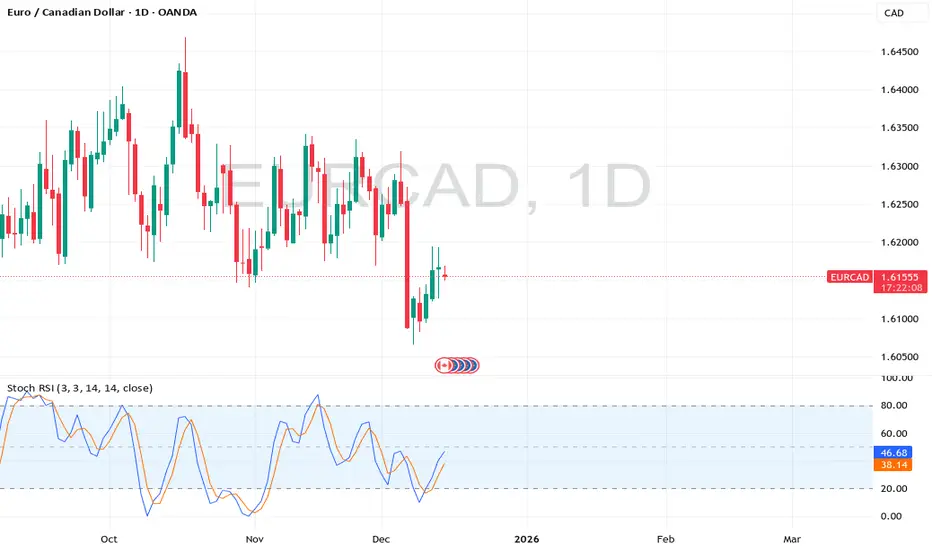
This chart isn’t about profits.
It’s about still being here.

Emergency Update #1 Dont Short this one The reason is because the signal has reversed i feel
so sad because i was hoping i found a good top
to Short this one but the signal
has reversed because the bulls
have won the fight
this means the crowd has won..
So even if we was against the crowd the crowd has
won
If you where short exit this trade immediate.
Rocket boost this content to learn more
Disclaimer: Trading is risky please use a simulation trading account
before you trade with real money.
How to Use S & R in a High-Probability Way | Tutorial #1❓ What is Support & Resistance?
Support and Resistance are key price levels where the market has previously shown strong reactions, often leading to reversals, pauses, or continuations.
🧩 Key Traits of High-Quality Support & Resistance
✔ Multiple rejections ( minimum 2 , more is better)
✔ Level has acted as both support and resistance
✔ Recently respected by price (close to the left structure)
✔ Recently formed level (fresh in market memory)
✔ Strong and impulsive move away from the level
✔ Very obvious level (can be spotted within seconds)
📌 Note:
Not all traits are required.
The more traits align, the higher the probability.
⚠️ Important
Support & Resistance alone is not enough .
High-probability setups come from combining S&R with:
🕯 Candlestick confirmation
🧠 Area of confluence
📐 Chart patterns
⏱ Multi-timeframe alignment
📊 Other high-quality technical factors
👍 Want PART 2?
Leave a like and a comment below.
📈 Follow for high-quality trading education and clean technical logic.
⚠️ DISCLAIMER
This content is for educational purposes only and does not constitute financial advice.
Trading involves risk—always conduct your own analysis.
I am not responsible for any decisions or losses based on this material.

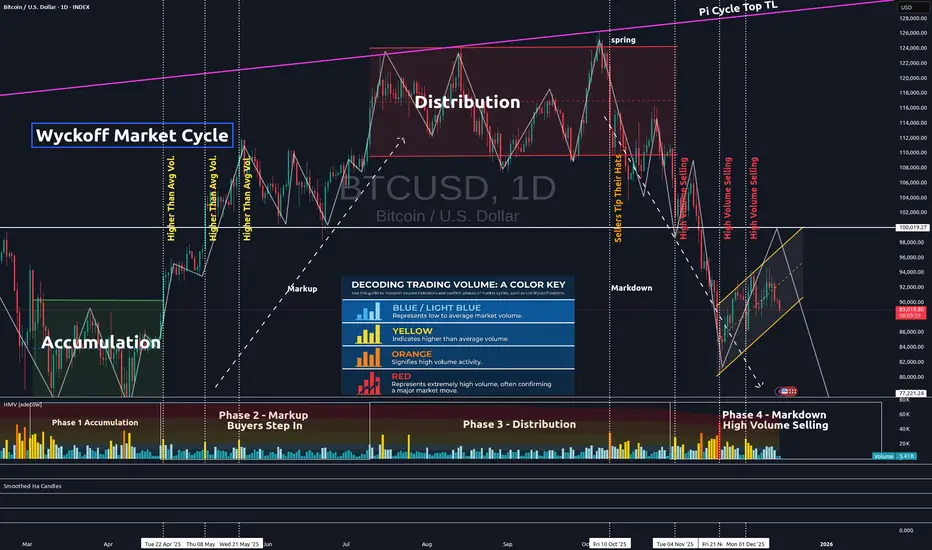
Confirming Chart Patterns With VolumeIn the chart above, one can clearly recognize the Wyckoff Market Cycle pattern. The pattern's legitimacy can be confirmed by volume. The volume is represented in the lower portion of the chart.
Low to average volume candles are blue. Average volume is indicated by light blue candles. Yellow candles represent higher than average volume. Orange is high volume. And red represents extremely high volume.
You will see each phase of the Wyckoff Market Cycle pattern confirmed by this volume on our current Bitcoin chart.
First, the market enters the accumulation phase. Market volume is fairly high, as seen in the accumulation quadrant in the lower left on the chart. However, it is important to note that there is an equal distribution of high-volume selling days as there are high-volume buying days. Thus, price tends to trend sideways within the channel until the true buying power comes into action.
Next, the buyers step in and take the price higher. This is generally indicated by a high-volume day when the price breaks above the accumulation channel. When buyers step in, most of the yellow and orange volume candles are, in fact, buyers in the markup phase. You can verify this is true by lining these higher-than-average volume candles up with the green price candles on the Bitcoin chart. This indicates the markup phase has begun and is underway.
Then, we come to the distribution phase on our chart. Notice the volume in that 3rd quadrant, the distribution quadrant. It is mostly average volume. Institutional sellers are attempting to carefully exit quietly. But you can also see that near the end of the distribution phase, sellers are starting to step in, tipping their hats and indicating that the distribution phase is about to end.
Finally, sellers take back full control, dropping us from the distribution channel altogether. High volume selling confirms this move and the pattern. The final quadrant in the bottom right proves that mostly sellers have control, as the majority of higher volume candles (yellow, orange, and red) are credited to the sellers.
Our Wyckoff Market Cycle pattern is now confirmed, and further selling can be expected until volume is once again taken back by the buyers. One will need to see clearly that high-volume candles are in line with green price candles. In this chart, that is not yet the case. Thus, more selling should be expected until it is clearly evident that buyer command control once again.
Hope you found this brief educational write-up informative and helpful, as volume can often be utilized in many uncertain pattern formations to find pattern legitimacy and confirmation.
✌️Stew
Investing in Gold: A Comprehensive Analysis1. Why Invest in Gold?
Gold offers several compelling reasons for investment. Primarily, it acts as a hedge against inflation. During periods when the purchasing power of fiat currencies declines, gold prices generally rise, preserving wealth. For example, during the 1970s, the US experienced high inflation, and gold prices surged dramatically.
Additionally, gold provides protection during economic and geopolitical uncertainty. In times of financial crises, such as the 2008 global recession, investors flocked to gold as a safe-haven asset. Gold is not tied to any single country’s economy, making it a globally recognized store of value.
Diversification is another key reason. Financial advisors often suggest including gold in an investment portfolio to reduce overall risk. Unlike stocks or bonds, gold has a low or negative correlation with other asset classes, which means its value can remain stable or even rise when other investments falter.
2. Forms of Gold Investment
Investors can access gold through various channels, each with unique advantages and considerations:
Physical Gold: This includes gold bars, coins, and jewelry. Physical gold provides tangible ownership and a psychological sense of security. However, it requires safe storage and insurance, and liquidity can sometimes be a concern.
Gold ETFs (Exchange-Traded Funds): These funds track gold prices and are traded on stock exchanges. They offer a convenient and liquid way to invest without dealing with physical gold. They typically have lower transaction costs compared to buying physical gold.
Gold Mutual Funds: These invest in gold mining companies or gold-related assets. They offer exposure to gold without owning it directly and can generate returns through dividends and capital appreciation.
Gold Futures and Options: These are derivatives that allow investors to speculate on future gold prices. They can provide significant leverage but carry high risk, making them suitable only for experienced investors.
Digital Gold: This is a modern form of investment where investors can buy gold online in small quantities. It offers convenience and security without the need for physical storage.
3. Factors Influencing Gold Prices
Gold prices are influenced by a combination of macroeconomic, geopolitical, and market-specific factors. Understanding these drivers can help investors make informed decisions:
Inflation and Interest Rates: Gold is often inversely related to interest rates. When real interest rates (adjusted for inflation) are low or negative, gold becomes more attractive, driving up prices.
Currency Movements: Gold is priced in US dollars globally. A weaker dollar makes gold cheaper for other currency holders, often increasing demand. Conversely, a stronger dollar can suppress gold prices.
Geopolitical Risks: Wars, conflicts, and political instability can increase demand for gold as a safe-haven asset.
Central Bank Policies: Central banks around the world hold significant gold reserves. Changes in their buying or selling behavior can impact global prices.
Supply and Demand: Gold mining production, recycling, and industrial demand (especially in jewelry and technology) influence supply and demand dynamics.
4. Benefits of Investing in Gold
Investing in gold provides multiple advantages:
Wealth Preservation: Gold has historically maintained its value over centuries, protecting investors from currency depreciation and economic downturns.
Portfolio Diversification: It reduces overall portfolio risk due to its low correlation with stocks and bonds.
Liquidity: Gold is globally recognized and can be quickly sold or exchanged for cash in most markets.
Inflation Hedge: Gold tends to retain purchasing power during periods of rising prices.
Safe Haven During Crises: It is considered a stable investment during financial and geopolitical turmoil.
5. Risks of Investing in Gold
Despite its advantages, gold investment carries certain risks:
Price Volatility: Although gold is less volatile than stocks, it can still experience short-term price fluctuations due to market sentiment or speculative activity.
No Income Generation: Unlike stocks or bonds, gold does not provide dividends or interest. Returns depend solely on price appreciation.
Storage and Security Concerns: Physical gold requires secure storage and insurance, which can incur additional costs.
Market Timing Risk: Buying gold at a peak can result in temporary losses if prices decline before an investor exits.
6. Strategies for Investing in Gold
Successful gold investment requires careful planning and strategy:
Long-Term Investment: Investors seeking stability can buy and hold gold for the long term to hedge against inflation and economic uncertainty.
Diversification: Allocate a portion of the portfolio to gold alongside equities, bonds, and real estate to balance risk. Many advisors recommend 5–15% of a portfolio in gold.
Dollar-Cost Averaging: Buying gold in regular intervals, regardless of price, can mitigate the impact of short-term volatility.
Monitoring Macroeconomic Trends: Keeping track of inflation rates, interest rates, currency movements, and geopolitical events can help in timing investments.
Combining Physical and Paper Gold: A combination of physical gold for security and ETFs or mutual funds for liquidity can optimize returns while managing risks.
7. Conclusion
Gold remains a timeless investment vehicle with unique advantages. It offers protection against inflation, acts as a hedge during economic and geopolitical instability, and provides diversification to investment portfolios. While gold does not generate income, its long-term value preservation and liquidity make it a preferred choice for conservative investors. Understanding the forms of gold investment, factors influencing its price, and implementing strategic approaches can help investors leverage gold effectively for wealth protection and growth.
Whether through physical ownership, digital platforms, or financial instruments, gold remains an essential component of a balanced investment strategy. By carefully assessing individual financial goals, risk tolerance, and market conditions, investors can harness the enduring appeal of gold to safeguard and grow their wealth.
World Finance Rating Agencies: An OverviewHistorical Background
The concept of credit ratings originated in the early 20th century. The first formal credit rating agencies were Moody’s (founded in 1909) and Standard & Poor’s (S&P) (with origins in 1860, evolving into S&P in 1941). Fitch Ratings, founded in 1913, also became a major player in the credit rating industry.
Initially, these agencies focused on rating bonds and fixed-income instruments in the United States. Over time, their operations expanded globally, covering sovereign nations, multinational corporations, structured finance products, and emerging markets. Today, the "Big Three"—Moody’s, S&P, and Fitch—dominate global credit ratings, collectively controlling roughly 95% of the market.
Purpose and Function
Financial rating agencies serve several critical functions in global finance:
Credit Risk Assessment: Agencies evaluate the likelihood that a borrower will default on obligations. Ratings range from high-grade (low risk) to junk (high risk), providing a snapshot of credit quality.
Investor Guidance: Investors, particularly institutional ones, use ratings to make informed investment decisions. Many funds and pension plans have policies restricting investments to certain rating thresholds.
Market Efficiency: Ratings reduce information asymmetry between borrowers and lenders. Investors can quickly gauge risk without conducting extensive internal research.
Regulatory Role: Financial regulators often incorporate ratings into capital adequacy rules. Banks, insurance companies, and investment funds may need higher capital reserves when investing in lower-rated securities.
Benchmarking and Pricing: Ratings influence borrowing costs. Higher-rated entities enjoy lower interest rates, while lower-rated issuers pay a premium for risk.
Types of Ratings
Financial rating agencies provide different types of ratings, depending on the instrument or entity being assessed:
Sovereign Ratings: Assess a country's ability and willingness to repay debt. These ratings impact government bond yields and influence foreign investment flows. Examples: U.S. AAA rating by S&P or India’s BBB- rating by Fitch.
Corporate Ratings: Evaluate corporations’ creditworthiness, often for bonds or long-term loans. These ratings reflect financial health, debt structure, profitability, and operational stability.
Structured Finance Ratings: Include mortgage-backed securities (MBS), collateralized debt obligations (CDOs), and asset-backed securities (ABS). These complex instruments require detailed risk modeling.
Municipal Ratings: Cover local government entities or projects, particularly in the U.S., affecting municipal bond markets.
Short-Term Ratings: Assess liquidity and ability to meet short-term obligations, often for commercial paper and money market instruments.
Rating Methodologies
Agencies use a mix of quantitative and qualitative methods to assign ratings. Key factors include:
Financial Ratios: Debt-to-equity ratio, interest coverage ratio, profitability, and liquidity.
Economic Environment: Macro conditions, inflation rates, currency stability, and economic growth.
Political Stability: For sovereign ratings, political risk, governance, and regulatory frameworks are crucial.
Industry Analysis: Sectoral trends, competition, and market dynamics.
Management Quality: Corporate governance, strategy, and operational competence.
The resulting rating is expressed as a letter grade. For example, S&P uses AAA (highest quality) to D (default), with intermediate grades like AA+, BBB-, etc. Moody’s uses a numeric system combined with letters (e.g., A1, Baa3).
Global Influence of Rating Agencies
Credit rating agencies have a profound impact on global finance:
Capital Flow Direction: Sovereign ratings influence foreign investment, with higher-rated countries attracting more capital.
Interest Rates and Borrowing Costs: Ratings directly affect yields on bonds and the cost of capital.
Financial Market Stability: Ratings changes can trigger large-scale portfolio reallocations, influencing stock and bond markets worldwide.
Emerging Markets: Agencies heavily affect emerging economies, where a downgrade can sharply increase debt servicing costs and reduce investor confidence.
Criticism and Controversies
Despite their significance, rating agencies have faced substantial criticism:
Conflict of Interest: Agencies are paid by the issuers they rate, creating potential bias. For example, during the 2008 financial crisis, they rated many subprime mortgage-backed securities as AAA, later revealed to be extremely risky.
Procyclicality: Ratings can amplify financial cycles. Downgrades during crises may force asset sales, worsening liquidity problems.
Opaque Methodologies: The complexity and lack of transparency in rating models, especially for structured finance products, make it difficult for external stakeholders to assess validity.
Regulatory Overreliance: Banks and investors often rely heavily on ratings for compliance, sometimes ignoring independent analysis, which can exacerbate financial instability.
Market Concentration: The dominance of the Big Three limits competition, potentially reducing innovation and accuracy in risk assessment.
Reforms and Modern Trends
In response to criticism, rating agencies have evolved:
Increased Transparency: Agencies now publish methodologies, criteria, and assumptions used in ratings.
Regulatory Oversight: Post-2008 reforms, such as the Dodd-Frank Act in the U.S. and EU regulation, increased oversight to reduce conflicts of interest.
Emergence of Alternatives: New players like DBRS Morningstar, Scope Ratings, and China Chengxin provide alternatives to the Big Three.
Integration of ESG Factors: Many agencies now incorporate environmental, social, and governance (ESG) metrics, reflecting long-term sustainability risks.
Technology and Big Data: Advanced analytics, machine learning, and real-time data improve predictive accuracy for ratings.
Regional and Global Perspectives
United States: The U.S. remains the center of rating agency operations, with S&P, Moody’s, and Fitch headquartered there. U.S. ratings influence global capital markets due to the dollar’s reserve currency status.
Europe: European regulators have attempted to encourage competition, with agencies like Scope Ratings (Germany) and Creditreform Rating gaining traction.
Asia: Emerging economies like China, India, and Japan have local agencies (e.g., China Chengxin, CRISIL, Japan Credit Rating Agency) to supplement international ratings.
Global Coordination: International bodies like the International Organization of Securities Commissions (IOSCO) set principles for credit rating agencies to enhance reliability and transparency globally.
Conclusion
World finance rating agencies play a critical role in shaping global financial markets. Their ratings guide investor behavior, influence borrowing costs, and contribute to market efficiency. However, their dominance and occasional lapses in judgment highlight the need for careful oversight, transparency, and the integration of alternative perspectives. The evolution toward ESG considerations, technological adoption, and regional diversification suggests that rating agencies will continue to adapt to the complex demands of modern global finance.
While their influence is undeniable, investors and policymakers must balance reliance on ratings with independent analysis and prudent risk management. The interplay between these agencies, global capital markets, and regulatory frameworks ensures that they will remain central players in international finance for decades to come.

The Crypto Market: Bitcoin, Ethereum, and Stablecoins1. Bitcoin: The Pioneer and Digital Gold
Bitcoin, launched in 2009 by the pseudonymous Satoshi Nakamoto, was the first cryptocurrency and remains the most well-known and widely adopted digital asset. It operates on a decentralized peer-to-peer network using blockchain technology, a public ledger that records all transactions transparently and immutably. Bitcoin’s primary innovation lies in its ability to facilitate trustless transactions without intermediaries such as banks or payment processors.
Key Features of Bitcoin:
Limited Supply: Bitcoin has a capped supply of 21 million coins, which introduces scarcity, making it often referred to as “digital gold.” This scarcity underpins its appeal as a store of value, particularly during periods of fiat currency inflation.
Decentralization: Bitcoin operates on a network of nodes worldwide. Its security and consensus mechanism, proof-of-work (PoW), ensures that no single entity controls the network, making it resistant to censorship and manipulation.
Market Influence: Bitcoin often sets the tone for the broader crypto market. Price movements in BTC frequently influence altcoins and overall market sentiment.
Investment Appeal: Many investors view Bitcoin as a hedge against traditional financial market volatility. Institutional interest, including purchases by corporate treasuries and ETFs, has strengthened its legitimacy as an asset class.
Despite its strengths, Bitcoin faces challenges such as energy-intensive mining, scalability issues, and high price volatility. Nevertheless, it remains a cornerstone of the crypto market and a key driver of adoption.
2. Ethereum: Beyond Currency to Smart Contracts
Ethereum, introduced in 2015 by Vitalik Buterin, expanded the concept of cryptocurrency by introducing programmable blockchain functionality through smart contracts. While Bitcoin primarily serves as digital money, Ethereum provides a decentralized platform for developers to create decentralized applications (dApps) and tokens.
Key Features of Ethereum:
Smart Contracts: Ethereum enables self-executing contracts coded on the blockchain. These contracts automatically enforce the terms of agreements, reducing the need for intermediaries and enhancing transparency.
Decentralized Finance (DeFi): Ethereum has become the backbone of the DeFi ecosystem, hosting platforms that offer lending, borrowing, yield farming, and decentralized exchanges. This innovation allows individuals to access financial services without relying on traditional banks.
ERC-20 and Tokenization: Ethereum’s ERC-20 standard has facilitated the creation of numerous tokens, including stablecoins, utility tokens, and governance tokens. This tokenization has broadened the crypto ecosystem and investment opportunities.
Ethereum 2.0 and Proof-of-Stake: The transition from proof-of-work to proof-of-stake (PoS) via Ethereum 2.0 aims to address energy consumption and scalability issues, improving transaction speeds and network sustainability.
Ethereum’s flexibility and technological innovation have made it the second-largest cryptocurrency by market capitalization. It also plays a critical role in the broader crypto ecosystem by powering DeFi, NFTs, and enterprise blockchain solutions.
3. Stablecoins: Bridging Crypto and Traditional Finance
Stablecoins are digital assets designed to maintain a stable value, usually pegged to fiat currencies such as the U.S. dollar. Unlike Bitcoin and Ethereum, stablecoins are not primarily intended as speculative investments but as mediums of exchange, liquidity instruments, and hedges against volatility. Examples include Tether (USDT), USD Coin (USDC), and Binance USD (BUSD).
Key Features of Stablecoins:
Price Stability: By pegging their value to stable assets, stablecoins mitigate the extreme volatility seen in cryptocurrencies like BTC and ETH, making them suitable for payments, remittances, and trading.
Utility in Crypto Markets: Traders often use stablecoins to enter or exit positions without converting to fiat currency. They provide liquidity across exchanges and facilitate decentralized finance activities.
Types of Stablecoins:
Fiat-collateralized: Backed 1:1 by fiat reserves (e.g., USDC, USDT).
Crypto-collateralized: Backed by other cryptocurrencies held in smart contracts (e.g., DAI).
Algorithmic: Value maintained through algorithms and smart contracts without direct collateral (e.g., TerraUSD before its collapse).
Risks and Regulatory Attention: Despite their stability, stablecoins carry risks, including reserve transparency, regulatory scrutiny, and the potential for de-pegging in stressed market conditions. Regulators worldwide are increasingly focusing on stablecoin issuance and management to ensure financial stability.
Stablecoins serve as a bridge between traditional finance and crypto markets, enabling fast, low-cost, and borderless transactions, which enhance crypto adoption in real-world applications.
4. Market Dynamics and Interconnections
The crypto market is interconnected, with Bitcoin, Ethereum, and stablecoins each influencing market behavior differently. Bitcoin’s dominance often dictates overall market sentiment, while Ethereum drives innovation and new market segments, particularly DeFi and NFTs. Stablecoins provide liquidity and stability, acting as a buffer during periods of market volatility.
Market Drivers:
Institutional Participation: Increasing interest from hedge funds, asset managers, and corporations has introduced liquidity and legitimacy, particularly in Bitcoin and Ethereum.
Regulatory Environment: Policy decisions impact crypto prices, adoption, and innovation. Countries with clear crypto regulations foster growth, while regulatory uncertainty can trigger volatility.
Technological Innovation: Upgrades such as Ethereum 2.0, layer-2 scaling solutions, and Bitcoin’s Lightning Network enhance usability and adoption.
Global Macroeconomic Factors: Inflation, interest rates, and geopolitical events influence crypto markets similarly to traditional assets, but the decentralized nature of cryptocurrencies often creates unique correlations and behaviors.
5. Risks and Considerations
While cryptocurrencies offer high returns and innovation, they also carry significant risks:
Volatility: Prices can fluctuate dramatically in short periods, impacting investments and trading strategies.
Regulatory Uncertainty: Governments are actively formulating policies to address taxation, securities laws, and stablecoin usage.
Security Risks: Hacks, scams, and smart contract vulnerabilities pose substantial threats to investors and platforms.
Market Manipulation: Large holders, known as whales, can influence prices, particularly in low-liquidity markets.
Environmental Concerns: Energy-intensive PoW networks like Bitcoin have raised environmental sustainability questions.
Understanding these risks is essential for informed participation and risk management in the crypto market.
6. Future Outlook
The future of the crypto market is promising yet uncertain. Key trends shaping the next phase include:
Integration with Traditional Finance: Cryptocurrencies and blockchain-based financial services are increasingly integrated with banks, payment providers, and investment platforms.
Decentralized Finance Expansion: Ethereum and other smart-contract platforms are expected to drive further DeFi adoption, enhancing financial inclusion.
Central Bank Digital Currencies (CBDCs): Governments exploring digital currencies may coexist or compete with stablecoins, influencing the market structure.
Technological Advancements: Layer-2 solutions, sharding, and interoperability protocols may improve scalability, reduce fees, and enhance user experience.
Institutional Adoption: Continued involvement of institutional investors may stabilize markets and provide legitimacy, driving wider adoption.
The evolution of Bitcoin, Ethereum, and stablecoins indicates a maturing market that balances speculative potential with practical financial applications.
Conclusion
The cryptocurrency market, anchored by Bitcoin, Ethereum, and stablecoins, represents a transformative shift in global finance. Bitcoin provides a decentralized store of value, Ethereum enables programmable finance and smart contracts, and stablecoins bridge traditional finance and the crypto world. While the market offers substantial opportunities, it also carries risks from volatility, regulation, and technology.
Understanding these three pillars of crypto is essential for navigating the market’s complexities, fostering adoption, and leveraging the innovations that cryptocurrencies bring to the global financial landscape. The interplay between these assets continues to shape the evolution of digital finance, reflecting both the opportunities and challenges of a decentralized financial future.

Understanding Global Governance and Strategic Decision-MakingThe Scope and Importance of International Policy Analysis
The importance of international policy analysis has grown significantly in the 21st century due to globalization, technological advancements, and complex interdependence among states. Policies addressing climate change, trade, health crises, cybersecurity, and conflict resolution have far-reaching consequences that transcend national boundaries. Analysts in this field aim to evaluate not only the effectiveness of policies but also their ethical, political, economic, and social implications.
International policy analysis provides policymakers and stakeholders with evidence-based insights that inform decision-making. It facilitates the identification of potential risks, benefits, and trade-offs associated with different policy options. In an increasingly interconnected world, where actions in one country can ripple globally, the role of international policy analysis is indispensable for promoting cooperation, reducing conflicts, and fostering sustainable development.
Key Theoretical Approaches
Several theoretical frameworks guide international policy analysis, providing structured ways to interpret complex global interactions:
Realism: Rooted in political science, realism emphasizes the pursuit of national interest and power in an anarchic international system. Policy analysts using this approach focus on how states prioritize security, military strength, and strategic alliances. Realism is often applied in analyzing defense, security, and geopolitical policies.
Liberalism: Liberal theories highlight cooperation, institutions, and the role of international law. From this perspective, policy analysis examines how international organizations, treaties, and multilateral agreements influence global outcomes. Liberalism is particularly relevant in trade policy, human rights, and environmental governance.
Constructivism: Constructivist approaches stress the importance of ideas, norms, and identities. Analysts study how perceptions, cultural factors, and social norms shape policy decisions, highlighting that international relations are not merely dictated by material interests but also by shared understandings.
Critical and Postcolonial Theories: These approaches challenge mainstream perspectives, focusing on power imbalances, historical legacies, and structural inequalities. They analyze how global policies can perpetuate economic or political dominance and often emphasize marginalized voices in global governance.
Methodologies in International Policy Analysis
International policy analysis employs a wide range of methodologies to assess policy effectiveness and implications:
Qualitative Analysis: This involves the study of policy documents, treaties, speeches, and case studies. Interviews with policymakers and experts provide insights into decision-making processes and political dynamics. Qualitative approaches are essential for understanding the motivations, ideologies, and negotiations behind international policies.
Quantitative Analysis: Analysts use statistical models, economic indicators, and large datasets to evaluate the outcomes of international policies. Quantitative approaches are particularly useful for assessing trade agreements, development aid effectiveness, and economic sanctions.
Comparative Analysis: By comparing policies across different countries or regions, analysts can identify best practices, common challenges, and potential solutions. Comparative studies help in understanding how varying political, economic, and cultural contexts influence policy outcomes.
Scenario and Risk Analysis: This method projects potential future developments, assessing how current policies might perform under different global conditions. It is crucial for long-term planning in areas such as climate change, security threats, and technological advancements.
Key Areas of Focus
Global Security and Defense Policy: Analysts examine issues like conflict prevention, peacekeeping, arms control, and counterterrorism. Understanding how states and international organizations manage security threats helps in designing effective policies that minimize the risk of conflict.
International Trade and Economic Policy: Trade agreements, tariffs, foreign investment regulations, and economic sanctions are central to global economic governance. Policy analysis evaluates the impacts of these measures on economic growth, employment, inequality, and global markets.
Environmental and Climate Policy: Climate change is a global challenge requiring coordinated policy responses. Analysts assess international treaties like the Paris Agreement, evaluate the effectiveness of carbon reduction strategies, and explore the economic and social implications of environmental policies.
Global Health Policy: International policy analysis in health examines responses to pandemics, access to vaccines, and global health governance structures. Effective health policies require coordination between national governments, the World Health Organization, and other global health actors.
Human Rights and Social Policy: Policies addressing human rights, migration, and humanitarian aid are evaluated to ensure compliance with international law and ethical standards. Analysis identifies gaps, implementation challenges, and the role of civil society in influencing policy outcomes.
Challenges in International Policy Analysis
Analyzing international policy presents unique challenges due to the complexity of global governance:
Diverse Stakeholders: International policies often involve multiple actors with conflicting interests. Balancing these interests requires careful negotiation and strategic compromise.
Data Limitations: Access to reliable and timely data across countries can be challenging. Analysts must often work with incomplete or biased information.
Dynamic Global Context: International relations are fluid, influenced by economic shifts, technological change, and geopolitical tensions. Analysts must adapt their frameworks to account for rapid developments.
Cultural and Normative Differences: Policies may have varying impacts in different cultural contexts, making universal policy prescriptions difficult.
Impact and Applications
International policy analysis plays a pivotal role in shaping global governance. It informs the strategies of governments, international organizations, and NGOs, guiding decisions in diplomacy, trade, security, and development. By identifying unintended consequences and proposing evidence-based alternatives, analysts contribute to more effective and ethical policymaking.
Furthermore, international policy analysis fosters collaboration across borders. It helps build consensus on pressing global issues like climate change, human trafficking, and financial crises. By integrating insights from multiple disciplines, including economics, political science, sociology, and law, analysts provide comprehensive solutions that address both immediate challenges and long-term goals.
Conclusion
International policy analysis is an essential field in a world characterized by interconnectedness and complexity. It equips decision-makers with the knowledge and tools to navigate global challenges, promoting cooperation, stability, and sustainable development. By combining theoretical frameworks, methodological rigor, and practical insights, international policy analysis enhances our understanding of global governance and contributes to the creation of policies that are equitable, effective, and forward-looking.
In an era of global crises—from pandemics and climate change to geopolitical conflicts—international policy analysis is not just an academic exercise; it is a vital instrument for shaping a more secure, just, and prosperous world.

Risk Psychology and Performance in Global Markets1. Defining Risk Psychology
Risk psychology, sometimes referred to as behavioral finance, examines how emotions, cognitive biases, and mental frameworks shape perceptions of risk and influence decision-making. Traditional economic theory assumes that market participants are rational actors who always make decisions based on complete information and logical analysis. However, decades of research, particularly by psychologists like Daniel Kahneman and Amos Tversky, have shown that human behavior often deviates from rationality. Traders may overreact to news, underestimate the probability of rare events, or follow herd behavior—actions that directly impact performance in global markets.
Risk psychology can be divided into several key dimensions:
Risk Perception: How individuals interpret and assess potential losses and gains.
Risk Tolerance: The degree to which an individual or organization is willing to accept uncertainty or potential financial loss.
Cognitive Biases: Systematic errors in thinking, such as overconfidence, anchoring, or confirmation bias.
Emotional Responses: Reactions such as fear, greed, panic, or euphoria that can override logical decision-making.
2. Cognitive Biases and Market Behavior
One of the central insights from risk psychology is that cognitive biases can significantly distort market performance. Some of the most influential biases include:
Overconfidence: Traders often overestimate their knowledge or forecasting ability, leading to excessive risk-taking or frequent trading. In global markets, overconfident investors may underestimate geopolitical risks or macroeconomic uncertainties, which can result in large losses.
Loss Aversion: This is the tendency to weigh potential losses more heavily than equivalent gains. In volatile markets, loss-averse behavior can lead investors to exit positions prematurely, missing potential recoveries.
Herding: Many investors follow the actions of the majority rather than independent analysis, leading to bubbles and crashes. The 2008 global financial crisis and other market corrections illustrate how herding behavior amplifies systemic risk.
Anchoring: Market participants often rely too heavily on a reference point, such as a stock's past high, when making decisions. This can lead to mispricing in fast-moving global markets.
These biases illustrate that market performance is as much about managing internal psychological factors as it is about external economic conditions. Recognizing and mitigating these biases is essential for achieving consistent performance.
3. Emotional Drivers in Global Markets
Emotions are another powerful factor affecting performance. Fear and greed are two dominant emotions influencing trading decisions:
Fear: Sudden market downturns, geopolitical events, or economic crises can trigger fear, leading to panic selling. Fear-driven actions often exacerbate volatility and can result in substantial losses.
Greed: Conversely, the desire for high returns can push investors into over-leveraged positions or speculative assets. Excessive greed may lead to ignoring warning signals, contributing to financial bubbles.
In global markets, these emotions are amplified by the 24/7 nature of trading, high-speed information flow, and exposure to international geopolitical and macroeconomic events. Investors must develop emotional discipline to withstand market volatility and maintain long-term performance.
4. Risk Tolerance and Portfolio Management
Risk psychology directly informs risk tolerance, which is crucial for portfolio construction and investment strategy. Understanding one’s own risk profile—or that of an organization—is essential for aligning investment choices with financial goals and market conditions.
Conservative Investors: Prefer stable, low-risk assets even if returns are modest. They may underperform in bullish markets but avoid significant drawdowns during crises.
Aggressive Investors: Willing to take on higher risk for the potential of greater returns. Their performance can be stellar in favorable conditions but highly volatile during downturns.
Institutional Risk Management: Large global institutions often implement structured risk management frameworks that combine quantitative models with psychological insights to mitigate irrational decision-making among traders.
Balancing risk tolerance with market opportunities is a core component of consistent performance. Investors who fail to match their strategies with their psychological profile often make impulsive decisions that negatively affect returns.
5. The Impact of Risk Psychology on Market Trends
Risk psychology doesn’t just affect individual investors—it can influence global market trends. Collective human behavior, shaped by shared perceptions of risk and sentiment, can drive market cycles:
Bull Markets: Optimism and reduced risk perception fuel buying, often inflating asset prices beyond fundamental values.
Bear Markets: Pessimism and heightened fear lead to selling, creating sharp declines.
Volatility Spikes: Emotional reactions to unexpected events, such as geopolitical crises or central bank announcements, can result in abrupt market swings.
Market sentiment indicators, like the Volatility Index (VIX), are essentially measures of collective risk psychology. Traders and institutions often use these tools to gauge sentiment and anticipate potential market movements.
6. Strategies to Mitigate Psychological Risk
Given the profound influence of risk psychology on performance, it is crucial for market participants to implement strategies to manage these effects:
Education and Awareness: Understanding common biases and emotional triggers helps investors make more rational decisions.
Structured Decision-Making: Using checklists, rules-based systems, and quantitative models reduces the influence of emotion on trading decisions.
Diversification: Spreading investments across asset classes, geographies, and strategies mitigates the impact of unexpected events and reduces stress.
Regular Reflection and Journaling: Tracking decisions, outcomes, and emotional states helps identify patterns and improve future performance.
Stress Testing: Simulating adverse scenarios allows traders and institutions to anticipate emotional responses and refine risk management.
7. Conclusion
Performance in global markets is a complex interplay of economic fundamentals, technical analysis, and, importantly, human psychology. Risk psychology illuminates the ways in which emotions, cognitive biases, and perception of uncertainty influence market behavior. Traders and investors who cultivate self-awareness, emotional discipline, and structured decision-making frameworks can navigate market volatility more effectively and improve long-term performance.
Global markets are inherently uncertain, and even the most sophisticated models cannot fully predict outcomes. By understanding risk psychology, market participants gain a powerful tool: insight into their own behavior and the collective behavior of others. This understanding not only enhances individual performance but also contributes to a more stable and resilient financial system.
In essence, mastering risk psychology is not about eliminating risk—it’s about managing human responses to risk, aligning decisions with long-term goals, and leveraging an understanding of human behavior to thrive in the complex world of global finance.

Understanding Capital Flows and Their Influences1. Macroeconomic Conditions
One of the primary drivers of capital flows is the macroeconomic condition of countries involved. Investors seek economies that offer higher returns and stable growth prospects. When a country experiences strong economic growth, rising productivity, and increasing corporate profits, it attracts foreign capital. Conversely, economic instability, high inflation, or recession can lead to capital outflows.
Interest Rate Differentials: Investors often shift capital to countries with higher interest rates to earn better returns on bonds and deposits. For instance, if the U.S. Federal Reserve raises interest rates, it can attract investment from emerging markets seeking higher yields. Conversely, countries with lower interest rates may see capital leaving for better opportunities elsewhere.
Inflation and Currency Stability: High inflation erodes returns for foreign investors, while a stable currency attracts capital. For example, if a country’s currency is expected to depreciate sharply, foreign investors may withdraw funds to avoid losses.
Economic Growth and Investment Opportunities: Countries with strong GDP growth and expanding industries tend to attract long-term investments such as FDI. Capital tends to flow to sectors showing potential for innovation, infrastructure development, and high returns.
2. Government Policies and Regulations
Government policies, fiscal measures, and regulatory frameworks significantly impact capital flows.
Monetary Policy: Central banks influence capital flows through interest rates, quantitative easing, and currency interventions. Tight monetary policy can attract inflows due to higher returns, while loose monetary policy can lead to outflows if returns fall below global benchmarks.
Fiscal Policy: Large budget deficits or high public debt may discourage foreign investment as they raise concerns about a country’s financial stability. Conversely, tax incentives and investment-friendly policies encourage inflows.
Capital Controls: Some countries implement measures to regulate the flow of capital. These may include taxes on foreign investments, restrictions on currency conversion, or limits on foreign ownership of domestic assets. Such measures can either slow capital outflows or deter inflows.
Trade and Investment Agreements: Bilateral and multilateral agreements enhance investor confidence by providing a predictable legal framework. Countries engaged in favorable trade deals often experience more stable and sustained capital inflows.
3. Global Financial Conditions
Capital flows are also influenced by global liquidity, market sentiment, and risk perception. In a globalized economy, investors are highly sensitive to international trends.
Global Interest Rates: Changes in benchmark interest rates, such as those set by the U.S. Federal Reserve or the European Central Bank, impact global capital allocation. Higher rates in developed countries can trigger outflows from emerging markets.
Financial Market Volatility: Periods of heightened risk, such as stock market crashes, sovereign debt crises, or geopolitical tensions, often lead to capital flight from riskier markets to safe-haven assets like gold, U.S. Treasury bonds, or stable currencies.
Commodity Prices: Countries heavily dependent on commodities, such as oil or metals, experience fluctuating capital flows linked to global price trends. A drop in commodity prices can reduce export revenues, making foreign investors wary and triggering outflows.
4. Investor Behavior and Sentiment
Investor psychology plays a critical role in determining capital flows. Behavioral biases, herd mentality, and speculation can amplify movements.
Risk Appetite: Investors’ willingness to take risks affects where capital flows. In times of global uncertainty, investors often move money to safer economies. Conversely, when confidence is high, capital seeks high-return emerging markets.
Speculative Investment: Short-term capital flows, such as those in the form of hot money, are highly sensitive to speculation, interest rate changes, and currency expectations. These flows can be volatile, creating sudden spikes or drops in capital movement.
Market Perceptions: Media reports, political statements, and economic forecasts shape investor expectations. Negative news about a country’s governance, debt, or economic stability can trigger rapid outflows.
5. Geopolitical Factors
Political stability and international relations significantly affect cross-border capital flows.
Political Stability: Stable governments with predictable policies attract long-term investment. Political unrest, corruption, or policy uncertainty can deter investors and trigger capital flight.
Trade Wars and Sanctions: Geopolitical tensions, trade disputes, or sanctions can disrupt capital flows. For example, restrictions on financial transactions with certain countries reduce foreign investment and borrowing capacity.
Wars and Conflicts: Armed conflicts create extreme uncertainty, prompting investors to withdraw capital to preserve assets.
6. Technological and Structural Changes
Technological advancements and structural transformations in the economy also influence capital flows.
Financial Market Development: Well-developed financial systems with transparent regulations attract foreign capital. Efficient banking systems, stock exchanges, and digital payment infrastructure enhance investor confidence.
Technological Innovation: Countries leading in technology adoption, e-commerce, and fintech attract foreign direct investment in high-growth sectors.
Infrastructure and Urbanization: Investments in transportation, energy, and urban development attract both domestic and foreign capital seeking long-term returns.
7. Crisis Events and Shocks
Unforeseen events, such as pandemics, natural disasters, or financial crises, can abruptly alter capital flows.
Financial Crises: Banking collapses, debt defaults, or currency crises trigger massive capital outflows as investors seek to minimize losses.
Pandemics and Health Crises: Global health emergencies reduce investor confidence, disrupt supply chains, and lower returns, prompting withdrawal of capital.
Natural Disasters: Earthquakes, floods, or hurricanes can destroy infrastructure and economic output, discouraging investment.
Conclusion
Capital flows are a complex interplay of domestic economic fundamentals, global financial conditions, government policies, investor behavior, and geopolitical stability. Positive economic indicators, stable governance, and high global liquidity attract capital inflows, fueling growth and development. Conversely, economic instability, political uncertainty, restrictive policies, and global crises trigger capital outflows, affecting exchange rates, investment levels, and financial stability. Understanding the drivers of capital flows helps policymakers, investors, and businesses anticipate risks and opportunities in the ever-connected global economy.
In today’s highly integrated world, even small shifts in policy or market sentiment can trigger large movements of capital across borders. Monitoring these factors allows governments to implement measures to stabilize capital flows, attract investment, and sustain economic growth, while investors can strategically allocate resources to optimize returns while managing risk.

Critical Elements Supply: Understanding the ConceptIntroduction
The modern world depends heavily on a wide range of raw materials and essential elements to maintain economic growth, technological advancement, and national security. Among these, critical elements—sometimes referred to as critical minerals—play a pivotal role in industries like electronics, energy, aerospace, defense, and renewable technologies. The supply of these critical elements is increasingly becoming a topic of strategic importance globally because of their scarcity, geopolitical concentration, and rising demand. Understanding critical elements supply involves examining what makes an element critical, the factors influencing their availability, global supply chains, and strategies for managing risk.
Defining Critical Elements
Critical elements are materials deemed essential for industrial and technological development but whose supply is vulnerable due to various economic, geopolitical, or technical factors. These are often elements for which:
Substitute materials are limited or non-existent.
Demand is growing rapidly, often driven by new technologies like electric vehicles (EVs), wind turbines, solar panels, and high-tech electronics.
Supply is concentrated in a few countries, making global supply chains sensitive to geopolitical tensions.
Recycling and recovery processes are underdeveloped, leading to reliance on primary extraction.
Examples of critical elements include rare earth elements (REEs) such as neodymium and dysprosium, lithium, cobalt, and nickel for batteries, platinum-group metals for catalytic converters, and indium and gallium for semiconductors and solar cells.
Factors Affecting the Supply of Critical Elements
Geological Scarcity
The distribution of critical elements in the Earth's crust is uneven. Some elements, such as lithium and cobalt, are concentrated in a few regions like the Lithium Triangle in South America (Chile, Argentina, Bolivia) or the Democratic Republic of Congo (DRC) for cobalt. This geological scarcity makes supply vulnerable to localized disruptions.
Mining and Extraction Challenges
Extracting and processing critical elements can be technologically complex and environmentally sensitive. Many critical elements are byproducts of other mining operations. For instance, indium is a byproduct of zinc mining, and some rare earths are obtained as byproducts of phosphate mining. This interdependence can lead to supply bottlenecks.
Geopolitical Risks
Countries holding a significant portion of global reserves often use their resources as strategic tools. China, for example, dominates the production and processing of rare earth elements, controlling about 80-90% of the global market. Political instability, trade restrictions, or policy changes in producing nations can disrupt global supply chains.
Economic Factors
Price volatility, investment in mining infrastructure, and global demand fluctuations can significantly affect supply. Low prices might discourage exploration and production, while high prices can lead to rapid expansion of supply or overexploitation.
Environmental and Regulatory Constraints
Mining critical elements often involves significant environmental risks, including habitat destruction, water contamination, and radioactive waste (especially with rare earth extraction). Stricter environmental regulations can limit production rates or increase costs, influencing supply reliability.
Global Supply Chain Dynamics
The supply of critical elements is heavily reliant on global trade networks. Key stages in the supply chain include mining, processing/refining, manufacturing, and recycling. Supply chains are often concentrated in a few countries, making them vulnerable to disruptions:
China: Dominates rare earth mining, processing, and export; controls a significant portion of the global supply of critical elements like magnesium, gallium, and graphite.
Democratic Republic of Congo: Accounts for more than 60% of cobalt production.
Australia: Major supplier of lithium and rare earth elements.
South America: Lithium extraction in Chile, Argentina, and Bolivia.
The dependency on a small number of suppliers creates systemic risk, making industries vulnerable to geopolitical tensions, trade wars, or resource nationalism.
Technological Dependence and Criticality
The criticality of elements is not only determined by scarcity but also by technological dependence. For instance:
Electronics: Elements like indium, gallium, and tantalum are essential for semiconductors, touch screens, and microelectronics.
Renewable Energy: Lithium, cobalt, nickel, and rare earths are crucial for batteries, magnets, and photovoltaic cells.
Defense and Aerospace: Platinum-group metals, titanium, and hafnium are necessary for military hardware and aerospace applications.
As technology evolves, new elements can become critical due to increasing demand, while others may lose importance if substitutes or recycling options emerge.
Challenges in Ensuring Stable Supply
Market Concentration
Overreliance on a few suppliers can lead to supply disruptions. For example, China's dominance in rare earths led the U.S. and EU to explore alternative sources after past export restrictions.
Sustainability Concerns
Mining critical elements often has severe environmental consequences. Sustainability initiatives and ethical sourcing are becoming critical for maintaining long-term supply chains.
Recycling and Circular Economy
Low recycling rates for critical elements exacerbate supply vulnerability. Technologies for recovering rare earths, lithium, and other critical materials from used electronics and batteries are still developing.
Strategic Stockpiling
Some nations maintain strategic reserves to mitigate supply risks. For instance, the U.S., Japan, and EU countries stockpile critical minerals to ensure national security and technological independence.
Strategies to Secure Critical Element Supply
Diversifying Supply Sources
Countries and companies are seeking alternative sources of critical elements to reduce dependence on a single supplier or region. Exploration of new deposits in Africa, Australia, and North America is increasing.
Developing Domestic Production
Promoting domestic mining and processing capabilities can reduce reliance on foreign sources. This strategy requires investment in infrastructure, technology, and workforce development.
Recycling and Substitution
Advanced recycling techniques and material substitution can help reduce pressure on primary supply. For example, recycling lithium-ion batteries for lithium, cobalt, and nickel recovery is gaining momentum.
Strategic Partnerships and Trade Agreements
Forming international partnerships for joint mining projects, technology sharing, and trade agreements ensures more stable access to critical materials.
Research and Innovation
Investments in alternative materials, efficient extraction methods, and sustainable mining practices are crucial to overcoming supply limitations.
Conclusion
The supply of critical elements is a cornerstone of modern industrial and technological advancement. However, it is fraught with challenges stemming from geological scarcity, geopolitical concentration, environmental constraints, and rising demand driven by emerging technologies. Managing these challenges requires a multi-pronged approach, including diversification of sources, recycling, substitution, strategic stockpiling, and international collaboration. Governments, industries, and researchers worldwide are recognizing the strategic importance of these materials and actively seeking sustainable and resilient supply chain solutions.
As global economies increasingly transition to green technologies, digitalization, and advanced manufacturing, the criticality of these elements will only grow. Understanding and securing their supply is therefore not just an economic necessity but a strategic imperative for national security and technological leadership.

Leading Diagonals: Confusing Traders since 1880sSInce mid Nov 2025, traders have found it almost impossible to predict the pattern in Bitcoin, Coreweave, NBIS kind of charts and rightly so, because leadign diagonal has entered the room.
So what is a leading diagonal . In Elliot wave theory, a leading diagonal appears at the start of a new trend. In short,
- It looks like a wedge with overlapping waves
- Forms when a trend is trying to begin but lacks full conviction
- Indicates early positioning before broader participation
- Is usually followed by a strong, decisive move once belief catches up
Think of it as the market testing new direction, before committing to it.
How the market feels when a leading diagonal is forming:
Conflicted rather than confident. Price is moving in the direction of the new trend, but the underlying conviction isn’t fully there yet.
1. Early believers vs. skeptics
A new trend is trying to start, but most participants are still anchored to the prior trend. Early buyers (or sellers) step in, yet they’re repeatedly met with profit-taking and countertrend pressure.
2. Momentum exists, but it’s uneven
You’ll often see overlapping waves, shallow follow-through, and corrective pullbacks that feel premature. This reflects commitment without consensus.
3. Volatility stays elevated
Because conviction is low, price tends to swing more than it should in a healthy impulse. Stops get hunted, and false breaks are common.
4. Participation is selective
Smart money is probing. Retail is hesitant. Volume often fails to expand cleanly because positioning is still being tested rather than fully deployed.
5. Pressure quietly builds
Each push forward that doesn’t fully fail chips away at skepticism. By the time the diagonal completes, positioning is often lopsided, setting up the sharp move that usually follows.
In short ,
A leading diagonal feels like a market arguing with itself. Direction is emerging, but belief hasn’t caught up yet. That internal debate is exactly why the structure looks messy and why the resolution afterward tends to be decisive.
So how to identify a leading diagonal technically:
1. Wave count: Five waves (1–2–3–4–5), but waves overlap (Wave 4 overlaps Wave 1).
2. Shape : Price compresses into a wedge (contracting or expanding).
3. Momentum : Progress is directional but uneven, with shallow follow-through.
4. Trendline s: Upper and lower boundaries converge or diverge, not parallel like an impulse.
5. Confirmation : The move after the diagonal is typically sharp and fast, validating the pattern.
6. Usually, : Wave a or 1 is longest and wave c or (iii) cannot be shortest amount the up waves
In essence, if price is advancing, overlapping, and compressing early in a move,while still making progress, you’re likely looking at a leading diagonal.
What do indicators show when a leading diagonal is forming ?
RSI
-Often shows weaker momentum on Wave 3 than expected.
- May produce early divergence even though price is still advancing.
- Tends to stay capped (bullish case) instead of trending strongly.
MACD
- Momentum expands initially, then fails to accelerate.
- Histogram peaks early and flattens as price continues.
- Signal line crosses are frequent, reflecting overlap and indecision.
How to trade a leading diagonal ?
- Leading diagonals overlap and retrace deeply. If you size or manage it like a clean Wave 1, you’ll get chopped.
- The safest entry is from Wave 4 → Wave 5, Stops usually go beyond the Wave b or wedge invalidation level.
- Best approach WAIT: The highest-quality trade often comes after the diagonal finishes.
- What to wait for: Clean break of the wedge, Momentum expansion (RSI/MACD confirmation), Strong follow-through in the next impulse
- Breakouts inside the diagonal frequently fail so avoid chasing internal breakouts. If price breaks a boundary but momentum and volume don’t expand, assume it’s noise.
A leading diagonal is the market warming up. The real opportunity comes once it’s done arguing.

BITCOIN'S ALL TIME HISTORY CHART(KEY INSIGHTS)This is a breakdown of all major waves that have occurred in Bitcoin's History. This chart might explain why CRYPTOCAP:BTC has been the most successful coin while also answering if the growth will be sustained. This is a pretty standard 5 wave move- Waves 1 to 4 having been completed(shown in Red). We are on our last Major wave before it becomes a complete 5 wave impulse.
Wave 1(Red) was followed by a Zigzag correction for Wave 2, hence we expected a Flat correction For Wave 4. Keep in mind, this Flat correction had been predicted almost 2 and a half years before, when Wave 2 was completed! Wave 4 had 3 internal waves namely A,B and C- shown in Blue.
With Wave 4 complete, it was time to launch our 5th Wave of the Major impulse. This 5th Wave has 5 internal waves as is typical for impulses and are shown in Green. Once again, when Wave 1(Green) completes we see a Flat correction for Wave 2 meaning our Wave 4 would most likely be a Zigzag correction. Note that these two corrections are best seen on the Weekly and Daily Charts.
With Wave 4(Green) complete, what we are left with is Wave 5(Green) in its final developments. Once this Wave 5 is complete, this will be the Wave 5(Red) of Bitcoin. When this happens, it will be the end of the first impulse that started in 0ct. 2009 and the beginning of Wave 2, which will be a massive correction!

How to Use Divergence in a High-Probability Way — Tutorial #1In this tutorial, I explain how to use Wide and Tight Divergence in a structured and practical way.
WHAT IS DIVERGENCE?
Divergence occurs when price makes a new high/low while momentum indicators move in the opposite direction. This signals weakening momentum and a potential reversal or correction.
WHY DOES DIVERGENCE WORK?
Divergence exposes momentum weakness before price actually reverses. It helps traders identify exhaustion early, improving accuracy and timing.
TWO MAIN TYPES OF DIVERGENCE
1.) WIDE DIVERGENCE
Price forms a large, extended swing while the indicator creates a smaller swing in the opposite direction. This signals strong exhaustion and is often followed by a bigger reversal.
2.) TIGHT DIVERGENCE
Price forms a small higher high or lower low while momentum moves opposite. This reflects micro-exhaustion and often appears before sharp pullbacks.
STEPS FOR WIDE DIVERGENCE
1.) Identify wide swings
Look for a clear extended higher high or lower low compared to recent structure.
2.) Check RSI moving in the opposite direction
This is the initial (unconfirmed) divergence.
3.) Draw a trendline + mark nearest support/resistance zone
These structural levels help filter weak signals.
4.) Wait for a break of both the trendline AND the S/R level
This confirms the divergence.
5.) Drop to a lower timeframe for entry
Use clean price action and break–retest structure to refine entry.
STEPS FOR TIGHT DIVERGENCE
1.) Identify small, shallow swings
Look for minor higher highs or lower lows forming weak structure.
2.) Check RSI moving in the opposite direction
This signals early momentum failure.
3.) Draw a trendline + nearest S/R level
Tight Divergence requires smaller structural zones.
4.) Wait for a break of both levels
A confirmed divergence requires a clean break.
5.) Drop to a lower timeframe for precise entry
Tight Divergence usually leads to fast corrective moves.
If you want PART 2, leave a like and a comment.
Follow for high-quality trading education and clean technical logic.
DISCLAIMER :
This post is for educational purposes only and does not constitute financial advice. Trading involves risk, and you should always conduct your own analysis. I am not responsible for any decisions or losses based on this content.

How Price Really Moves: 4 Entry Triggers Driven by LiquidityThis breakdown explains four recurring entry triggers that appear consistently across real market structure.
These are not indicators and not prediction tools. They are observable behaviors driven by liquidity, positioning, and trader psychology.
Each trigger is rooted in why price moves, not what price might do next.
1. Fading breakout traders (Failed Momentum / Trap Model)
When price breaks a key level and open interest jumps, breakout traders rush in expecting continuation. If price quickly snaps back, those new traders become trapped and their exits fuel a move in the opposite direction. This creates one of the cleanest reversal triggers since you are trading directly against failed momentum.
► What usually happens
Markets frequently approach obvious highs, lows, or range boundaries where:
•Retail breakout traders anticipate continuation
•Algorithms and short-term momentum systems enter aggressively
•Open interest or volume often expands rapidly
At this moment, new positions are created late , directly into resistance or support.
► The key failure
If price:
•Breaks a key level
•Fails to hold acceptance beyond it
•Quickly closes back inside the prior range
Then the breakout has failed structurally.
This means:
•Buyers who entered above resistance are now trapped
•Sellers who entered below support are trapped
•Their exits (stops + panic closes) become fuel for the opposite move
► Why this works
Markets move efficiently when traders are positioned correctly.
They move violently when traders are positioned incorrectly.
A failed breakout converts hope-based positions into forced exits.
► Educational takeaway
You are not trading the level,
you are trading the failure of belief at the level.
This is why failed breakouts often produce:
•Fast reversals
•Clean directional candles
•Strong continuation after rejection
2. Liquidation flushes (Forced Exit & Rebalance Model)
Sharp liquidation events create long wicks and temporary price inefficiencies. Markets tend to rebalance after these shocks as liquidity returns, which is why these wicks often get filled quickly. This setup works well in volatile phases and near exhaustion points where forced selling or buying pushes price too far.
► What a liquidation flush is
A liquidation flush occurs when:
•Price moves aggressively in one direction
•Overleveraged positions are forcibly closed
•Stops and liquidations cascade simultaneously
This often creates:
•Long wicks
•One-sided impulsive candles
•Temporary price inefficiencies
Importantly, this move is not driven by new conviction, but by forced exits.
► What happens after
Once forced liquidations are complete:
•Selling or buying pressure rapidly decreases
•Liquidity returns to the market
•Price frequently retraces part or all of the wick
This retracement is not random
it is the market rebalancing after stress.
► Where flushes matter most
Liquidation flushes are most meaningful when they occur:
•Near prior highs/lows
•At range extremes
•After extended directional moves
•During high-volatility sessions
► Educational takeaway
A liquidation wick does not mean “strong trend”.
It often means the move is temporarily exhausted.
You are not trading momentum,
you are trading the absence of remaining pressure.
3. Orderblocks
Orderblocks are zones where previous heavy participation occurred, usually during sideways movements before a strong move away. When price revisits these levels, the same participants often defend the area, creating reliable reaction points. Clean pivots with no messy wicks are the strongest since they signal clear institutional activity.
► What an orderblock represents
Orderblocks are areas where:
•Large participants accumulated or distributed positions
•Price moved sideways briefly
•A strong directional move followed immediately after
This sideways phase exists because large players cannot enter all at once without moving price against themselves.
► Why orderblocks matter
•When price returns to these zones:
•Previous participants may still be active
•Unfilled orders may remain
•Defensive reactions are more likely than random continuation
Clean orderblocks typically show:
•Tight consolidation
•Minimal wicks
•Strong departure afterward
Messy structures often indicate mixed participation and weaker reactions.
► How orderblocks are used
Orderblocks are reaction zones , not signals.
They provide:
•Logical areas to expect interest
•Defined risk zones
•Context for entry triggers like wicks or failed breaks
► Educational takeaway
Orderblocks work because institutions remember their prices , even if retail traders forget them.
You are trading where participation previously mattered, not arbitrary support or resistance.
4. London session liquidity setup
London frequently sets the daily low or high early in the session. Later in the day price often returns to sweep internal liquidity around that level before continuing the trend. This repeatable behavior offers structured entries based on predictable liquidity grabs tied to session mechanics.
► Why London matters
The London session is:
•One of the highest liquidity windows globally
•Often responsible for setting the initial daily structure
•Heavily watched by institutions and algorithms
In many markets, London establishes:
•The daily high
•The daily low
Or a key internal liquidity level early in the session
► The repeatable behavior
Later in the day (often London continuation or New York):
•Price returns to that London high or low
•Sweeps internal liquidity around it
•Rejects after stops are collected
•Continues in the higher-timeframe direction
This is not coincidence,
it is session-based liquidity engineering.
► Why it works
Institutions prefer:
•Liquidity-rich entries
•Known pools of resting stops
•Session transitions for execution
London levels provide exactly that.
► Educational takeaway
Sessions are not just time zones,
they are liquidity cycles.
Understanding when liquidity is created is just as important as where.
How These Triggers Fit Together
These models are not standalone strategies.
They are contextual tools.
Very often:
•A London sweep causes a liquidation wick
•A failed breakout forms at an orderblock
•A liquidation flush completes a failed momentum move
The strongest setups occur when multiple triggers overlap , but each can stand alone as a learning framework.
Why These Triggers Work Long-Term
They work because they are based on:
• Trader positioning
• Forced behavior (stops, liquidations)
• Institutional execution constraints
• Repeating session mechanics
They do not rely on:
•Indicator crossovers
•Lagging calculations
•Pattern prediction
Price moves because someone is forced to act.
These triggers show where and why that happens.
These 4 triggers work because they exploit trapped traders, forced liquidations and consistent liquidity patterns rather than relying on indicators. Keep them simple, wait for clean context and let the setups come to you.
Note
These concepts are:
•Descriptive, not predictive
•Contextual, not mechanical
•Dependent on execution skill and risk management
The goal is not to trade more,
it is to wait for situations where the market gives you an advantage.
I have made a script which might help identify all 4 triggers.
Disclaimer
The script is provided for educational and informational purposes only.
It does not constitute financial advice, investment advice, or a recommendation to buy or sell any instrument.
The script does not execute trades, manage risk, or replace the need for trader discretion. Market behavior can change quickly, and past behavior detected by the script does not ensure similar future outcomes.
Users should test the script on demo or simulation environments before applying it to live markets and must maintain full responsibility for their own risk management, position sizing, and trade execution.
Trading involves risk, and losses can exceed deposits. By using the script, you acknowledge that you understand and accept all associated risks.
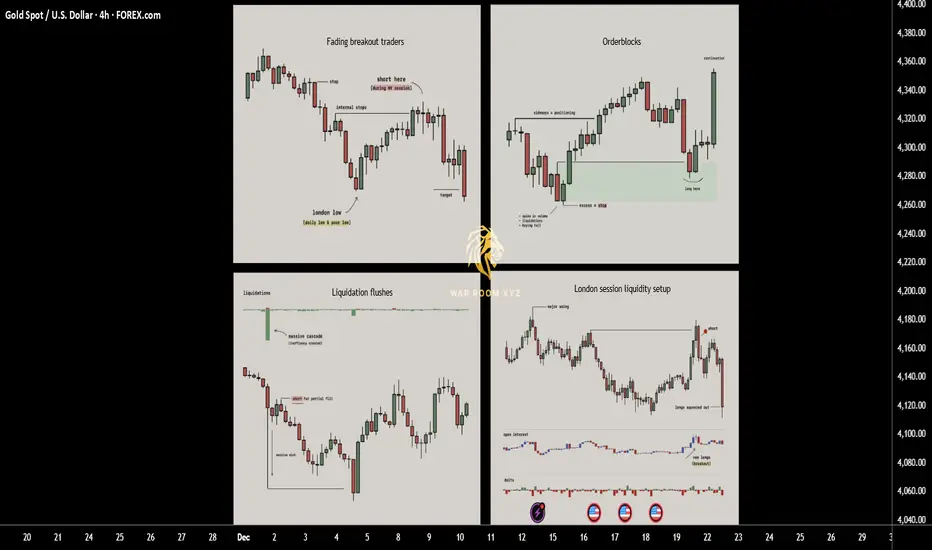
Why Bitcoin Hits Your Stop Loss Before the Real MoveWhy Bitcoin Hits Your Stop Loss Before the Real Move
Have you ever placed a Bitcoin trade and noticed this? 🤔
Your stop loss 😭💸 gets hit… just a few pips from your entry… then the price suddenly rockets 🚀💎 in the direction you were expecting!
This is not bad luck. It’s a Stop Loss Hunt 💥, used by smart money 🏦💰 to collect liquidity before the real trend begins.
1️⃣ Liquidity Pools Above Highs & Below Lows 📊💎
Retail traders place stop losses at obvious highs/lows 📈📉
These stops create liquidity zones 💧, which smart money targets 🔍
Price moves to these zones to collect liquidity → fuels the next trend 🚀
Example:
BTC trending upward 📈
Traders place buy stops above the previous high ⬆️
Smart money pushes price to trigger stops 💥 → collects liquidity 💎 → then moves the price in the real trend direction 🚀
2️⃣ Stop Loss Sweep 💥⚡
Price triggers retail stop losses 🛑
Retail traders get stopped out 😭💸
Institutions enter large positions with minimal resistance 💹
Key Insight:
Price needs liquidity 💧 to move strongly.
Without collecting stops, smart money cannot drive momentum efficiently ⚡
3️⃣ Fake Breakouts & Wicks 🌪️🔥
Watch for wick spikes or sudden breakouts 🕵️♂️
These are stop loss hunts
Many traders panic 😱 and exit positions
Smart money uses this to trap retail traders and continue the trend 🚀
4️⃣ The Real Move Begins 🚀🔥
After liquidity is collected 💎💧
The true trend resumes 📈
Traders who waited can enter safely 🧘♂️💹
Often, the move is stronger and faster ⚡ because institutions now control the market
5️⃣ Market Psychology Behind Stop Hunts 🧠💭
Retail traders panic when stops are triggered 😅💸
Fear is used to manipulate sentiment 🧲
Recognizing this psychological trap helps you stay calm 🧘♂️ and trade strategically 🏆
6️⃣ How to Trade Stop Loss Hunts 💡🧠
✅ Avoid stops at obvious highs/lows 🚫
✅ Wait for liquidity sweep ⏳💧
✅ Watch for wick spikes 🌟 — early signs of stop hunts
✅ Follow market structure 📊 (BOS/CHoCH)
✅ Trade after confirmation ⏱️
✅ Patience + discipline = profits 💎💹
7️⃣ Examples in Bitcoin Trading 🔍
Double top wicks above high → triggers stops 💥 → continues trend 🚀
Price dips below support → triggers stops 😭 → rebounds ⬆️
💡 Observation: Every wick tells a story 🌟 — learn to read it!
💬 Key Takeaways
Stop Loss Hunts = institutional footprints 👣
Price hunts liquidity 💧 — that’s why your SL is hit 💥
Understanding this helps you:
Trade smarter 💎
Avoid losses 😅💸
Spot trends before they happen 🚀
