META now close to a critical trendlineMETA is approaching a significant technical region.
The trendline currently in focus originated on 31 October 2022, and it has remained relevant over time.
This same trendline was retested twice in April of this year, and price action is once again moving toward it after achieving a new all-time

The best trades require research, then commitment.
Get started for free$0 forever, no credit card needed

Scott "Kidd" PoteetThe unlikely astronaut

Where the world does markets
Join 100 million traders and investors taking the future into their own hands.

SOL — Deep Pullback Into Major SupportSOL has been in a steady freefall over the past weeks. On the higher timeframes the key support and resistance zones are very clearly defined. The $250 level acted as a big resistance area, with multiple rejections showing sellers were firmly in control up there.
On the downside, the $125 support z

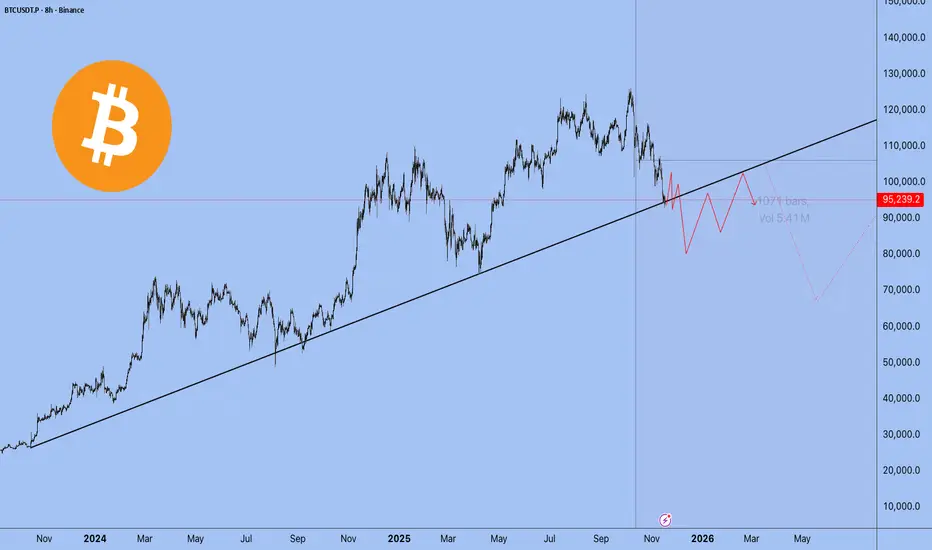
The Market is at 80°C. What Happens at 100°C?Greetings, everyone.
Today, I don't want to talk about the news. I want to talk about what truly matters: market structure. Many traders are currently looking for a news event to explain the current lull and predict Bitcoin's next move. They are looking in the wrong direction.
Remember this: the n
XAUUSD Long: Buyers Eye Push Toward $4,100 ResistanceHello traders! XAUUSD is developing a clear technical structure after reacting multiple times to both the Supply and Demand zones, forming a well-defined pattern of price behavior. Recently, Gold rejected the Supply Line after creating a new Pivot Point near the $4,230 area — the same region where a

From Shutdown Relief to AI Anxiety — Two Narratives Driving ESMarket Theme
The week began on a strong footing, driven by a bullish Sunday reopen in ES after news broke that the 43-day government shutdown was set to end, following the Senate’s late-night support for a potential agreement on November 9th. This relief catalyst created early upside momentum, pus

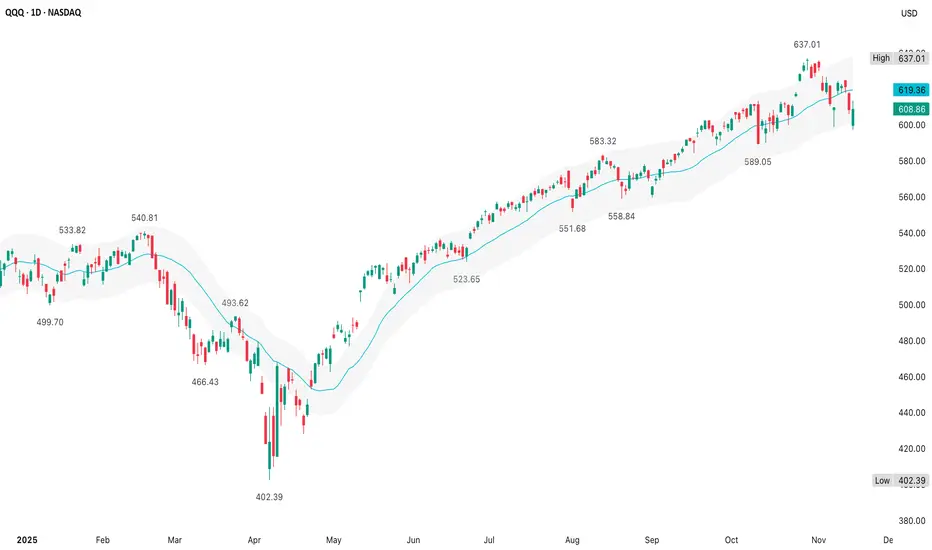
QQQ (14 November)The +/- 3% envelope with the 20d MA works well for mean-reversion strategies since it clearly shows inflection points where price may snap back toward the average
How far is price from its 20d MA & is price near extremes of the 3% bands?
Bollinger Bands adjust dynamically with volatility
Price
Technical analysis of bitcoin key levels and wedge chart pattern1. Trend Structure
The descending trendline (Resistance line) at the top of the chart remains valid.
The price has repeatedly faced rejection at this level, indicating that the medium-term downtrend is still intact.
2. Key Price Levels and Indicators
50-week EMA
The price has recently

Bitcoin FOMOThe technical levels I am watching in the near term are:
Upside Resistance:
104800
117,500
All Time High
Downside Support
87,700
84,100
Throughout this bull cycle, starting from the low in November 2022, following the January 2023 Ichimoku breakout that truly triggered the bull tre

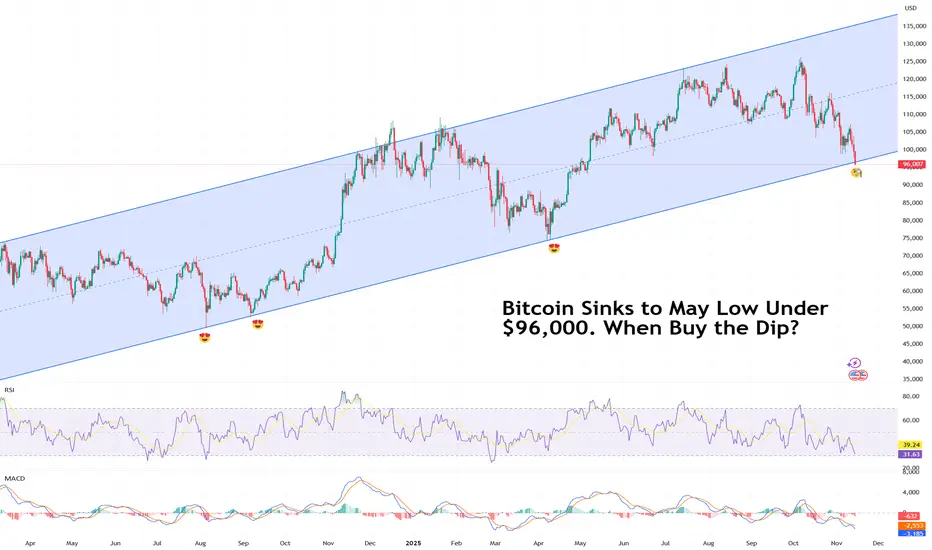
Bitcoin Sinks to May Low Under $96,000. When Buy the Dip?Because sometimes the dip just keeps on dipping.
Bitcoin BITSTAMP:BTCUSD can’t seem to catch a break. The flagship crypto slid below $96,000 on Friday, a level last seen in May, and traders aren’t exactly rushing to buy the dip.
The decline caps a tough few weeks for the OG coin, now lower by
When Arctic Storm Meets Government ShutdownNYMEX: Micro Henry Hub Natural Gas Futures ( NYMEX:MNG1! )
A “Perfect Storm” is brewing by weather catastrophe and man-made events.
On Thursday, November 6th, forecaster Atmospheric G2 said that it predicted colder than normal weather over the Eastern US for November 11-15. Driven by the expectati

See all editors' picks ideas
Holographic Market Microstructure | AlphaNattHolographic Market Microstructure | AlphaNatt
A multidimensional, holographically-rendered framework designed to expose the invisible forces shaping every candle — liquidity voids, smart money footprints, order flow imbalances, and structural evolution — in real time.
---
📘 Overview
The Hol

PriceFormatLibrary for automatically converting price values to formatted strings
matching the same format that TradingView uses to display open/high/low/close prices on the chart.
█ OVERVIEW
This library is intended for Pine Coders who are authors of scripts that display numbers onto a user's charts. T

LogNormalLibrary "LogNormal"
A collection of functions used to model skewed distributions as log-normal.
Prices are commonly modeled using log-normal distributions (ie. Black-Scholes) because they exhibit multiplicative changes with long tails; skewed exponential growth and high variance. This approach i

Range Oscillator (Zeiierman)█ Overview
Range Oscillator (Zeiierman) is a dynamic market oscillator designed to visualize how far the price is trading relative to its equilibrium range. Instead of relying on traditional overbought/oversold thresholds, it uses adaptive range detection and heatmap coloring to reveal where pri

Volume Surprise [LuxAlgo]The Volume Surprise tool displays the trading volume alongside the expected volume at that time, allowing users to spot unexpected trading activity on the chart easily.
The tool includes an extrapolation of the estimated volume for future periods, allowing forecasting future trading activity.
🔶 U

Smooth Theil-SenI wanted to build a Theil-Sen estimator that could run on more than one bar and produce smoother output than the standard implementation. Theil-Sen regression is a non-parametric method that calculates the median slope between all pairs of points in your dataset, which makes it extremely robust to o

Fair Value Gaps by DGTFair Value Gaps
A refined, multi-timeframe Fair Value Gap (FVG) detection tool that brings institutional imbalance zones to life directly on your chart.
Designed for precision, it visualizes how price delivers into inefficiencies across chart, higher, and lower (intrabar) timeframes — offering a fl

TASC 2025.11 The Points and Line Chart█ OVERVIEW
This script implements the Points and Line Chart described by Mohamed Ashraf Mahfouz and Mohamed Meregy in the November 2025 edition of the TASC Traders' Tips , "Efficient Display of Irregular Time Series”. This novel chart type interprets regular time series chart data to create an ir

Simplified Percentile ClusteringSimplified Percentile Clustering (SPC) is a clustering system for trend regime analysis.
Instead of relying on heavy iterative algorithms such as k-means, SPC takes a deterministic approach: it uses percentiles and running averages to form cluster centers directly from the data, producing smoo

Adaptive Volume Delta Map---
📊 Adaptive Volume Delta Map (AVDM)
What is Adaptive Volume Delta Map (AVDM)?
The Adaptive Volume Delta Map (AVDM) is a smart, multi-timeframe indicator that visualizes buy and sell volume imbalances directly on the chart.
It adapts automatically to the best available data resolution

See all indicators and strategies
Community trends
Google - A major correction starts now!🚽Google ( NASDAQ:GOOGL ) is now creating a top:
🔎Analysis summary:
Over the course of the past couple of months, we witnessed a major rally on Google of about +100%. This rally was totally expected, following the underlying bullish rising channel. But with the current retest of the trendline,

META now close to a critical trendlineMETA is approaching a significant technical region.
The trendline currently in focus originated on 31 October 2022, and it has remained relevant over time.
This same trendline was retested twice in April of this year, and price action is once again moving toward it after achieving a new all-time
NVDA Sitting on Critical Demand — Bounce or Breakdown? (Nov 19)NVDA has been sliding straight down inside a clean descending channel, and now price is pressing right into the major daily demand zone around 176–184. This is the same zone that saved NVDA back in September and October.
Tomorrow (Nov 19) will be all about whether buyers finally show up — or if this

NUAI Reversal
So, interesting developments as the chart unfold.
Downtrend crossing up twice.
MACD convergence.
Clear reversal pattern established.
Goes into short term consolidation
Breakout top channel price up to resistance at 4.5
Might find new support at 4.12 and if so there i will buy more
Next wave shou

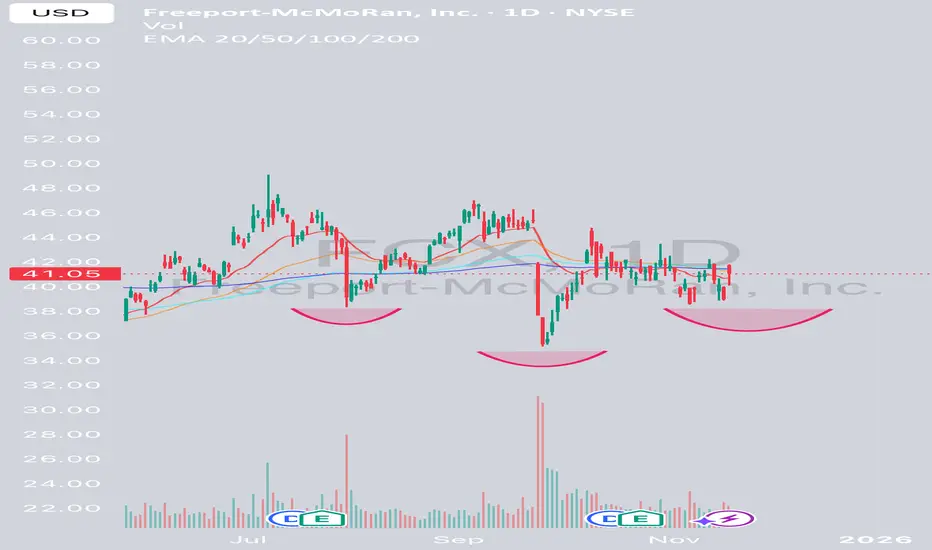
$FCX clear as day macro inverse head and shoulders. Macro inverse head and shoulders with copper prices rising this will be one to remember. Anyone have any thoughts on fcx ? The mine accident was terrible but obviously many have capitalized off of it already.
NVDA Earnings Setup – Massive Opportunity AheadNVIDIA NASDAQ:NVDA has surged +48% since our last analysis, continuing to lead the AI rally with exceptional momentum. Now, all eyes are on earnings—and the setup is massive. The options market is pricing in a ±7.5% implied move, which could mean a $345B shift in market cap. That’s one of the bigg

MSFT 1HR 11/18/2025Description of the Chart
This analysis is shared strictly for educational purposes and is not financial advice. It is intended to illustrate chart-reading techniques, structure mapping, and scenario planning.
The chart is a 1-hour price chart of Microsoft Corp. (MSFT) with technical analysis marki

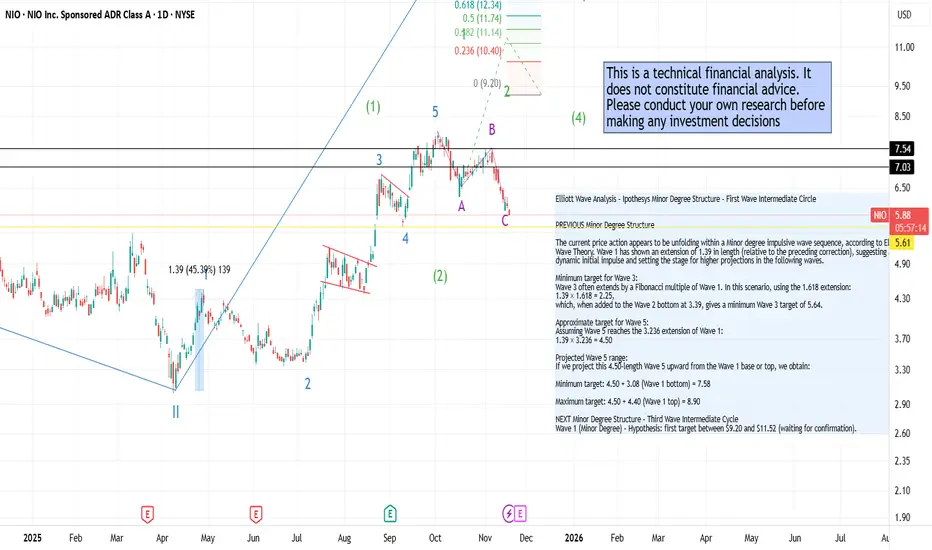
Nio Update - Possible move in the makingGiven the recent pullback in the major indices, NIO looks like it’s setting up for a potential move if market sentiment stabilizes. The stock has held above key support despite the broader retracement, showing relative strength. With deliveries improving and the company trimming losses quarter-over-
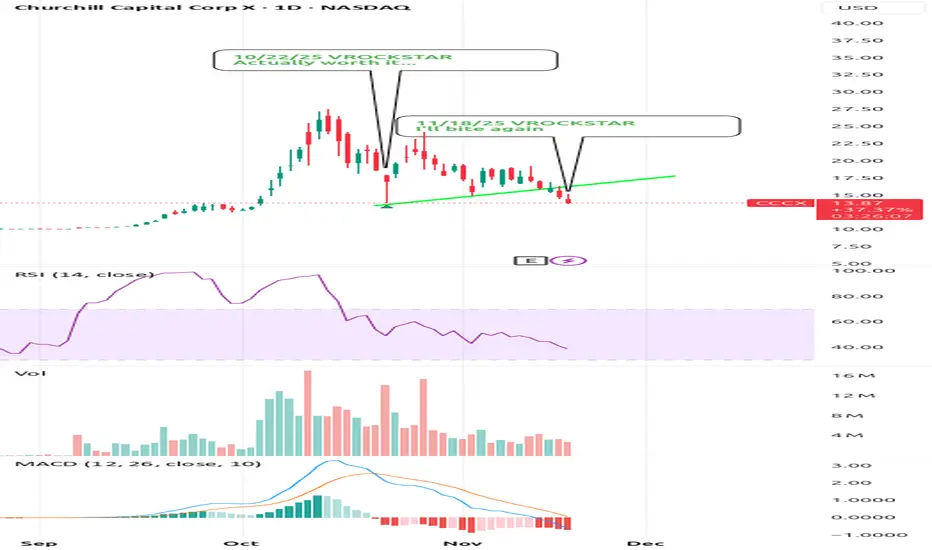
11/18/25 - $cccx - I'll bite again11/18/25 :: VROCKSTAR :: NASDAQ:CCCX
I'll bite again
- still need to update on pnl throughts plans for YE/2026
- keeping this v small (1%) to go for now
- but given it's the only real quantum company (sorry IONQ - by real i mean *with its own revenues, not M&A revenues*)
- let's go
- still reme
PANW Rose 55% in Six Months to Record Highs. What Its Chart SaysAI-powered cybersecurity giant Palo Alto Networks NASDAQ:PANW recently hit an all-time high after rising some 55% from its April lows. What does its chart and fundamental analysis say ahead of this week's fiscal Q1 earnings report?
Let's take a look:
Palo Alto Networks' Fundamental Analysis
P

See all stocks ideas
Today
WIXWix.com Ltd.
Actual
1.68
USD
Estimate
1.54
USD
Today
VSEEVSee Health, Inc.
Actual
−0.02
USD
Estimate
−0.08
USD
Today
LOWLowe's Companies, Inc.
Actual
3.06
USD
Estimate
2.97
USD
Today
GLBEGlobal-E Online Ltd.
Actual
0.07
USD
Estimate
0.07
USD
Today
KLARKlarna Group plc
Actual
−0.25
USD
Estimate
−0.25
USD
Today
TGTTarget Corporation
Actual
1.78
USD
Estimate
1.71
USD
Today
DYDycom Industries, Inc.
Actual
3.63
USD
Estimate
3.21
USD
Today
NUTXNutex Health Inc.
Actual
−2.95
USD
Estimate
−1.43
USD
See more events
Today
GLOOGLOO HOLDINGS INC
Exchange
NASDAQ
Offer price
10.00 - 12.00
USD
Tomorrow
CBCCentral Bancompany Inc.
Exchange
NASDAQ
Offer price
21.00 - 24.00
USD
Dec 1
AIGOAigo Holding Ltd.
Exchange
NASDAQ
Offer price
4.00 - 6.00
USD
Dec 1
HWEPHW ELECTRO Co. Ltd.
Exchange
NASDAQ
Offer price
—
Dec 1
PPHCPublic Policy Holding Co. Inc.
Exchange
NASDAQ
Offer price
—
See more events
Community trends
Bitcoin - Relief rally is imminent!Introduction
Bitcoin (BTC) has shown strong downward pressure over the past several days, yet it is beginning to display early signs of stabilization within key higher-timeframe fair value gap zones. Even though the current market structure remains bearish, several technical elements are aligning t

Bitcoin: Extreme support 91k! Big pump soon (easy, watch this)Bitcoin is in a critical situation because the price broke the falling wedge, and instead of a bullish breakout, we see a bearish breakdown! I expected this price action, please look at my previous posts. The falling wedge in general is a bullish pattern, but in bear markets they are bearish pattern

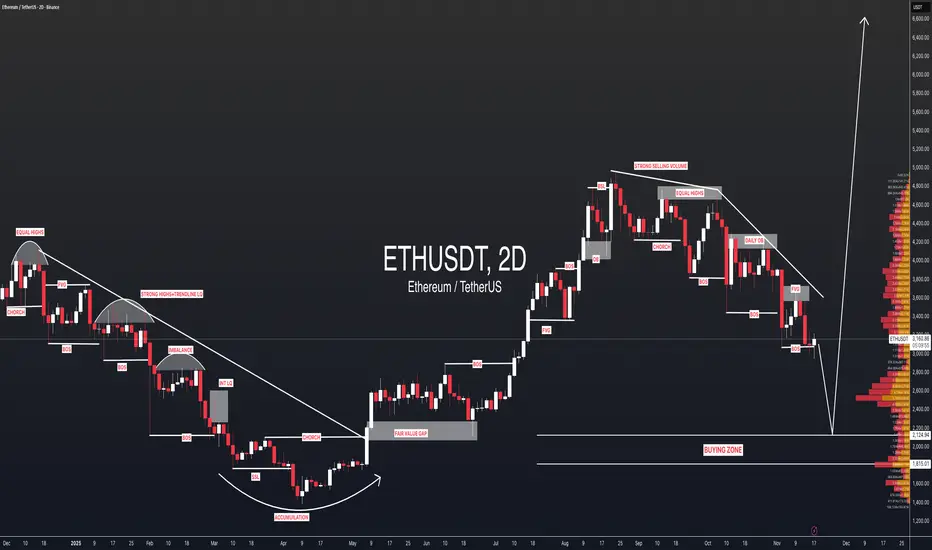
ETHUSDT: First Drop To $2100 And Bounce Up To $6500ETHUSDT is dropping nicely and we expect a smooth reversal around $2200. This area looks promising due to the significant volume sitting there. We just need to avoid liquidation. Once the entry is active, you can enter with strict risk management and set multiple take profit levels. This analysis
Bitcoin – A Gentle Slide Into A Strong ReactionBitcoin continues to trade inside a clean falling channel, moving lower in a controlled manner as it approaches a major support zone. The overall flow remains bearish in the short term, however the structure suggests we are nearing an area where a short term bullish reaction becomes highly probable.

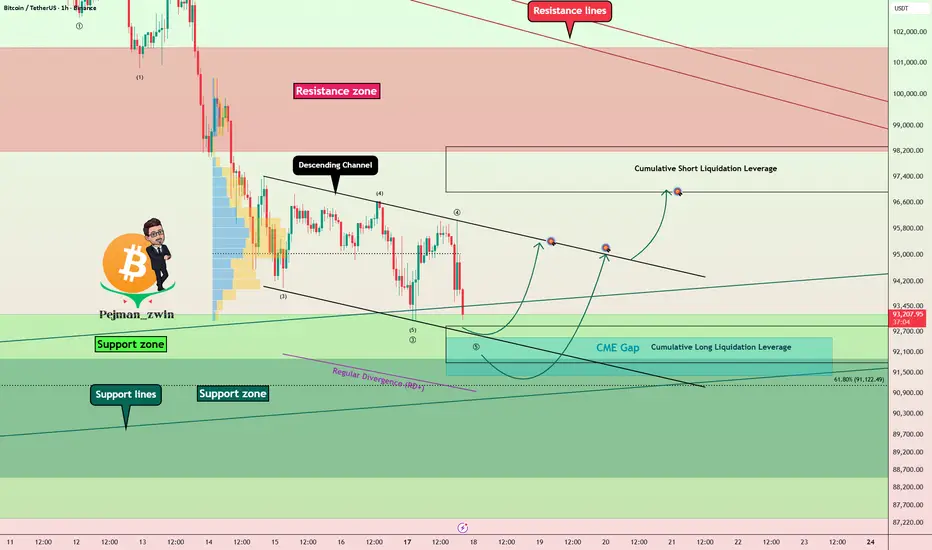
BTCUSD Rebounds From Channel Support — Targeting $93K PullbackHello traders! Let’s break down the current BTCUSD market structure. Bitcoin continues to move within a well-defined descending channel, where price has repeatedly respected both the resistance and support lines. Every touch of the upper boundary resulted in a Turned Around reaction, confirming stro

Bitcoin Roadmap: Major Support Ahead — Bounce or Breakdown?As expected in the previous idea , Bitcoin ( BINANCE:BTCUSDT ) has dropped to $93,040(Target done) .
The question now is whether Bitcoin will continue its downward trend or not.
Currently, Bitcoin is moving near the Support zone($93,200-$87,340) and key Support lines .
From the perspect
BTCUSDT – Is This the “Wake-Up” Pullback Before a Breakout?While the market was still doubting Bitcoin’s momentum, BTC suddenly pushed to its highest level in weeks , leading a strong recovery across the crypto space. And this rebound didn’t happen by luck — it came from a mix of macro sentiment and real buying pressure .
On the news side, market sentime

BTCUSDTHello Traders! 👋
What are your thoughts on BITCOIN?
Bitcoin has dropped into the marked support zone, where a bullish reaction is likely in the short term. From this area, price may attempt a move back toward the descending trendline.
The key focus will be on how price reacts once it reaches the t

BITCOIN Is all hope lost for the Bull Cycle?First of all allow me to begin by saying this: IT IS NEVER FUN to call market tops. Especially on long-term charts, especially on Bitcoin/ crypto. And the reason is that, usually it violently traps most people in. Either for a long time or until they lose all capital. And nobody should take joy in t

BTC Perfect Elliott Wave Zigzag With Terminal Wave-CBTC has formed into a near-perfect zigzag with a near-perfect terminal wave-C.
Highest Degree (Zigzag pattern):
Wave-C = A+B in time
Wave-C is the most complex and time consuming part of the pattern (common for terminal impulses)
There's clear alternation in time/price for all waves
Wave-B re

See all crypto ideas
XAU/USD | Gold Approaching Key Intraday Supply Zone! (READ)By analyzing the #Gold chart on the 4H timeframe, we can see that after dropping to 3998 dollars, price found strong demand and has now climbed back up to around 4050 dollars.
Keep an eye on the 4056–4064 zone for a potential SELL reaction, as this is a key supply area.
This analysis will be updated

XAUUSD Long: Buyers Eye Push Toward $4,100 ResistanceHello traders! XAUUSD is developing a clear technical structure after reacting multiple times to both the Supply and Demand zones, forming a well-defined pattern of price behavior. Recently, Gold rejected the Supply Line after creating a new Pivot Point near the $4,230 area — the same region where a
Gold: Fakeout Completed, Pennant Target is on goingHi guys!
Gold just completed a textbook sequence of bearish structures. After the strong drop that formed the flagpole, price consolidated inside a pennant pattern. This type of setup typically continues in the direction of the prior move, and the measured target sits around $3,946, which aligns wi

GOLD → Retest 4050 in a weak market...FX:XAUUSD is bouncing off support at 4000 and forming a correction towards 4050, an important resistance level. The market's main focus is on the September employment report (NFP), which will be released on Thursday.
Key pressure factors:
The strong dollar is supported by hawkish statements fr

Lingrid | GOLD Key Confluence Zone -Long OpportunityOANDA:XAUUSD is testing the confluence support after completing a clean pullback from the previous weekly high (PWH) and the resistance zone. The market structure shows price reacting along the channel border while holding above the broader triangle breakout region and key psychological level at 4,

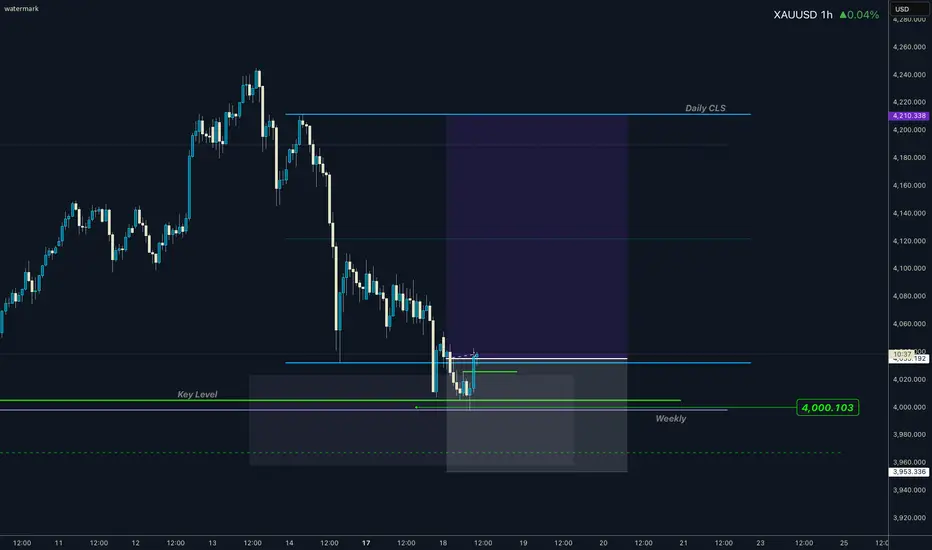
GOLD I Daily CLS I Model 1 nested in Weekly CLSHi friends, new range created. As always we are looking for the manipulation in to the key level around the range. Don't forget confirmation switch from manipulation phase to the distribution phase to make the setup valid. Stay patient and enter only after change in order flow. If price reaches 50%
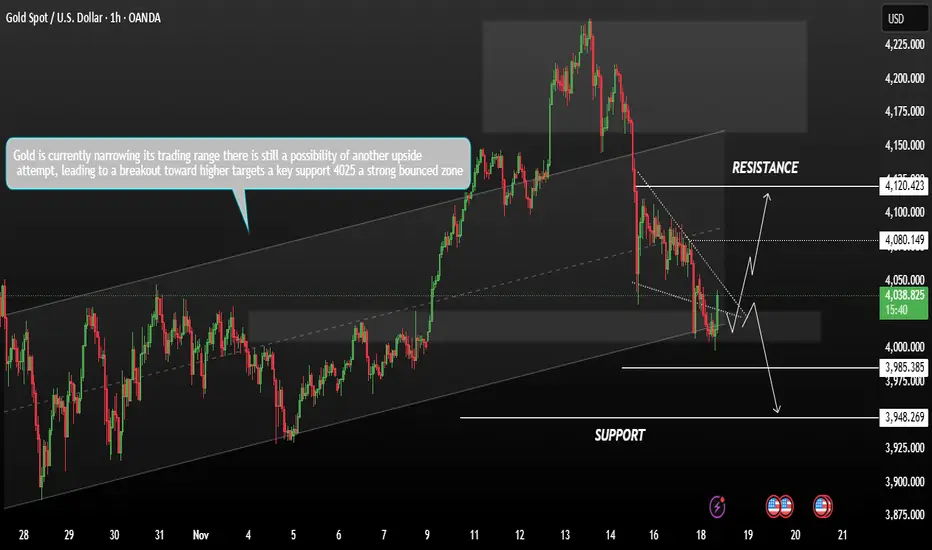
Gold Price Scenario trading range What should next ?Gold is currently narrowing its trading range and forming a triangle pattern, indicating a potential breakout setup on Tuesday, gold extended its decline, pressured by a strong U.S. dollar and reduced expectations of a Federal Reserve rate cut next month.
At the moment, gold remains in a consolidat
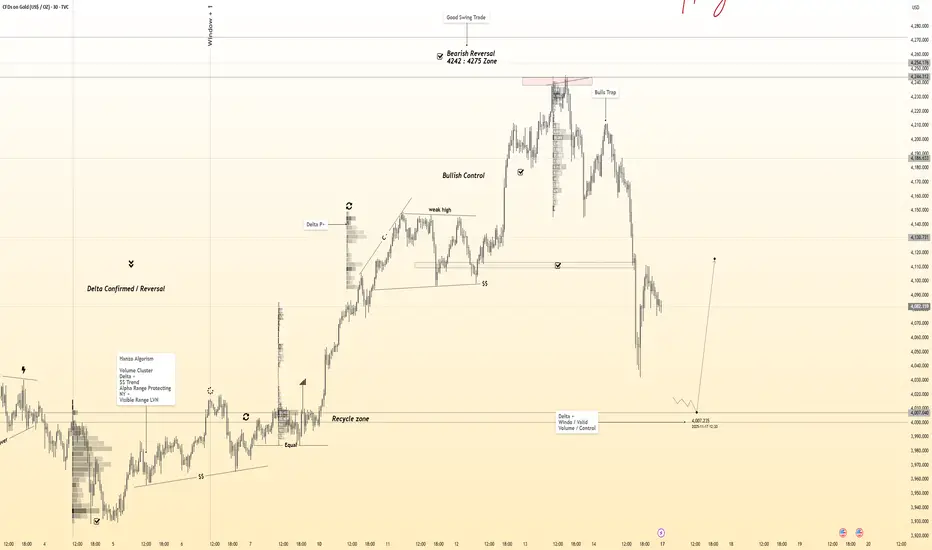
Gold 30-Min — Volume Buy Reversal Triggered⚡Base : Hanzo Trading Alpha Algorithm
The algorithm calculates volatility displacement vs liquidity recovery, identifying where probability meets imbalance.
It trades only where precision, volume, and manipulation intersect —only logic.
✈️ Technical Reasons
/ Direction — LONG / Reversal 4005 Area
BTD ChallengeThree Step Challenge.
Day Trading Nasdaq-100 Futures.
I "Bachelor's"
II "Master's"
III "Phd"
I "Bachelor's"
A. Workshop: five tabs plus a reliable business news service
*1. www.marketwatch.com
*2. 4 Hour chart
***a. Session Volume Profile
***b. volume bars
*3. Daily chart
***a. volume bars
***b. 50
Silver may hit $56 in Nov 26Silver may hit $56 in Nov 26.... then on the way to $110 by early next year. It's a once in a lifetime capital rotation event. I hold Silver ETF.... Short term fluctuation won't affect me at all.

See all futures ideas
GBP/USD - H1 - Trendline Breakout (19.11.2025)🧠 Setup Overview FX:GBPUSD
GBP/USD has broken below a long-term ascending trendline, followed by a clean retest rejection — a strong bearish confirmation signal.
Price also remains below the resistance zone (1.3180–1.3200) and is showing consistent lower highs, indicating sellers are gaining con

EURUSDHello Traders! 👋
What are your thoughts on EURUSD?
EUR/USD has bounced strongly from the identified support zone and has now broken above the descending trendline, holding firmly above it .
In the current area, we expect some short-term consolidation, followed by a continued move higher toward the

USDJPY 30-Min — Volume Buy Reversals Triggered⚡Base : Hanzo Trading Alpha Algorithm
The algorithm calculates volatility displacement vs liquidity recovery, identifying where probability meets imbalance.
It trades only where precision, volume, and manipulation intersect —only logic.
✈️ Technical Reasons
/ Direction — LONG / Reversal 155.050 Are

EURUSD Next Move Analysis The chart shows EUR/USD on a downward channel that has recently been broken to the upside. The analysis suggests a potential bullish move, with price expected to rise toward two marked resistance levels around 1.1030 and 1.1060 after a small pullback.

EURUSD Breakout and Potential RetraceHey Traders, in today's trading session we are monitoring EURUSD for a buying opportunity around 1.15700 zone, EURUSD was trading in a downtrend and successfully managed to break it out. Currently is in a correction phase in which it is approaching the retrace area at 1.15700 support and resistance

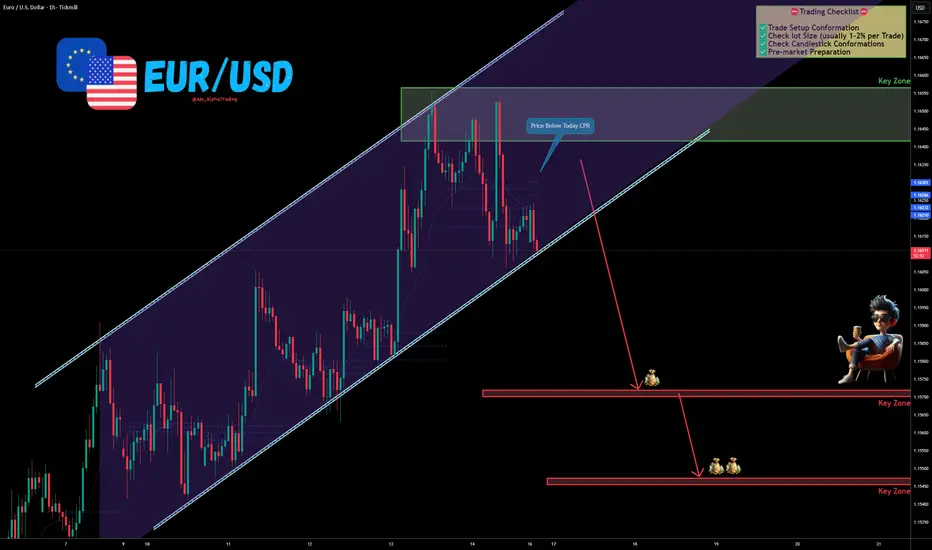
EUR/USD – Channel Breakdown Possibility | CPR Rejection Signals The EUR/USD Pair, Price has been trading within a Channel Pattern on the H1 chart, forming consistent lower highs and lower lows. Price action is now testing the lower boundary of the pattern, signalling a possible breakdown.
✅Market Context:
1️⃣Downward structure building inside the pattern.
2
19.11.25 Morning ForecastPairs on Watch -
FX:EURUSD
A short overview of the instruments I am looking at for today, multi-timeframe analysis down to what I will be looking at for an entry. Enjoy!

AUDJPY Approaches Breakout Zone – Bullish Momentum BuildingAUDJPY Approaches Breakout Zone – Bullish Momentum Building
AUDJPY continues to trade within a descending wedge structure, showing repeated rejections along the upper trendline. Price is now pressing back toward this resistance, and the recent higher lows suggest that buyers are gradually stepping

EURUSD: Sellers Target Move Toward 1.1550 Support ZoneHello everyone, here is my breakdown of the current Euro setup.
Market Analysis
EURUSD is currently reacting within a broader corrective structure after failing to break above the major Resistance Area around 1.16500. This zone has repeatedly acted as a strong supply region, where price formed mu

EUR/USD | Euro Preparing for a Bearish Reversal Zone! (READ)By analyzing the EURUSD chart on the 6H timeframe, we can see the price trading around 1.1590. I expect a small push upward first, followed by a potential rejection from the 1.16085–1.1640 zone. If we get a strong rejection there, a powerful bearish move could follow.
This bearish scenario only fail

See all forex ideas
| - | - | - | - | - | - | - | ||
| - | - | - | - | - | - | - | ||
| - | - | - | - | - | - | - | ||
| - | - | - | - | - | - | - | ||
| - | - | - | - | - | - | - | ||
| - | - | - | - | - | - | - | ||
| - | - | - | - | - | - | - | ||
| - | - | - | - | - | - | - |
Trade directly on the supercharts through our supported, fully-verified and user-reviewed brokers.


