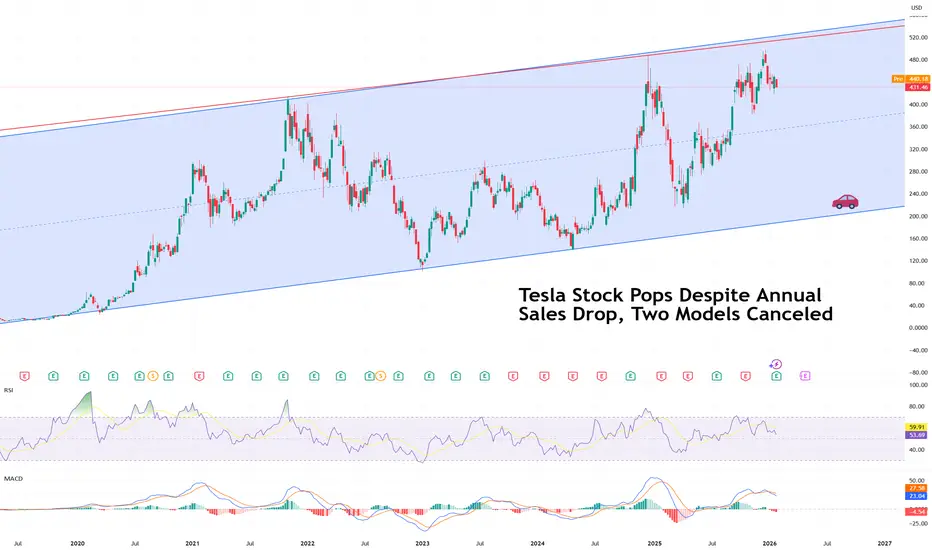
Tesla Stock Pops Despite Annual Sales Drop, Two Models CanceledTesla stock NASDAQ:TSLA managed a modest pop pre-market Thursday, rising about 3%, even as the company delivered a quarter that, on the surface, looked anything but celebratory.
Profits slid. Revenue dipped. Vehicle sales declined. Two iconic models were sent quietly into retirement. And yet, the

The best trades require research, then commitment.
Get started for free$0 forever, no credit card needed

Scott "Kidd" PoteetPolaris Dawn astronaut

Where the world does markets
Join 100 million traders and investors taking the future into their own hands.
EURUSDHello Traders! 👋
What are your thoughts on EURUSD?
EUR/USD has successfully broken above the descending trendline as well as a key resistance zone, confirming a bullish breakout on the daily timeframe.
At current levels, price is approaching a resistance area. Therefore, a short-term correction

Hellena | GOLD (4H): LONG to resistance 5200.Since the movement continues and clearly shows no signs of reversing, I had to slightly revise the wave count, and it looks as if the impulse has been extended.
This means that the higher-order wave “3” has just ended or will end soon.
This means that wave “5” is not over yet and we should expect a

Silver’s Generational Super Cycle: 31 Years of Waiting, 15 YearsWelcome to a special macro edition of the Mubite market analysis.
Today, we are zooming out to the 12-Month (Yearly) timeframe on Silver (XAG/USD).
In trading, patience is not just a virtue; it is a requirement for generational wealth. The chart we are looking at today tells a story of massive cyc

Silver at $110 in Fierce Rally, Gold Tops $5,100. What’s Behind?(What a chart.)
Silver OANDA:XAGUSD is on a tear. Actually, scratch that — silver is on a mission. Prices have surged more than 250% over the past year, including a blistering 50% jump in January alone, lifting the metal to around $109 an ounce and placing the $110 level firmly in sight .
That

XAUUSD Bullish Structure Intact - $5,040 AheadHello traders! Here’s my technical outlook on XAUUSD (2H) based on the current chart structure. Gold continues to trade within a broader bullish context, maintaining a sequence of higher highs and higher lows. Earlier in the move, price spent a significant amount of time consolidating inside multipl
Again C3.AI - 90 % potential profit - TARGET 24 USDOn the daily chart, the stock remains in a long-term downtrend; however, downward momentum has clearly weakened in recent weeks. Price has stabilized around the 12–13 USD area, which previously acted as a demand zone. This price behavior suggests a possible accumulation phase following a prolonged d

Only God or Nuclear War Can Break This Weekly Gold ResistanceA Resistance That Has Stopped Gold for 20 Years
On the weekly chart, gold has respected the same rising resistance line through every major global crisis:
May 2006 – ~$723
September 2011 – ~$1,900
Now / early 2026 projection – ~$5,000–$5,200
Each time price reached this zone, the world was u

UJ, Yen takes over, Weekly Overview and Upcoming week PlanThe week:
Exiting week for the pair, first signs of weakness in the trend confirmed both by the pattern and level where it happen. A text book evening star at the same level where the found resistance and reversed on the week of 13 January last year, so know we have 3 confirmations: Time, Pattern

BTC Is Not Weak — It’s Just Quiet Before the Next Big WaveIf I look at BTCUSDT right now through the lens of someone who has lived through multiple market cycles, what I see is a market that is calm rather than weak.
Recent news hasn’t delivered a major catalyst, and that is actually a positive sign. There is no new macro pressure, no unexpected bad ne

See all editors' picks ideas
Volume Cluster Profile [VCP] (Zeiierman)█ Overview
Volume Cluster Profile (Zeiierman) is a volume profile tool that builds cluster-enhanced volume-by-price maps for both the current market window and prior swing segments.
Instead of treating the profile as a raw histogram only, VCP detects the dominant volume peaks (clusters) insid

DeeptestDeeptest: Quantitative Backtesting Library for Pine Script
━━━━━━━━━━━━━━━━━━━━━━━━━━━━━━━━━━
█ OVERVIEW
Deeptest is a Pine Script library that provides quantitative analysis tools for strategy backtesting. It calculates over 100 statistical metrics including risk-adjusted return ratios (Sharpe

Arbitrage Detector [LuxAlgo]The Arbitrage Detector unveils hidden spreads in the crypto and forex markets. It compares the same asset on the main crypto exchanges and forex brokers and displays both prices and volumes on a dashboard, as well as the maximum spread detected on a histogram divided by four user-selected percenti

Multi-Distribution Volume Profile (Zeiierman)█ Overview
Multi-Distribution Volume Profile (Zeiierman) is a flexible, structure-first volume profile tool that lets you reshape how volume is distributed across price, from classic uniform profiles to advanced statistical curves like Gaussian, Lognormal, Student-t, and more.
Instead of forcin

Multi-Ticker Anchored CandlesMulti-Ticker Anchored Candles (MTAC) is a simple tool for overlaying up to 3 tickers onto the same chart. This is achieved by interpreting each symbol's OHLC data as percentages, then plotting their candle points relative to the main chart's open. This allows for a simple comparison of tickers to tr

Vdubus Divergence Wave Pattern Generator V1The Vdubus Divergence Wave Theory
10 years in the making & now finally thanks to AI I have attempted to put my Trading strategy & logic into a visual representation of how I analyse and project market using Core price action & MacD. Enjoy :)
A Proprietary Structural & Momentum Confluence System

Per Bak Self-Organized CriticalityTL;DR: This indicator measures market fragility. It measures the system's vulnerability to cascade failures and phase transitions. I've added four independent stress vectors: tail risk, volatility regime, credit stress, and positioning extremes. This allows us to quantify how susceptible markets are

Volatility Risk PremiumTHE INSURANCE PREMIUM OF THE STOCK MARKET
Every day, millions of investors face a fundamental question that has puzzled economists for decades: how much should protection against market crashes cost? The answer lies in a phenomenon called the Volatility Risk Premium, and understanding it may fundam

Volume Gaps & Imbalances (Zeiierman)█ Overview
Volume Gaps & Imbalances (Zeiierman) is an advanced market-structure and order-flow visualizer that maps where the market traded, where it did not, and how buyer-vs-seller pressure accumulated across the entire price range.
The core of the indicator is a price-by-price volume prof

Match Finder [theUltimator5]Match Finder is the dating app of indicators. It takes your current ticker and finds the most compatible match over a recent time period. The match may not be Mr. right, but it is Mr. right now. It doesn't forecast future connection, but it tells you current compatibility for today.
Jokes aside,

See all indicators and strategies
Community trends
TSLA Catalysts Ranking | Q1 2026 Update | by ProjectSyndicateTSLA: Updated Outlook Jan 2026 — Catalyst Memo
Updated Catalyst Scorecard Ranked by Impact
1 🤖 Autonomous and Robotaxi Execution — 9.4
2 🧱 Energy AI and Optimus Optionality — 9.0
3 🏭 EV Demand and Geographic Mix — 7.8
4 🧮 Battery Cost and Margin Levers — 7.6
5 🗃️ Affordable Model and Next Gen P

H&S or not?It might be that on 2nd of Feb this scenario could take shape.
Not a trading advice just a technical view.

uranium smrs catch up There is smrs that have underperformed the uranium trend after a big move. Does it have some strenght to go higher or it was just a blow up top ?

Jan 28 : BE BuyJust bought Bloom Energy Corp. I see this has a massive Daily break potential that has been consolidating for the better part of January 2026.
Momentum looks decent, CAD interest rate news has also just been released today. There should be enough activity to carry it through today and over the nex

MSTR might be on a 50% retraceIf you use the channel low/top as anchors, we're on a 50% level... lots of things seem to be aligning. I expect a decent bounce here and potentially a bottom

$AMZN - Inverted Head and Shoulders Pattern Perfect Setup!Hello My Exit Liquidities!
The Head and Shoulders pattern is one of the most used and noticed patter in trading
In this case we have a inverted head and shoulders which is just a regular head and shoulders, but upside down
When seeing a regular head and shoulders people usually look to go short t

$XOM breaking ATHFor the past weeks, I been persistent in tracking NYSE:XOM forecast from different bank corporation and other firms. I have noticed it has been breaking the resistance level for the past weeks. Even if you look into the past month, the stock has increased approximately $18-$20. The way I view this

MICROSOFT on a short-term rebound before drop to $410.Around 3 months ago (November 06 2025, see chart below) we gave a Sell Signal on Microsoft (MSFT) targeting $450:
The signal was confirmed and the target got hit last week, with the price immediately rebounding as it hit the 0.5 Fibonacci retracement level from the April 07 2025 Low.
This Low

NEBIUS should be in your portfolio in 2026NASDAQ:NBIS (Nebius) - a major player in the AI ecosystem, is approaching attractive technical buy levels.
From a fundamental perspective, we believe AI infrastructure will outperform AI leaders in 2026, following the strong gains seen in chipmakers throughout 2025. Historically, the more tangibl

RKLB could go either wayi prefer the bullish out come for u people that hold share. and for options traders u have some good trades ahead

See all stocks ideas
Today
GPIGroup 1 Automotive, Inc.
Actual
8.49
USD
Estimate
9.16
USD
Today
SBSISouthside Bancshares, Inc.
Actual
0.70
USD
Estimate
0.79
USD
Today
HONHoneywell International Inc.
Actual
2.59
USD
Estimate
2.54
USD
Today
DOWDow Inc.
Actual
−0.34
USD
Estimate
−0.46
USD
Today
TMOThermo Fisher Scientific Inc
Actual
6.57
USD
Estimate
6.45
USD
Today
EXPEagle Materials Inc
Actual
3.39
USD
Estimate
3.41
USD
Today
AMPAmeriprise Financial, Inc.
Actual
10.83
USD
Estimate
10.34
USD
Today
PHMPulteGroup, Inc.
Actual
2.56
USD
Estimate
2.81
USD
See more events
Today
E
EIKNEikon Therapeutics Inc.
Exchange
NASDAQ
Offer price
16.00 - 18.00
USD
Today
LIFEETHOS TECHNOLOGIES INC
Exchange
NASDAQ
Offer price
19.000
USD
Today
YSSYORK SPACE SYSTEMS INC
Exchange
NYSE
Offer price
30.00 - 34.00
USD
Today
LCDCLorenzo Developments Inc.
Exchange
NASDAQ
Offer price
4.00 - 6.00
USD
Today
P
PICSPICPAY HOLDINGS NETHERLANDS N.V.
Exchange
NASDAQ
Offer price
19.000
USD
Feb 2
HWEPHW ELECTRO Co. Ltd.
Exchange
NASDAQ
Offer price
—
Feb 3
J
JAGUJaguar Uranium Corp.
Exchange
AMEX
Offer price
4.00 - 6.00
USD
Feb 4
M
MANEVeradermics Inc.
Exchange
NYSE
Offer price
14.00 - 16.00
USD
Feb 5
F
FPSForgent Power Solutions Inc.
Exchange
NYSE
Offer price
25.00 - 29.00
USD
Feb 5
B
BOBSBob’s Discount Furniture Inc.
Exchange
NYSE
Offer price
17.00 - 19.00
USD
See more events
Community trends
Bitcoin - Must see, bear flag target 42k in 2026!Bitcoin is forming a huge bearish flag on the daily/weekly chart! This is an extremely good pattern for all bears around, but for the bulls, it's indeed not that good because the classic profit target of this pattern is 42k (by classical technical analysis of a bear flag pattern). How to measure the

Bitcoin Descending Channel Signals Further Downside To $86,100Hello traders! Here’s my technical outlook on BTCUSD (4H) based on the current chart structure. BTCUSDT initially traded inside a well-defined range, reflecting a prolonged period of balance between buyers and sellers. This consolidation phase ended with a clean upside breakout, signaling a shift in

BITCOIN isn't diverging from 2022 at all!Bitcoin (BTCUSD) continues to replicate the 2022 Bear Cycle almost in the exact same fashion. This is of course a concept we introduced back in October for the first time and so far it has fulfilled all conditions set in its way.
The most recent is the 1D MA100 (green trend-line) rejection, which i

BTCUSD – 30M – Bullish Continuation From SupportBITSTAMP:BTCUSD
After sweeping liquidity from the lower demand zone, BTC shifted momentum bullish and pushed toward the 90,700–91,000 resistance zone. Price is now retracing into prior support, suggesting a potential continuation if buyers defend the level.
Key Scenarios
✅ Bullish Case 🚀 → Hold ab

ETH : Bulls Regaining Control?ETH : Bulls Regaining Control?
Ethereum experienced a strong bullish impulse, followed by a small correction.
This structure looks like a classic bullish reversal pattern, and ETH is likely to resume the bullish trend again.
Price has now broken above the pattern, which is an important bullish s

BTC Faces Major Resistance Before FOMC – Breakdown or Breakout?As I expected in the previous idea , Bitcoin( BINANCE:BTCUSDT ) has followed the anticipated bullish and bearish trends and has reached all of its targets (full target).
Now, the question is whether Bitcoin can sustain above the $90,000 level. Stay tuned!
At the moment, Bitcoin is moving near the

ETHUSDT ASAP will hit the first target 3700$As observed on the chart, Ethereum has demonstrated resilience at the key $2,700 daily support level. This constructive price action suggests a potential bullish reversal, with the initial technical target projected toward the $3,700 resistance zone .
A decisive breakout above $3,700—particularly

BTCUSDT: Recovery From Support Within a Uptrend Toward $92,300Hello everyone, here is my breakdown of the current BTCUSDT setup.
Market Analysis
BTCUSDT is trading within a broader bullish market structure, previously supported by a well-defined upward channel. Inside this channel, price consistently printed higher highs and higher lows, confirming strong b

SOL - The Building Block!I call this area the Building Block, and it’s doing exactly what it’s supposed to do.
Right now, CRYPTOCAP:SOL is trading below the $129 structure, and as long as price stays under this level, the bias remains bearish. No guessing, no forcing it. Structure is structure.
That said, this level is

BTCUSDT Long: Reacts From Demand - Pullback Toward $89,500Hello traders! Here’s a clear technical breakdown of BTCUSDT (2H) based on the current chart structure. Bitcoin previously traded within a well-defined ascending channel, confirming a strong bullish phase with consistent higher highs and higher lows. During this advance, price successfully broke abo

See all crypto ideas
Hellena | GOLD (4H): LONG to resistance 5200.Since the movement continues and clearly shows no signs of reversing, I had to slightly revise the wave count, and it looks as if the impulse has been extended.
This means that the higher-order wave “3” has just ended or will end soon.
This means that wave “5” is not over yet and we should expect a
GOLD - Correction ahead of the Fed meeting. What next?FX:XAUUSD hit a new high of 5311 and entered a correction phase (profit-taking) ahead of the Fed's interest rate meeting...
Fundamental situation
Tensions between the US and NATO over plans for Greenland. Trump's threats to impose 100% tariffs on goods from Canada. Fruitless negotiations bet

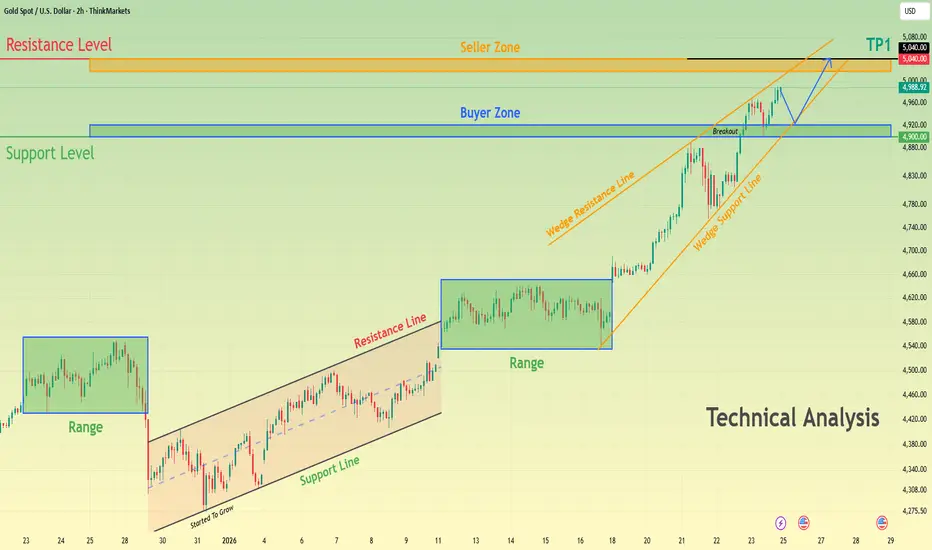
Gold Price Intraday Analysis – Key Resistance and Support LevelsThis chart provides an intraday analysis of gold prices, highlighting critical levels for potential price action. Key zones include Trendline Resistance at 5,108.974, a Minor Resistance at 5,077.929, and a Support Zone at 5,040.216, where price could potentially bounce. The Key Support Level at 4,98

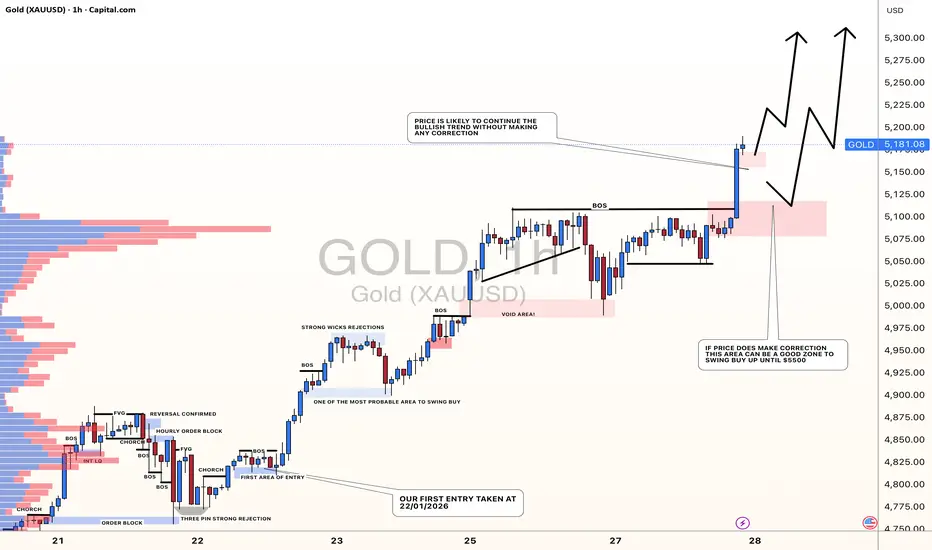
GOLD: Detailed View, Is Price Heading Towards $5500?Gold overview!
After the price built up, we're seeing a strong bullish move. Our earlier analysis today didn't quite work out, but this one points to two key areas where the price might turn around. The first zone is probably the better entry, since the market will open with a gap up and fill it b
XAUUSD Long: Consolidation Before the Next Impulsive MoveHello traders! Here’s a clear technical breakdown of XAUUSD (1H) based on the current chart structure. Gold is trading within a strong and well-defined ascending channel, confirming a sustained bullish trend supported by consistent higher highs and higher lows. This structure reflects strong buyer d

Gold Compressing Near Resistance Ahead of Potential BreakoutHello traders! Here’s my technical outlook on XAUUSD (3H) based on the current chart structure. Gold has been trading in a strong bullish trend, clearly defined by a rising structure that started after a prolonged consolidation phase. Initially, price moved sideways within a well-marked range, signa

Silver XAG/USD - Breakout + Retest Signals Upside Continuation📝 Description🔍 Setup (Market Structure) FX:XAGUSD
XAG/USD is forming a well-defined Triangle Breakout pattern on the M30 timeframe.
After a strong bullish move, price consolidated with lower highs and higher lows, compressing volatility — a classic sign of an upcoming expansion.
Price has now b

Gold Price Outlook – Bullish Bias Above 5110Gold Currently, price action is consolidating within a narrow range between 5050 and 5100, signalling indecision while the market waits for a breakout.
Gold remains supported by strong safe-haven demand, driven by rising geopolitical tensions, border conflicts, and broader global uncertainty. Altho

NQ Short (01-28-26)Fed Day and the stage is set for a decent drop test or rip lower. As usual I may be 1 day or so early with the Short call (yesterday), staying with it today. What to look at is how/when we got here. Mostly O/N after narrow sideways PA in the Reg (not normal or strange Bull). Why so much in the off s

When Fear Returns, Gold Speaks AgainHello everyone,
After many years of following and trading gold through crises, geopolitical tensions, and major shifts in monetary policy, I have always viewed gold as a barometer of market psychology. And what the H4 chart of XAUUSD is showing right now feels very familiar: fear is starting to o

See all futures ideas
EURUSD 3M CLS range - I Potential high of the yearWe have seen last six months of consolidation, recently in the COT data we could see 10 years extreme long positions and since then the longs been closed and shorts are growing which suggest that market makers has been preparing for this manipulation. As predicted in this previous idea. Now above

EURUSD: Corrective Pullback After Strong Bullish ImpulseHello everyone, here is my breakdown of the current EURUSD setup.
Market Analysis
EURUSD has been trading within a well-defined upward channel, which reflects a strong bullish structure over the higher timeframe. Price has consistently respected the channel boundaries, forming higher highs and hi

USDCAD Weekly Reversal Confirmed as Key Structure BreaksUSDCAD Weekly Reversal Confirmed as Key Structure Breaks
USDCAD broke out of a weekly Head and Shoulders pattern. Overall it is a very ugly reversal pattern. However, the most interesting area here is the weekly structure that was broken out.
Today we have the FOMC and Bank of Canada Interest rat

AUD/USD: 90% of Traders Are Short… and Price Keeps RallyingAUD/USD has completed a clean and impulsive breakout above a major daily supply zone, which is now acting as structural support. This move marks a clear regime shift from the previous consolidation phase into a trend continuation environment.
From a price action perspective, the daily chart shows a

AUDNZD is Nearing a Strong Support AreaHey Traders, in today's trading session we are monitoring AUDNZD for a buying opportunity around 1.15900 zone, AUDNZD is trading in an uptrend and currently is in a correction phase in which it is approaching the trend at 1.15900 support and resistance area.
Trade safe, Joe.

USDCAD Price Update – Clean & Clear ExplanationUSDCAD Price is currently trading inside a descending channel, showing an overall short-term bearish structure. The market recently bounced from a lower demand zone (~1.3550–1.3560) and pushed back toward the mid / upper channel resistance around 1.3585–1.3600.
A clean breakout and hold above the d

EURUSD Short: Fake Breakout at Supply, Pullback to 1.1850Hello traders! Here’s a clear technical breakdown of EURUSD (4H) based on the current chart structure. EURUSD initially traded within a well-defined ascending channel, confirming a strong bullish environment with consistent higher highs and higher lows. This phase reflected clear buyer control and h

CADJPY: Swing Sell at the liquidity void area! Target 105! Dear traders,
I hope you’re doing well. We have a fantastic selling opportunity with the CADJPY pair. The price is approaching the liquidity gap and is likely to fill it. Once filled, we could see a reversal from that point. Our target is set at 105, but feel free to adjust your take profit based

EURUSD Reclaims Key Structure - Upside Toward 1.2050Hello traders! Here’s my technical outlook on EURUSD (2H) based on the current chart structure. After an extended consolidation phase, EURUSD initially traded within a clearly defined range, reflecting market indecision and balance between buyers and sellers. This ranging behavior laid the groundwor

28.01.26 Daily ForecastPairs on Watch -
FX:CADJPY
TVC:USOIL
A short overview of the instruments I am looking at for today, multi-timeframe analysis down to what I will be looking at for an entry. Enjoy!

See all forex ideas
| - | - | - | - | - | - | - | ||
| - | - | - | - | - | - | - | ||
| - | - | - | - | - | - | - | ||
| - | - | - | - | - | - | - | ||
| - | - | - | - | - | - | - | ||
| - | - | - | - | - | - | - | ||
| - | - | - | - | - | - | - | ||
| - | - | - | - | - | - | - |
Trade directly on Supercharts through our supported, fully-verified, and user-reviewed brokers.


