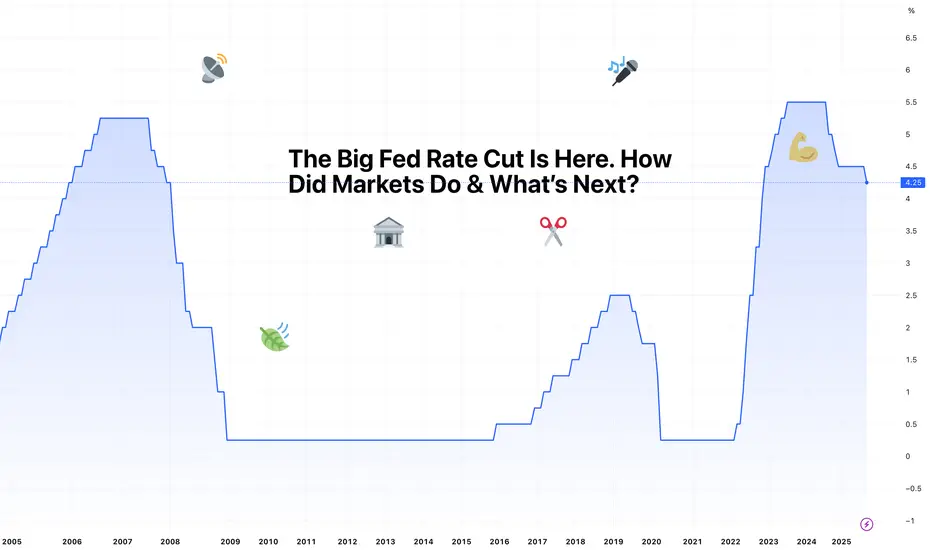
The Big Fed Rate Cut Is Here. How Did Markets Do & What’s Next?“ Best we can do is 25bps ,” officials, probably, when they gathered to lower the federal funds rate. It wasn’t the 50 basis points some of you had expected. But you also didn’t expect to hear that two more trims are most likely coming by year end.
Let’s talk about that and what it means for your

The best trades require research, then commitment.
Get started for free$0 forever, no credit card needed

Scott "Kidd" PoteetThe unlikely astronaut

Where the world does markets
Join 100 million traders and investors taking the future into their own hands.
Major indices
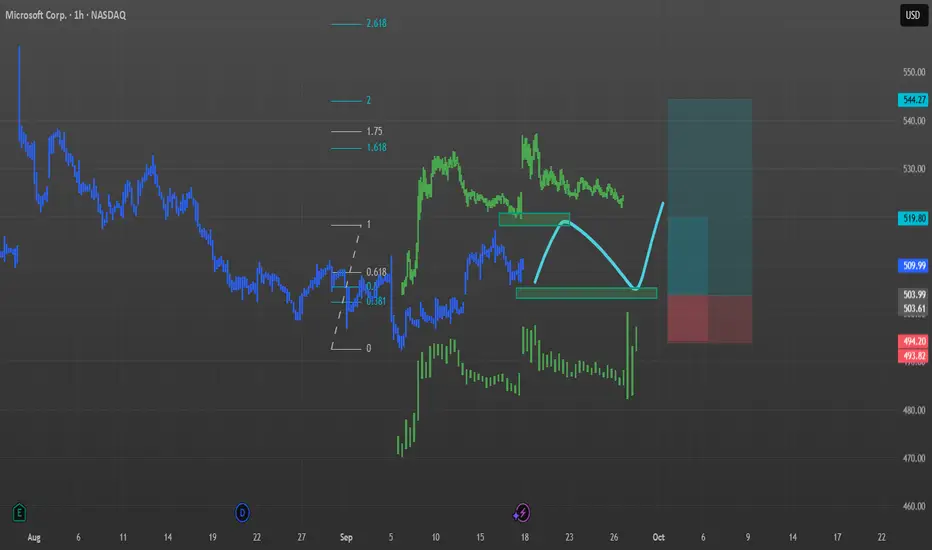
MSFT / MICROSOFT / Fractal and Seasonality inspiredHere is my view on MSFT from seasonal and fractal point of view.
Price gonna break the recent 516 high, shall turn and break recent 505 low than head upside for end of the year ralley.
i put 2 Longs into the chart. Smaller for first partial take profit and the larger one for rest.
All this should
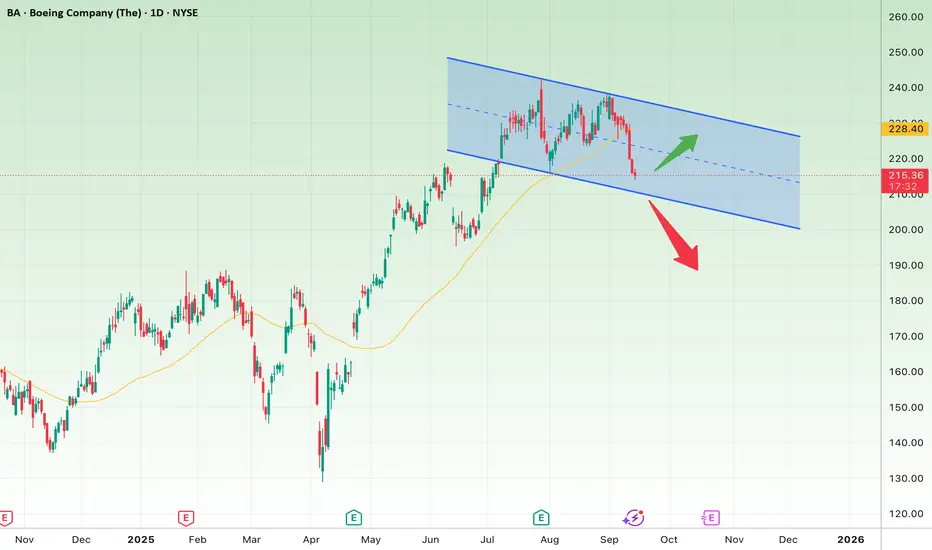
Professional Analysis of Boeing (BA) Stock – Daily TimeframeOn the daily chart, Boeing (BA) has entered a descending channel after a strong rally from the $175 lows up to around $240 highs.
Bullish Scenario:
The price is currently around $215, near the channel’s lower boundary.
If this support holds and the stock reclaims the 50-day moving average (yellow
Bitcoin - Will Bitcoin break out of range?!Bitcoin is above EMA50 and EMA200 on the four-hour timeframe and is in its ascending channel. If the downward trend continues towards the specified demand range, we can buy Bitcoin with appropriate risk-reward.
Bitcoin’s rise to around 121,000 and its arrival at the specified supply range will provi

The Golden Run Continues: XAUUSD Eyes $3800? The Golden Run Continues: XAUUSD Eyes $3800?
Prior Bullish Momentum & Consolidation : XAUUSD entered a period of consolidation following a robust bullish rally earlier in the year. This initial surge established a strong underlying demand.
Symmetrical Triangle Formation : This consolidation p

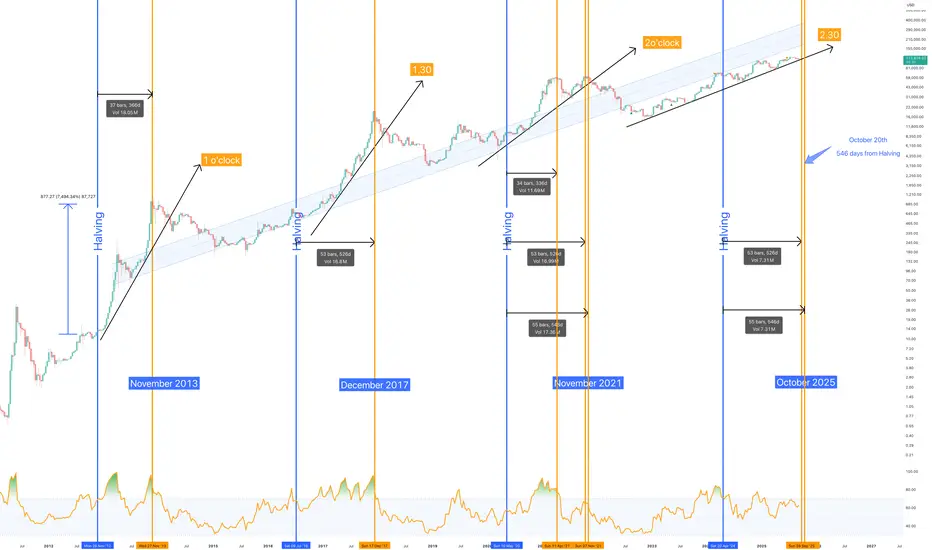
The end of Bitcoin…. begins in 40 days time @ ~$160k in Oct 2025** What the next 12 months will look like **
Let’s just start with a strong provocative title to raise the blood pressure.. “The end of Bitcoin”
…. with an explosion and then a slow erosion of relevance, that’s how.
Whether it withers through regulation, succumbs to its own technological limits
Why Ethereum is Outperforming Bitcoin? | FX ResearchWhile Bitcoin did manage to push to a fresh record high, the broader august trend reflected cautious investor sentiment, supported by modest momentum and ongoing macro uncertainty. The narrative suggests price resilience, but without the forcefulness needed for the next wave of bullish momentum.
I

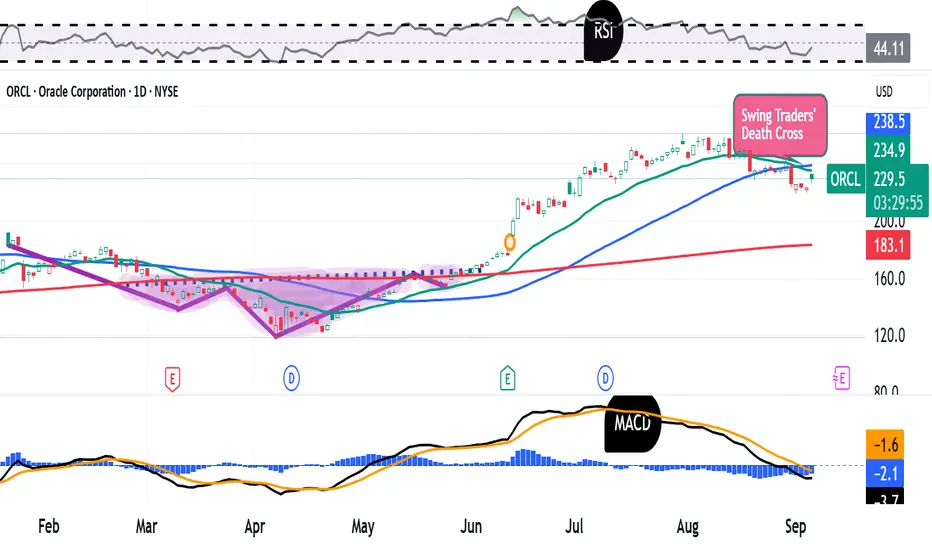
Oracle Is Up 80% Since April. What Does Its Chart Tell Us?Oracle NYSE:ORCL will release fiscal Q1 results next week at a time when the tech giant's stock has risen more than 80% from its April lows, but also given back some 15% since hitting a 52-week high in late July. Let's see what the stock's technical and fundamental analysis can tell us.
Oracle's
Long bond bulls’ eye bigger breakoutThe bullish move in U.S. ultra-long bond futures anticipated last week has played out nicely, with the contract surging higher over the subsequent days, taking out a key topside hurdle comprising the 200DMA and horizontal resistance at 119’19. The move has now stalled at a downtrend from the highs s

Downtrend in Dell?Dell Technologies has lagged the market for months, and some traders may see further downside in the maker of computer hardware.
The first pattern on today’s chart is the bearish gap on August 29 following quarterly results. While earnings and revenue beat estimates, investors focused on weaker mar

See all editors' picks ideas
Liquidity Void Detector (Zeiierman)█ Overview
Liquidity Void Detector (Zeiierman) is an oscillator highlighting inefficient price displacements under low participation. It measures the most recent price move (standardized return) and amplifies it only when volume is below its own trend.
Positive readings ⇒ strong up-move

Volume by Time [LuxAlgo]The Volume by Time indicator collects volume data for every point in time over the day and displays the average volume of the specific dataset collected at each respective bar.
The indicator overlays the current volume and the historical average to allow for better comparisons.
🔶 USAGE
Thr

FlowScope [Hapharmonic]FlowScope: Uncover the Market's True Intent 🔬
Ever wished you could look inside the candles and see where the real action is happening? FlowScope is your microscope for the market's flow, designed to give you a powerful edge by revealing the volume distribution that price action alone can't sh

VWAP Price ChannelVWAP Price Channel cuts the crust off of a traditional price channel (Donchian Channel) by anchoring VWAPs at the highs and lows. By doing this, the flat levels, characteristic of traditional Donchian Channels, are no more!
Author's Note: This indicator is formed with no inherent use, and serves

Fibonacci Sequence Circles [BigBeluga]🔵 Overview
The Fibonacci Sequence Circles is a unique and visually intuitive indicator designed for the TradingView platform. It combines the principles of the Fibonacci sequence with geometric circles to help traders identify potential support and resistance levels, as well as price expansio

ATAI Volume Pressure Analyzer V 1.0 — Pure Up/DownATAI Volume Pressure Analyzer V 1.0 — Pure Up/Down
Overview
Volume is a foundational tool for understanding the supply–demand balance. Classic charts show only total volume and don’t tell us what portion came from buying (Up) versus selling (Down). The ATAI Volume Pressure Analyzer fills that g

Market Cap Landscape 3DHello, traders and creators! 👋
Market Cap Landscape 3D. This project is more than just a typical technical analysis tool; it's an exploration into what's possible when code meets artistry on the financial charts. It's a demonstration of how we can transcend flat, two-dimensional lines and step into

ZigzagLiteLibrary "ZigzagLite"
Lighter version of the Zigzag Library. Without indicators and sub-component divisions
method getPrices(pivots)
Gets the array of prices from array of Pivots
Namespace types: Pivot
Parameters:
pivots (Pivot ) : array array of Pivot objects
Returns: array array

ZigzagLibrary "Zigzag"
Zigzag related user defined types. Depends on DrawingTypes library for basic types
method tostring(this, sortKeys, sortOrder, includeKeys)
Converts ZigzagTypes/Pivot object to string representation
Namespace types: Pivot
Parameters:
this (Pivot) : ZigzagTypes/Pivot

Angled Volume Profile [Trendoscope]Volume profile is useful tool to understand the demand and supply zones on horizontal level. But, what if you want to measure the volume levels over trend line? In trending markets, the feature to measure volume over angled levels can be very useful for traders who use these measures. Here is an att

See all indicators and strategies
Community trends
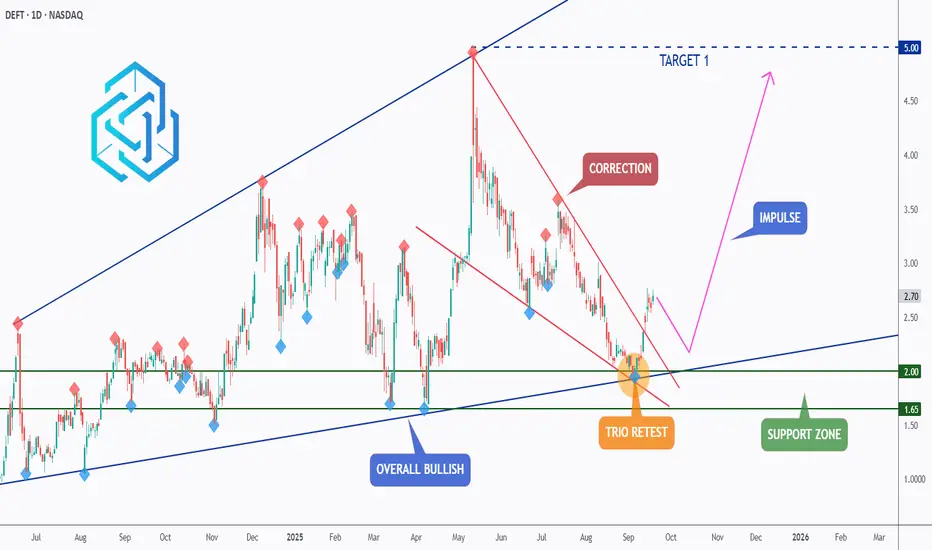
DEFT - Trio Retest Sets the Stage for a Bullish Impulse!DeFi Technologies ( NASDAQ:DEFT ) is carving out a rare role as a public, regulated gateway to DeFi.
With nearly US$974M AUM through its Valour platform (as of Aug 29, 2025, with US$91.7M YTD net inflows), strong profitability, and a 10% buyback program running until Aug 2026 , DEFT is positio
Adobe - The major triangle breakout!🎯Adobe ( NASDAQ:ADBE ) breaks out soon:
🔎Analysis summary:
For the past five years, Adobe has overall been consolidating within a bullish triangle pattern. This triangle seems to be quite similar to the triangle which we saw back in 2012. And with the current retest of the confluence of suppo

TSLA path to 550/650 USD Breakout Still Pending🔥 What specifically drives TSLA into 550–650
📦 Deliveries + mix surprise
If unit volumes beat whisper numbers and mix favors higher-trim/FSD attach, you get more gross profit per vehicle without needing price hikes. Watch the cadence of regional incentives and shipping vectors; strong NA/EU mix

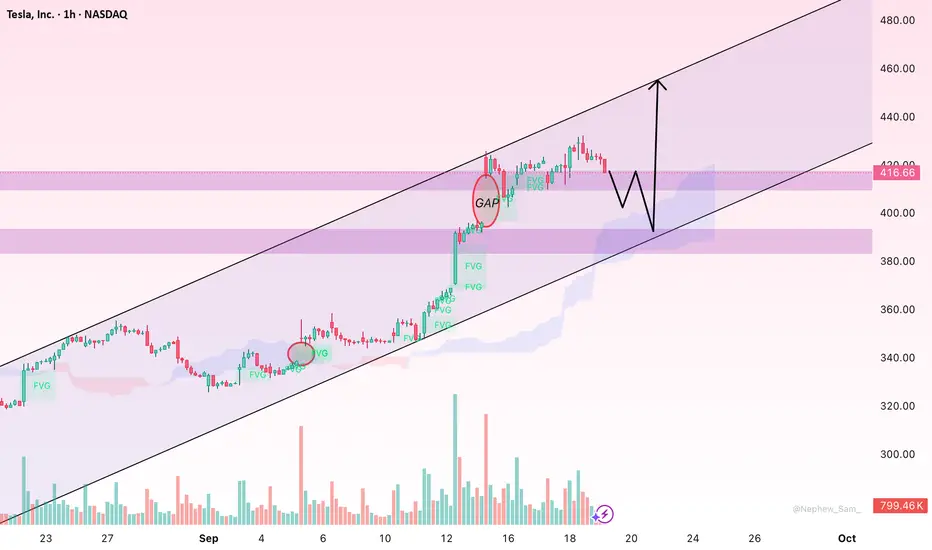
TSLA: Mild Pullback but Uptrend Remains IntactHello everyone,
Tesla’s share price (TSLA) slipped slightly today, closing at 416.66 USD, down 5.78 USD or 1.37% compared to the previous session’s high. After a strong rally earlier, the market is now watching closely to see whether Tesla can sustain its upward momentum or enter a deeper correcti
Cleanspark upside potentialWhen the 50ma (Blue) moves up through the 200ma (red) twice since inception.
Potential upside 987% during the 2021 bull run, 464% early 2024.

9/18/25 - $rgti - I'm degen short this thing9/18/25 :: VROCKSTAR :: NASDAQ:RGTI
I'm degen short this thing
- when a $6M (wink, nod) contract gets "announced" and we ape $600M in market cap is the time to pull the degen short out of my box.
- i have exactly 2 positions in this make-no-sense-market
- i'm long OTC:OSOL at 35% discount to so

COIN breaks above $337, gap fill toward $380Gap fills typically refer to price movements that "fill" previous gaps on the chart—often caused by earnings surprises or macro events. Based on historical price action
Note - If COIN breaks above $337 and sustains momentum, gap fill toward $375–380 is plausible in the near term.

$NVDA: Structural Extension🏛️ RESEARCH NOTES
Rejections at highs look way too systematic. I also see drop in average %𝜟 of both parties at local top of ongoing wave.
⚖️ That means we can extend this structure to cover the possible compression (otherwise the escape).

UiPath BuyFits wyckoff accumulation perfectly and think this will run up until earnings are a heavy sell off. Targets are on the chart provided using volume profile.

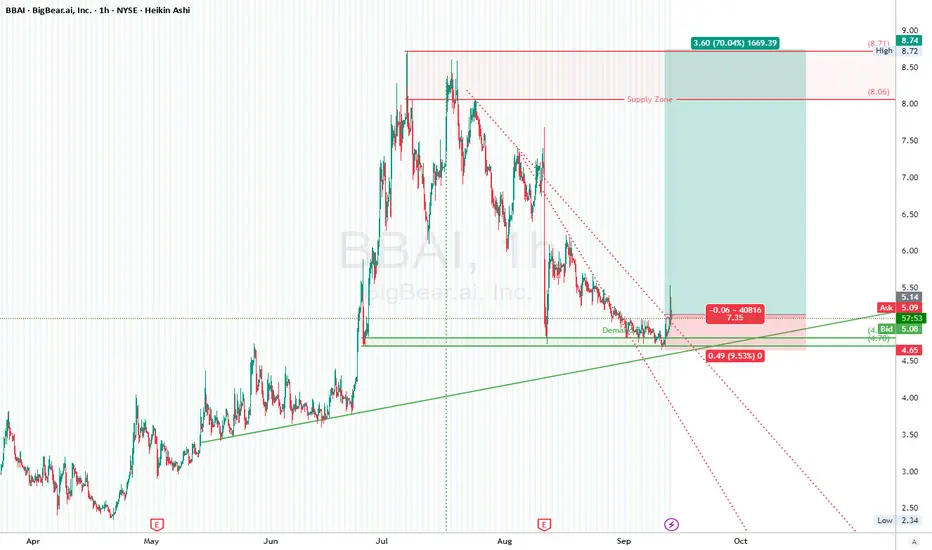
BBAI (BigBear.ai Inc.) 1H TF Long Setup
BBAI printed a strong impulsive move back in June–July, rocketing from the $2.30s to highs of ~$8.70. This parabolic leg showed heavy momentum and FOMO-driven inflows. Since topping out in early July, the stock retraced deeply into a corrective descending channel, printing lower highs and lower low
See all stocks ideas
Today
ANEBAnebulo Pharmaceuticals, Inc.
Actual
—
Estimate
−0.07
USD
Today
LITSLite Strategy, Inc.
Actual
—
Estimate
—
Today
BNEDBarnes & Noble Education, Inc
Actual
—
Estimate
—
Today
INMInMed Pharmaceuticals Inc.
Actual
—
Estimate
—
Today
IXHLIncannex Healthcare Inc.
Actual
—
Estimate
−0.29
USD
Today
NCPLNetcapital Inc.
Actual
—
Estimate
−0.34
USD
Today
GMGIGolden Matrix Group, Inc.
Actual
—
Estimate
−0.00
USD
Today
MNYMoneyHero Limited
Actual
0.00
USD
Estimate
−0.02
USD
See more events
Community trends
Bitcoin - New rising wedge, you must see! 127k, then drop to 85kI am the first human on the internet to share with you this rising wedge pattern that is currently forming on Bitcoin. As you know, rising wedges are in general bearish patterns, so you can expect a pretty strong downtrend after this pattern is formed. But right now Bitcoin is strong, and I expect a

$SOLANA 250+ or bearish trend to 225/200With the recent solana pump, major profits have been taking place.
However, SOL stopped out at 249. Just under the Psychological level of 250.
On this chart we can see the following:
- Supply & Demand
- Anchored Volume
- Pattern: BF / BC /SR
- Two 4 hour FVG's below price, with HTF GP on the seco

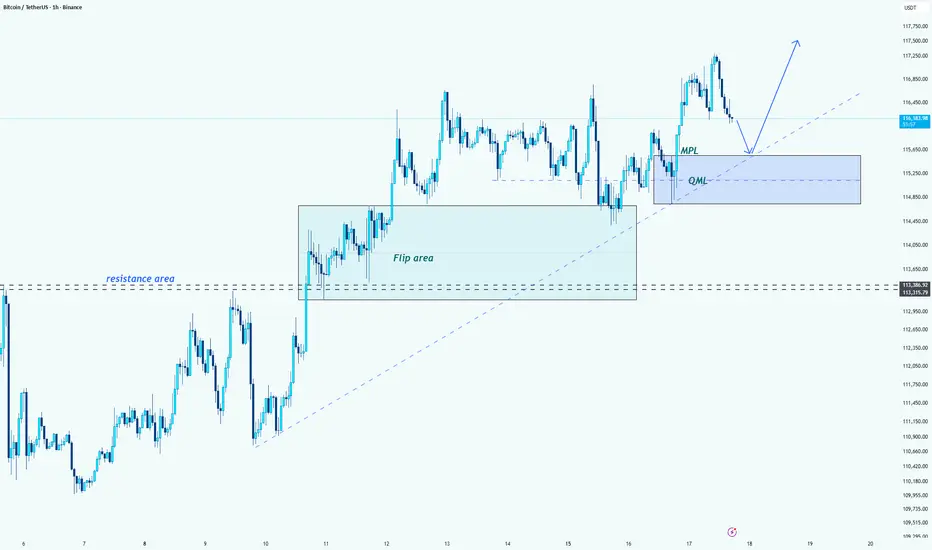
Bitcoin (BTC/USDT) -> MPL and QML AnalysisHello guys!
Let's analyze btc!
⚡ Trading Strategy
MPL Level: 115,000 should be tested before the price rises, so wait for confirmation here before entering long positions.
Target: The next major target for the uptrend is around 117,500.
--------------------
📈 Outlook
Bullish: If price holds ab
TradersCity Pro | LINK Eyes Fresh Rally From Critical Support👋 Welcome to TradeCity Pro!
In this analysis, I’m going to review LINK, one of the RWA coins with a market cap of $16.41 billion, currently ranked 12th.
📅 Daily Timeframe
On the daily chart, after getting support around 11.55, LINK started an upward move and in its first wave rallied up to 26.73.

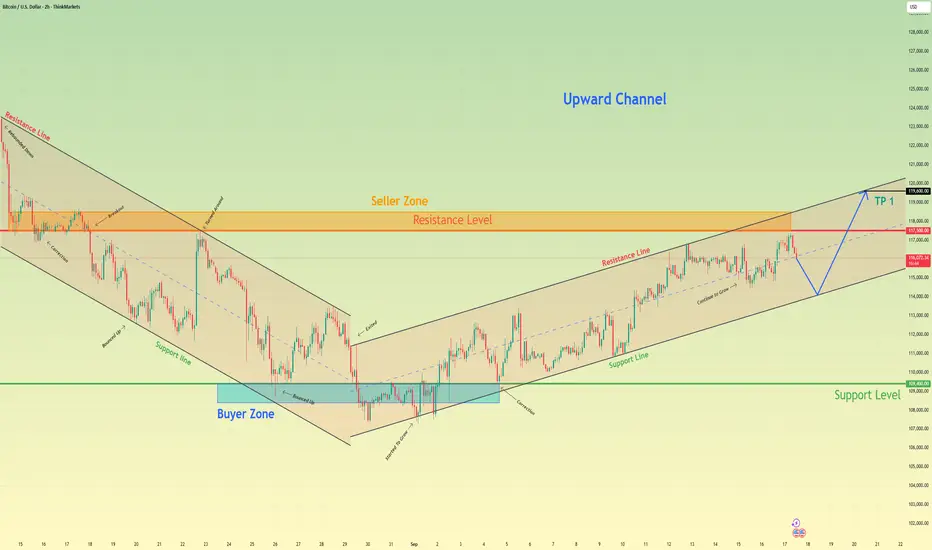
Bitcoin will break resistance level and continue to move upHello traders, I want share with you my opinion about Bitcoin. The market dynamic for Bitcoin has undergone a significant shift, with the prior bearish trend being invalidated by a strong breakout from a downward channel. This reversal has established a new bullish market structure, with the price a
BTC: From Triangle to Flag → 118K?Let's take a look at the recent market context. Bitcoin climbed aggressively, creating a powerful impulsive leg upward.
That rally formed the pole of our bullish flag, a clear continuation pattern.
After that, price consolidated, shaping a tight, downward-sloping flag, while overall momentum stayed

Litecoin - LTC HUGE Upside Likely MID TERM (6 months)Litecoin has always been one of the giants of crypto, although it's growing slower than before.
This is likely due to all the innovation in the market, newer alts with better offerings etc.
However - LTC can, and will still be traded or many years to come. This is just because whales will trade al

BTCUSD Respecting Trendline – Eyes on Resistance ZoneBitcoin is maintaining its bullish structure, respecting the ascending trendline on the daily chart. Price recently reacted from the support zone and is now consolidating near 116,000. As long as the trendline holds, a potential move toward the resistance area around 122,000 – 124,000 remains in pla

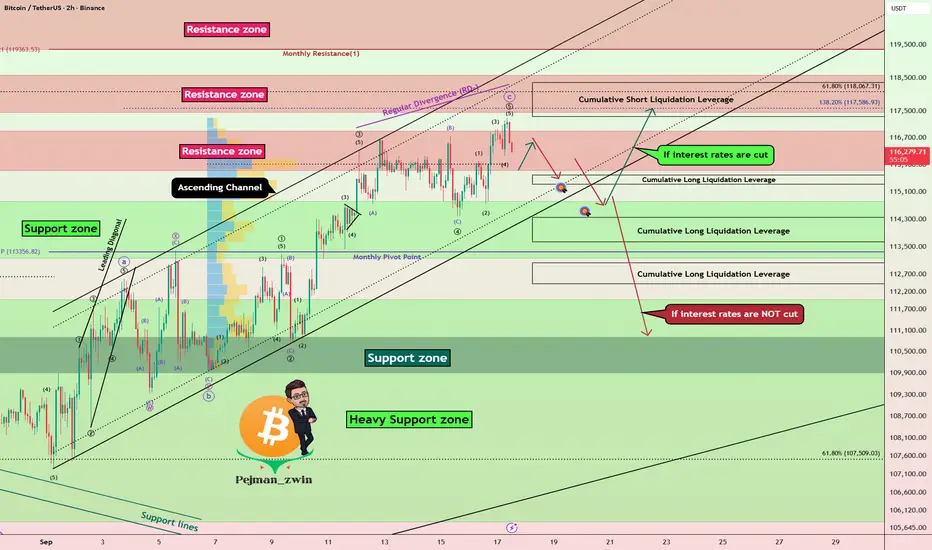
FOMC Day: Prepare for Potential Bitcoin Volatility!Today is a big day for the markets – the US Federal Funds Rate decision and the FOMC Press Conference are scheduled, events that could potentially change the game for Bitcoin ( BINANCE:BTCUSDT ) and other assets .
But until the meeting begins , we still have time to analyze the charts and
Just Printed BTC - The Raid & Retrace Pattern - PaysPrice slammed lower in one big displacement — that’s the raid. Late sellers jumped in at the bottom, but they’re trapped. Then you get that slow, curvy retrace back up. That’s not strength; it’s inducement. Smart money uses those eager buyers to exit and reload shorts. Unless price reclaims the disp

See all crypto ideas
Lingrid | GOLD Potential Pullback from 3700 Psychological LevelOANDA:XAUUSD faced rejection at the 3,700 resistance zone, signaling exhaustion in the recent bullish leg. The divergence at the highs supports a potential reversal, with price already slipping back toward the mid-range of the upward channel. If momentum continues lower, a breakdown under 3,635 cou

GOLD → Rates have been cut. Will growth continue?FX:XAUUSD , following the Fed's decision on interest rates, caused a shock, updating the ATH to 3707, then updating the minimum to 3633. Since the opening of the European session, the market has been recovering, but there is a BUT...
The Fed's Dot Plot confirmed the forecast of two additional

XAU/USD | GOLD ATH at $3,707, Then Heavy Dump – What Happend?By analyzing the gold chart on the 1-hour timeframe, we can see that after the Fed rate cut announcement, the price first dropped from $3,686 to $3,649, stopping out many buyers. Then, gold rallied sharply, gaining 570 pips up to $3,707 and printing a new ATH, which stopped out sellers. After that,
XAUUSDHello Traders! 👋
What are your thoughts on GOLD?
Gold pulled back after printing a fresh high and reacting to the latest FOMC meeting. It has since broken below key support and also violated its ascending trendline.
In the short term, price action is expected to remain range-bound to bearish, head

Latest Gold Price Update Today👋Hello everyone, let's take a look at OANDA:XAUUSD !
Yesterday, gold experienced a volatile trading session after the Federal Reserve (Fed) concluded its September meeting and decided to cut the benchmark interest rate by 0.25%, as expected. The reference interest rate is now at 4-4.25% per year

Gold can continue its bullish trend after small correctionHello traders, I want share with you my opinion about Gold. The market context for Gold has been firmly bullish since the price broke out of its prior consolidation range, a move that originated from the deep 3270 - 3290 buyer zone. This breakout shifted the market structure, initiating a new impuls

Gold 30Min Engaged ( Bullish Movement Detected )Time Frame: 30-Minute Warfare
Entry Protocol: Only after volume-verified breakout
🩸Bullish Movement From : 3665
➗ Hanzo Protocol: Volume-Tiered Entry Authority
➕ Zone Activated: Dynamic market pressure detected.
The level isn’t just price — it’s a memory of where they moved size.
Volume is rising
Gold After Fed Decision: Buy the Rumor, Sell the News?Gold ( OANDA:XAUUSD ) seems to have caught many traders by surprise, as many thought it would continue to create new daily All-Time High(ATH) with the Federal's interest rate announcement , but Gold followed the adage " Buy the rumour, sell the news ".
Gold started moving emotionally yes

GOLD 4H CHART ROUE MAP UPDATEHey Everyone,
4H Chart Update
Yesterday we completed 3655 and 3696, noting that price would likely range between these two levels until we saw an EMA5 cross and lock to confirm the next move.
As expected, we continued to see bounces within this range allowing us to catch clean bounces. Now, we ar

XAUUSD Reversal Signs Grow – Bears Eye 3620/3570In yesterday’s analysis, I pointed out that while OANDA:XAUUSD remains technically bullish, the signs of a potential reversal were already piling up.
That view played out quickly: after spiking above 3700 on the Fed’s decision — which triggered my sell orders — gold reversed sharply, dropping all

See all futures ideas
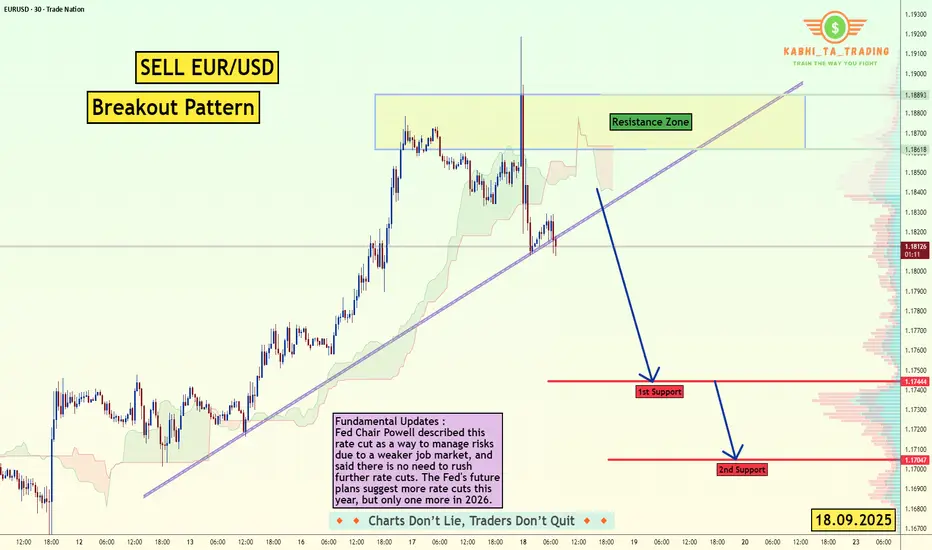
EUR/USD - Fundamental Move (18.09.2025)The EUR/USD Pair on the M30 timeframe presents a Potential Selling Opportunity due to a recent Formation of a Breakout Pattern.
This suggests a shift in momentum towards the downside in the coming hours.
Possible Short Trade:
Entry: Consider Entering A Short Position around Trendline Of The Pa
USDJPY consolidating near resistance, showing sideways movementUSDJPY The pair is currently consolidating near resistance, showing sideways movement within a defined range. Price action has been bouncing between support and resistance, with repeated rejections at resistance levels A break below support would provide stronger confirmation for bearish momentum. U

EUR/USD - Rising Wedge Breakout @ H1 CMCMARKETS:EURUSD EUR/USD - Wedge Pattern Strong breakout - @ H1 with high volume. Expecting Strong Bearish outlook today and Fundamental also play major role today.
"The Fed is still signalling more rate cuts, but at the same time still sees okay growth, which is a positive combination for shar

NZDCAD: Massive BreakoutThe probability of a further decline in 📉NZDCAD is elevated.
The breach of a key daily demand cluster provides strong bearish signals.
The subsequent support level is projected at 0.8074.

GBPAUD – Breakout from Descending Triangle StructureOn the 2H chart, GBPAUD has broken above the descending trendline after forming a clear descending triangle near support. Multiple BOS (Break of Structure) and ChoCH movements suggest momentum shift.
📊 Key Levels:
Support Zone: 2.0400 – 2.0430
Trendline Breakout: Around 2.0500
Upside Potential:

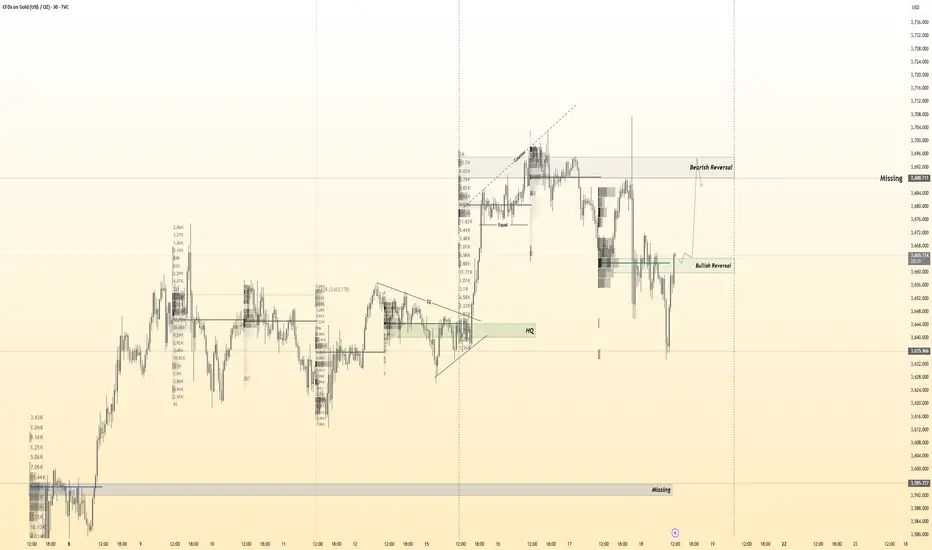
Euro can Bounce From Wedge Support and Rally to 1.1930Hello traders, I want share with you my opinion about Euro. The market for the Euro has transitioned from a clear trending phase into a more complex corrective structure after the prior upward channel failed to sustain its momentum. Following a significant rejection, the price broke down and underwe

GBP/JPY (4H timeframe):GBP/JPY (4H timeframe):
The pair is currentl trading around 200.67.
My drawn an ascending trendline, which looks recently broken to the downside.
Two red zones (support/target areas) are marked:
1. First target zone: around 199.000 – 199.300
(this is the first support level where price may reac

USDJPY Price AnalysisUSDJPY Price Analysis
Price bounced strongly from the support zone near 146.00, showing buyers are still active there.
Current structure suggests the pair could build support before moving higher.
First resistance/ target is around 148.80.
If momentum continues, the next levels to watch are 149.

Diamond Shift, Channel in Play!Price action recently formed a diamond pattern right at the intersection of two channels, a high-probability area for a shift in direction.
The diamond acted as a turning point, and from there, price shifted into a new phase: the creation of an ascending channel.
Within this structure, we can clear

GBP/USD: Continuing Downtrend or Seeking Reversal?Hello everyone,
Today GBP/USD experienced a sharp decline, currently at 1.35384, down 31 pips from the previous session high of 1.35428. The chart shows a clear weakening trend as the pair approaches a significant support zone.
The main reason comes from profit-taking pressure after the previous

See all forex ideas
| - | - | - | - | - | - | - | ||
| - | - | - | - | - | - | - | ||
| - | - | - | - | - | - | - | ||
| - | - | - | - | - | - | - | ||
| - | - | - | - | - | - | - | ||
| - | - | - | - | - | - | - | ||
| - | - | - | - | - | - | - | ||
| - | - | - | - | - | - | - |
Trade directly on the supercharts through our supported, fully-verified and user-reviewed brokers.


