ANFIBO | BTCUSD Analysis – Weekly Trading PlanHi guys! It's me, Anfibo. My plan last week gave us a good profit selling from 118,000 USD to 115,000 USD.
And over the past weekend, BITSTAMP:BTCUSD consolidated in a sideways range, consistently holding above key support. However, with the opening of the new week’s Daily candle, the market deci

The best trades require research, then commitment.
Get started for free$0 forever, no credit card needed

Scott "Kidd" PoteetThe unlikely astronaut

Where the world does markets
Join 100 million traders and investors taking the future into their own hands.
Major indices

NIKE BREAKDOWN (NKE)...POTENTIAL LONG OPPORTUNITYHey hey Tradingview family!!! Joseph here AKA JosePips! Just wanted to come on this week and do a breakdown on the company Nike & what I see technically potentially happening next on this stock! In this video you will get a in depth breakdown of
1. Overall price action structure/context
2. Momentu

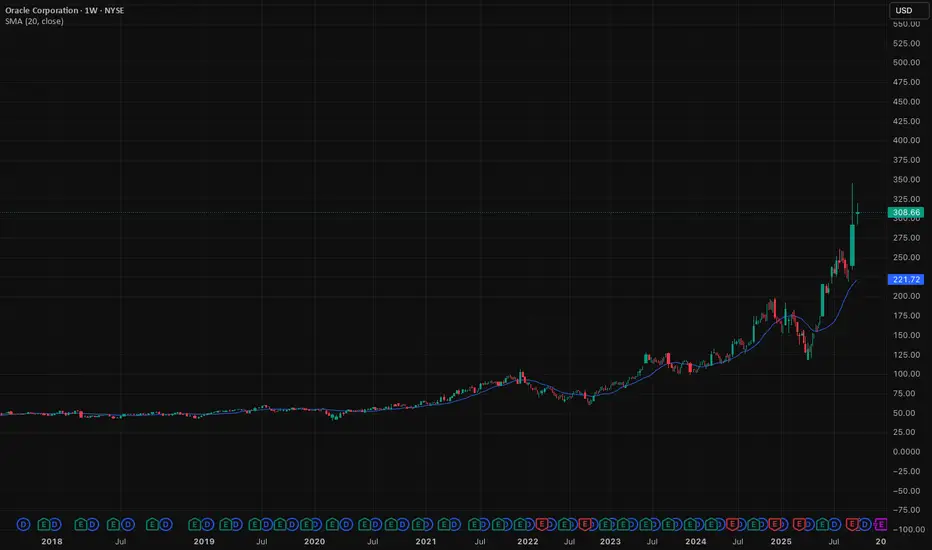
Oracle's surge is a bull market warningOracle has become the latest torch bearer of this market’s fever. A sharp, double-digit jump in days. Not because of numbers on a balance sheet, but because of mood. Sentiment is running wild, and traders are piling in.
These are the signs of caution experienced traders take during bull markets.
T
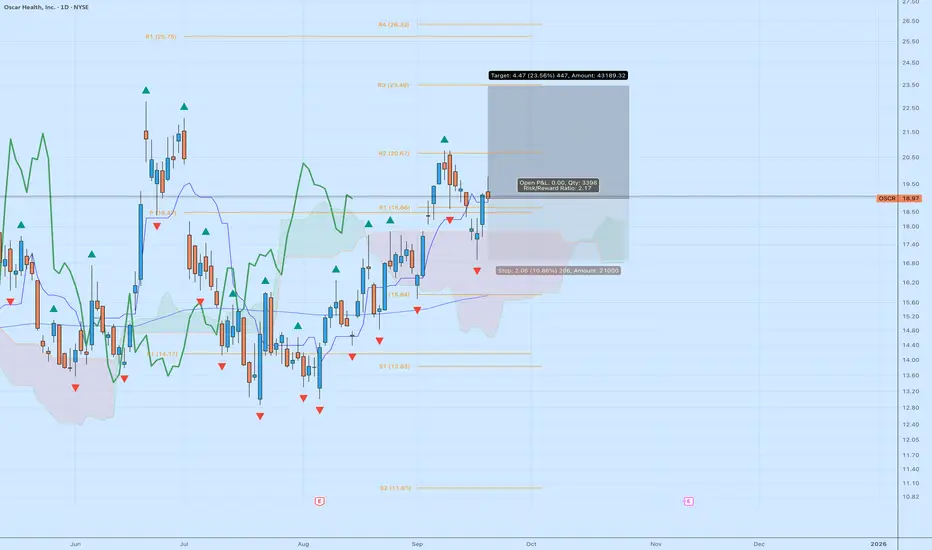
Oscar Health (OSCR) – Risk/Reward Setup Worth WatchingI’m tracking a long setup on NYSE:OSCR after a strong recovery trend that has been quietly building since the summer. It’s carving out a technical structure that offers a clean risk/reward.
Company Context
Oscar Health is a tech-driven health insurance company that’s been rebuilding its story i
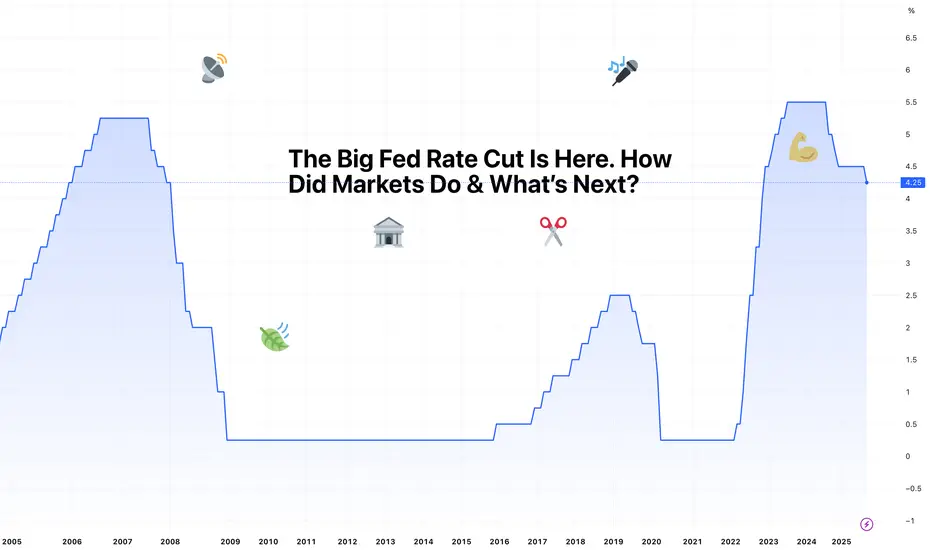
The Big Fed Rate Cut Is Here. How Did Markets Do & What’s Next?“ Best we can do is 25bps ,” officials, probably, when they gathered to lower the federal funds rate. It wasn’t the 50 basis points some of you had expected. But you also didn’t expect to hear that two more trims are most likely coming by year end.
Let’s talk about that and what it means for your
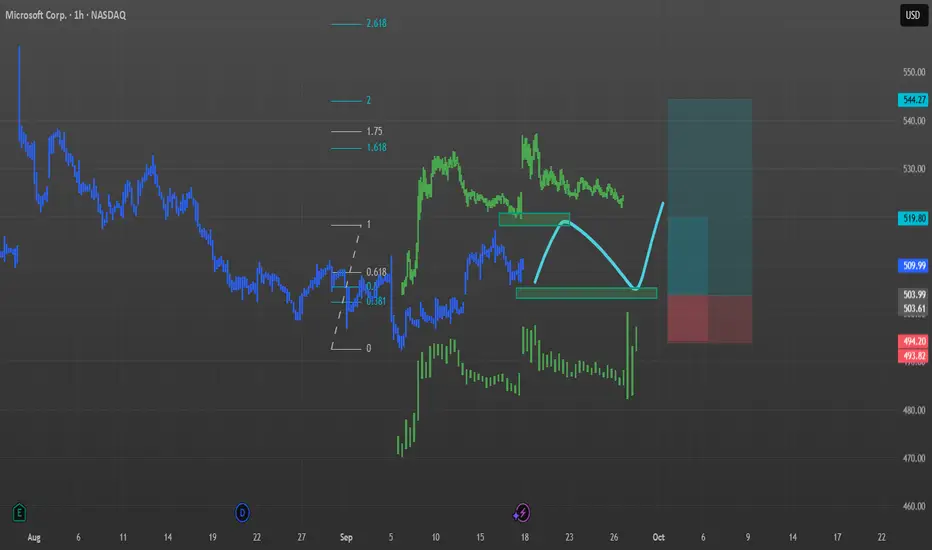
MSFT / MICROSOFT / Fractal and Seasonality inspiredHere is my view on MSFT from seasonal and fractal point of view.
Price gonna break the recent 516 high, shall turn and break recent 505 low than head upside for end of the year ralley.
i put 2 Longs into the chart. Smaller for first partial take profit and the larger one for rest.
All this should
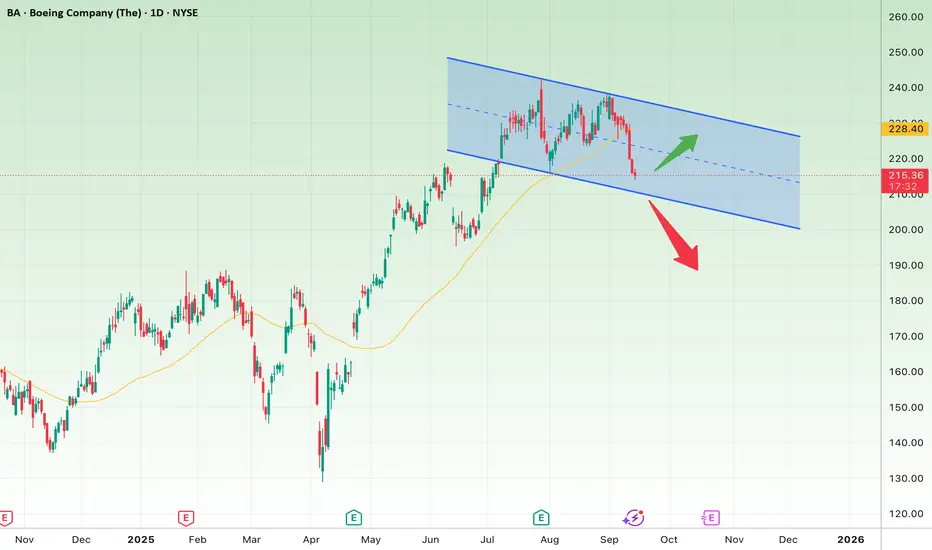
Professional Analysis of Boeing (BA) Stock – Daily TimeframeOn the daily chart, Boeing (BA) has entered a descending channel after a strong rally from the $175 lows up to around $240 highs.
Bullish Scenario:
The price is currently around $215, near the channel’s lower boundary.
If this support holds and the stock reclaims the 50-day moving average (yellow
Bitcoin - Will Bitcoin break out of range?!Bitcoin is above EMA50 and EMA200 on the four-hour timeframe and is in its ascending channel. If the downward trend continues towards the specified demand range, we can buy Bitcoin with appropriate risk-reward.
Bitcoin’s rise to around 121,000 and its arrival at the specified supply range will provi

The Golden Run Continues: XAUUSD Eyes $3800? The Golden Run Continues: XAUUSD Eyes $3800?
Prior Bullish Momentum & Consolidation : XAUUSD entered a period of consolidation following a robust bullish rally earlier in the year. This initial surge established a strong underlying demand.
Symmetrical Triangle Formation : This consolidation p

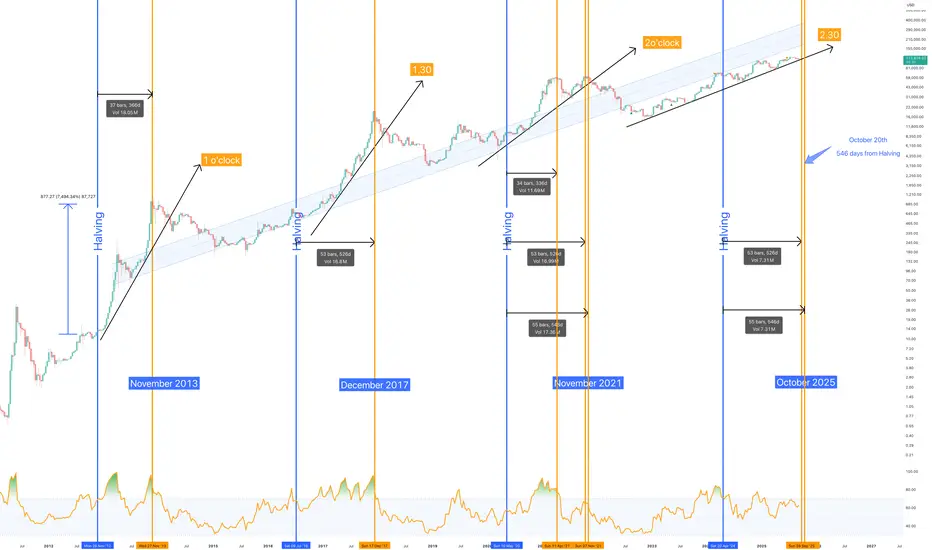
The end of Bitcoin…. begins in 40 days time @ ~$160k in Oct 2025** What the next 12 months will look like **
Let’s just start with a strong provocative title to raise the blood pressure.. “The end of Bitcoin”
…. with an explosion and then a slow erosion of relevance, that’s how.
Whether it withers through regulation, succumbs to its own technological limits
See all editors' picks ideas
FiniteStateMachine🟩 OVERVIEW
A flexible framework for creating, testing and implementing a Finite State Machine (FSM) in your script. FSMs use rules to control how states change in response to events.
This is the first Finite State Machine library on TradingView and it's quite a different way to think about your

Trading Activity Index (Zeiierman)█ Overview
Trading Activity Index (Zeiierman) is a volume-based market activity meter that transforms dollar-volume into a smooth, normalized “activity index.”
It highlights when market participation is unusually low or high with a dynamic color gradient:
Light Blue → Low Activity (thin p

Expected Value Monte CarloI created this indicator after noticing that there was no Expected Value indicator here on TradingView.
The EVMC provides statistical Expected Value to what might happen in the future regarding the asset you are analyzing.
It uses 2 quantitative methods:
Historical Backtest to ground your anal

Bar Index & TimeLibrary to convert a bar index to a timestamp and vice versa.
Utilizes runtime memory to store the 𝚝𝚒𝚖𝚎 and 𝚝𝚒𝚖𝚎_𝚌𝚕𝚘𝚜𝚎 values of every bar on the chart (and optional future bars), with the ability of storing additional custom values for every chart bar.
█ PREFACE
This library aims to tackle s

Liquidity Void Detector (Zeiierman)█ Overview
Liquidity Void Detector (Zeiierman) is an oscillator highlighting inefficient price displacements under low participation. It measures the most recent price move (standardized return) and amplifies it only when volume is below its own trend.
Positive readings ⇒ strong up-move

DeltaFlow Volume Profile [BigBeluga]🔵 OVERVIEW
The DeltaFlow Volume Profile builds a compact volume profile next to price and enriches every bin with flow context : bullish vs. bearish participation (%), a per-bin Delta % , an optional Delta Heat Map , and a PoC band with the bin’s absolute volume. This lets you see not just

Volume by Time [LuxAlgo]The Volume by Time indicator collects volume data for every point in time over the day and displays the average volume of the specific dataset collected at each respective bar.
The indicator overlays the current volume and the historical average to allow for better comparisons.
🔶 USAGE
Thr

FlowScope [Hapharmonic]FlowScope: Uncover the Market's True Intent 🔬
Ever wished you could look inside the candles and see where the real action is happening? FlowScope is your microscope for the market's flow, designed to give you a powerful edge by revealing the volume distribution that price action alone can't sh

VWAP Price ChannelVWAP Price Channel cuts the crust off of a traditional price channel (Donchian Channel) by anchoring VWAPs at the highs and lows. By doing this, the flat levels, characteristic of traditional Donchian Channels, are no more!
Author's Note: This indicator is formed with no inherent use, and serves

Fibonacci Sequence Circles [BigBeluga]🔵 Overview
The Fibonacci Sequence Circles is a unique and visually intuitive indicator designed for the TradingView platform. It combines the principles of the Fibonacci sequence with geometric circles to help traders identify potential support and resistance levels, as well as price expansio

See all indicators and strategies
Community trends
Oscar Health (OSCR) – Risk/Reward Setup Worth WatchingI’m tracking a long setup on NYSE:OSCR after a strong recovery trend that has been quietly building since the summer. It’s carving out a technical structure that offers a clean risk/reward.
Company Context
Oscar Health is a tech-driven health insurance company that’s been rebuilding its story i
I see big opportunity in QS stock!Hey Guys!, here is my prediction of the QuantumScape stock if its get us great news and more inovations in the future, i believing in this stock because of them new batterys and all of it what they do.
my Enter price was: 8,10$ and i am seeking for future 140$. Some people much talking here but ever

LULU BUY++++ At major support from pre covid 2019LULU I have always leaned towards shorting and longer term I am bearish on the consumer and economy however here, now, today is a buy here as it has hit major support going back to pre covid 2019. Targets are $201.40, $227.61 and $284.77

NIKE BREAKDOWN (NKE)...POTENTIAL LONG OPPORTUNITYHey hey Tradingview family!!! Joseph here AKA JosePips! Just wanted to come on this week and do a breakdown on the company Nike & what I see technically potentially happening next on this stock! In this video you will get a in depth breakdown of
1. Overall price action structure/context
2. Momentu
Soluna Holdings Inc The Stock completed ABC correction, and Wave C came as Ending Diagonal completed at 0.3806$ almost.
The type of Stock is Explosive Type where suddenly we can face Motive powerful Continuation up prices could reach 1st Target price of the Target of Wolfe wave at between 565$ - 678$ .
This stock is

BBAI - Analyse Update - Soon 8.50?Good Evening Everyone,
For this Weekend last one i would like to share is Analyse Update for BBAI - Big Bear AI
My previous analyse you can find it below:
It got the good support in 4.75 - 4.80 level and then gained approx %40 and get in the Trend channel again. Yellow path is from my previous an

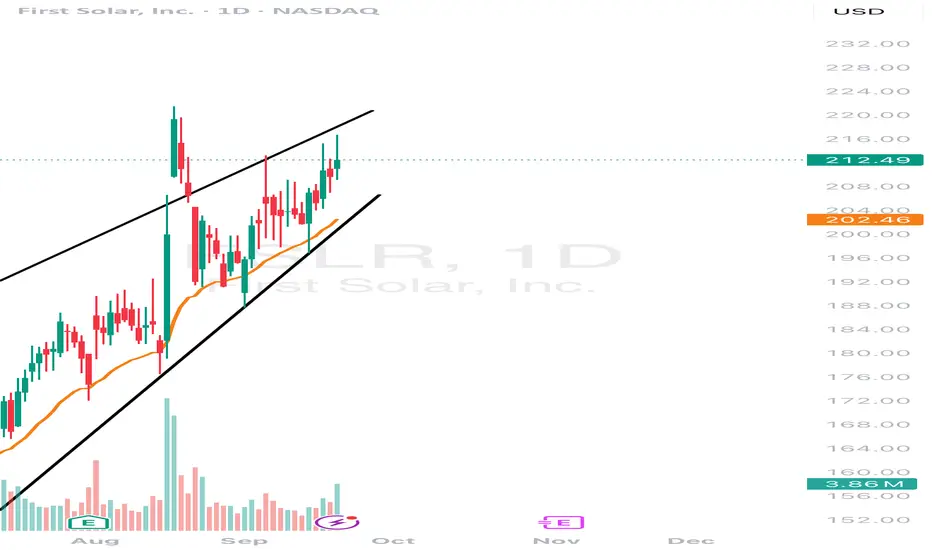
$FSLR - forming a tight channel breakoutNASDAQ:FSLR - stock getting tight on the channel. Stock in a steady uptrend channel. Possible breakout here above $215 resistance . $222 level break need for bigger uptrend move.
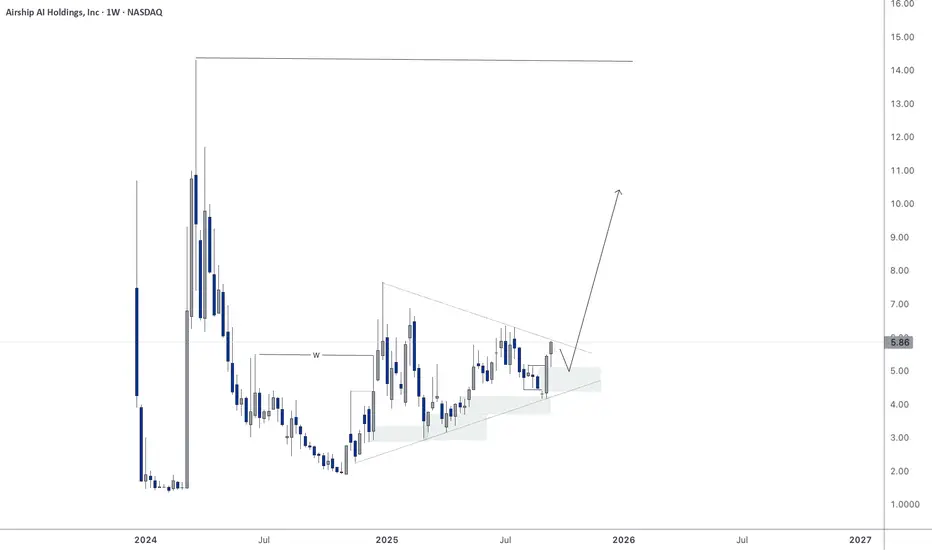
AISP | AI Security Play Ready to Break OutAISP (Airship AI Holdings) builds AI-powered platforms for video, sensor, and data surveillance — serving government, law enforcement, defense, and enterprise clients. Their tools help agencies and companies manage, analyze, and act on massive streams of data in real time.
On the chart, AISP is bre
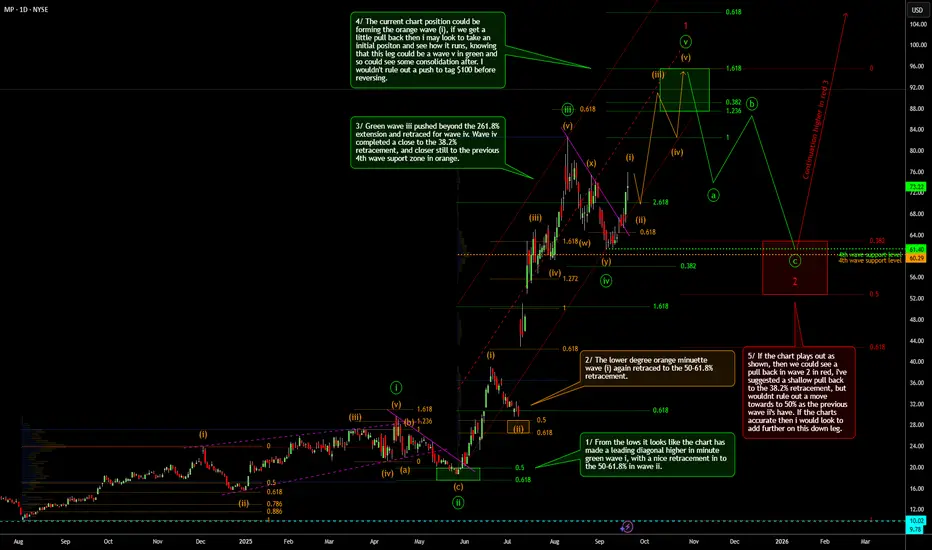
Daily Chart Outlook on MP Materials Corp.In this Daily chart outlook of NYSE:MP I'm looking for a continuation higher after breaking out of green wave iv. As the chart suggests I'm not ruling out a consolidation in red wave 2 assuming green wave v plays out. I don't hold a position but may take an initial position on any small pullback i
Oracle's surge is a bull market warningOracle has become the latest torch bearer of this market’s fever. A sharp, double-digit jump in days. Not because of numbers on a balance sheet, but because of mood. Sentiment is running wild, and traders are piling in.
These are the signs of caution experienced traders take during bull markets.
T
See all stocks ideas
Today
MRTMarti Technologies, Inc.
Actual
−0.31
USD
Estimate
−0.31
USD
Today
EBFEnnis, Inc.
Actual
0.51
USD
Estimate
0.38
USD
Today
BNEDBarnes & Noble Education, Inc
Actual
—
Estimate
—
Today
GMGIGolden Matrix Group, Inc.
Actual
—
Estimate
−0.00
USD
Today
LITSLite Strategy, Inc.
Actual
—
Estimate
—
Today
FKWLFranklin Wireless Corp.
Actual
—
Estimate
—
Today
NCPLNetcapital Inc.
Actual
—
Estimate
−0.34
USD
Today
ANEBAnebulo Pharmaceuticals, Inc.
Actual
—
Estimate
−0.07
USD
See more events
Community trends
Bitcoin analysis + Undead (UDS) coin +1000% in the next weeks!I would like to share with you this very promising altcoin, Undead UDS. I believe this coin will make 1000% profit in the next few weeks, so there is a huge opportunity to buy this altcoin. From a technical point of view this coin is very strong because we see an ascending structure (base), and soon

BTCUSDT: Bearish Pressure Remains ? 👋Hello everyone, what do you think about the trend of BINANCE:BTCUSDT ?
Today, BTCUSDT is trading around 114,300 USDT, pulling back after once again being rejected near the strong resistance zone of 117,500 USDT and forming a descending price channel.
If selling pressure continues, BTC is like

ETHUSDTHello Traders! 👋
What are your thoughts on Ethereum?
Ethereum has recently broken above the key resistance area near 4100, printing a new high slightly above the previous peak. After this breakout, price action has entered a corrective phase, suggesting a healthy pullback.
This correction is curr

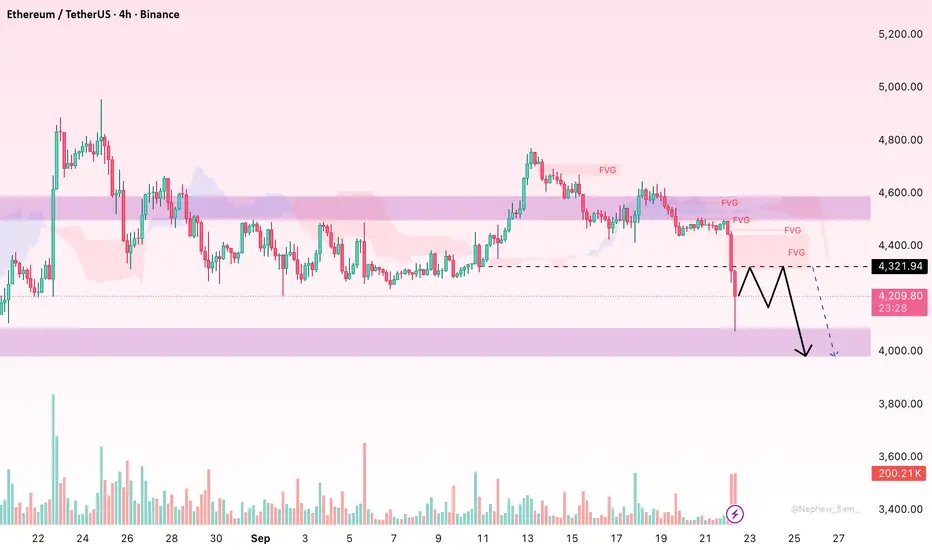
ETH: Sharp Flush, Filling the FVG or Preparing for a Deeper DropHello everyone,
On the H4 chart the recent red candle in ETH was a textbook flush: price plunged straight below the Ichimoku Cloud, selling volume spiked, and a large cluster of FVGs has formed overhead around 4.32k–4.40k. This setup typically favours a technical rebound to fill those gaps before
Bitcoin will Retest Support Before the Next Leg UpHello traders, I want share with you my opinion about Bitcoin. The market structure for Bitcoin has seen a significant shift from bearish to bullish, following a strong reversal from the 109300 - 110000 buyer zone. This pivotal move led to a breakout from a prior downward wedge, invalidating the bea

NEAR/USDT - Bearish Outlook for short Term BINANCE:NEARUSDT NEAR/USDt - Channel Breakout with strong volume, looking for strong bearish in upcoming days.
As altcoin momentum intensifies, Near Protocol
NEARUSDT is rapidly emerging as a standout contender in the crypto space. Fueled by strong fundamentals and recent bullish market trends

Bitcoin: Research LayoutResearching the Behavior of Markets
Original layout
Identified compression
Derived texture of breakout

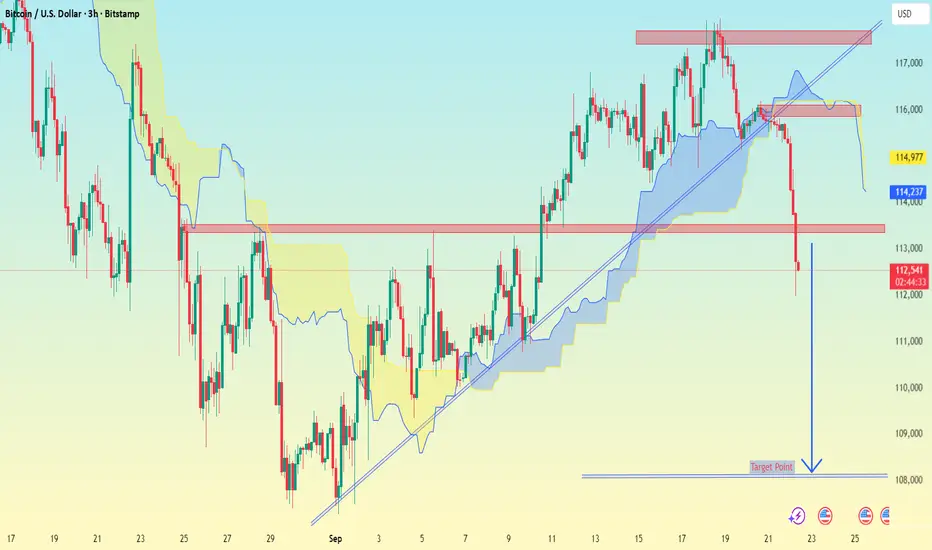
BTCUSD (Bitcoin / USD) chart on the 3H timeframe:BTCUSD (Bitcoin / USD) chart on the 3H timeframe:
Current price: 112,663.
BTC has broken below the trendline and Ichimoku cloud, confirming strong bearish momentum.
A major support at 113,000 has been broken.
The chart clearly marks a downside target.
📉 Target: Around 108,000 – 108,200 (as per
BTC: Changed To Bearish For The MomentBTC: Changed to the downside for now
At the moment, it looks like BTC reached a short-term high at 17830
The price completed a bearish pattern over the weekend, indicating that a small downward move may begin soon.
It could also be time for a larger correction, but so far it is too early to say

Bearish Setup in Bitcoin – Correction Before Deeper Drop?Bitcoin ( BINANCE:BTCUSDT ) started to decline and broke the ascending channel and Support zone($114,820-$113,170) with the help of the Bearish Flag Pattern , as I expected in the previous idea update .
Do you think Bitcoin can go below $105,000 !?
Bitcoin is once again approaching 100_E

See all crypto ideas
XAUUSDHello Traders! 👋
What are your thoughts on GOLD?
Gold, after its strong recent rally, is now facing the key resistance area around 3700.
Possible Scenarios:
1️⃣ Scenario One (More Likely):
Given that the market is in an overbought zone, a corrective/ranging move toward the lower boundary of the

Lingrid | GOLD Weekly Analysis: Sideways Shuffle Before Next RunOANDA:XAUUSD attempted an upward break this week but encountered resistance near the $3,700 level, retreating as the market enters a consolidation phase. 4H chart reveals gold trading within an ascending channel, testing the upper resistance zone around $3,700 after a significant rally from the Aug

THE KOG REPORTTHE KOG REPORT
In last week’s KOG Report we would like to see the red box defence hold the price, and if it did we felt an opportunity to long would be available to traders into the red box target levels.
Price did exactly what we wanted and all the red box target levels for the week were comple

XAU/USD | GOLD Breaking Records – $4K Target Loading…!By analyzing the TVC:GOLD chart on the 1-hour timeframe, we can see that nothing seems to be stopping its series of new record highs — it almost feels like the $4,000 target isn’t too far away! Every small correction in gold is simply gathering more liquidity and demand to push toward higher lev

Gold Price Reverses - Continues to Surge👋Hello everyone, what do you think about OANDA:XAUUSD ?
Although XAUUSD was impacted by the news of a drop in unemployment claims, the upward momentum continued to perform well on Friday. The price held strong above the $3,630 support zone and pushed the precious metal to new highs, rising by ove

GOLD → Breakthrough of correction resistance. Uptrend FX:XAUUSD entered a correction phase after the Fed meeting and interest rate cut, but by the end of the week, the market managed to recover from the decline and return to the zone of interest, breaking through the resistance of the downtrend...
The dollar is correcting after the Fed meeting on

GOLD 1H CHART ROUTE MAP UPDATE & TRADING PLAN FOR THE WEEKHey Everyone,
Please see our updated 1h chart levels and targets for the coming week.
We are seeing price play between two weighted levels with a gap above at 3692 and a gap below at 3673. We will need to see ema5 cross and lock on either weighted level to determine the next range.
We will see le

Gold: Holding Ground or Preparing for the Next Rally?Hello everyone,
After a pullback from the 3,703 USD/oz peak to the 3,68xx area, gold appears to be in a natural correction rather than signalling a trend reversal. On the H1 chart, the bullish structure remains intact: the market is still printing higher-highs and higher-lows, trading above the I

Gold’s Bullish Run: Ascending Channel Targets $3715Hi guys!
Gold has been showing incredible strength lately. Earlier, it formed a Head and Shoulders pattern, broke out, and hit its target perfectly.
Now
Things are getting even more exciting. We’ve just seen a widening pattern develop , and price has already broken out of it to the upside. Tha

XAUUSD 1HR
"Gold analysis on 1-hour timeframe. Price currently at $3,684.29 with a 1.10% increase. Will short on monday PARTIAL' zone $3,647 for potential price reaction. Considering market movement and possible short setup in this area. Monitoring for break below or bounce.

See all futures ideas
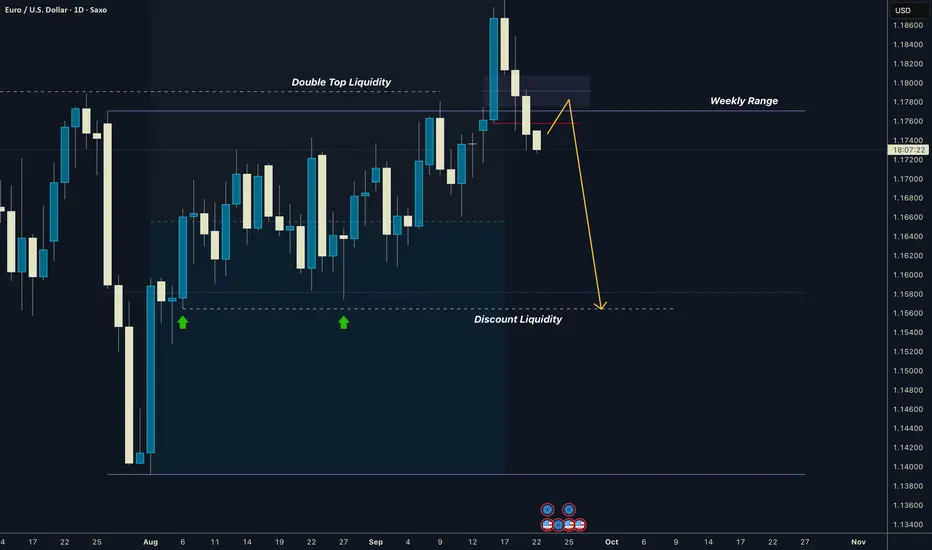
EURUSD I Weekly Range I Manipulation - Time for pullbackGM Friends,price was ranging diagonaly up for the whole August. During the FOMC it has made final manipulation where most of traders most likely entered longs. With expectations of weak USD. While the CUT 0.25 BPS was already priced in so price reversed. This is a clean pattern of accumulation, m
EURUSD is poised for a bearish move. What comes next?EURUSD is poised for a bearish move. What comes next?
The pair made a false breakout above the resistance zone around 1.1830, but quickly fell back below, showing weakness. This bearish movement happened after the FOMC meeting. The FED is expected to cut rates 2 more times this year. Probably every

EUR/USD: Outlook, Catalysts and Q4 2025 Forecast 🔮✨EUR/USD: Outlook, Catalysts and Q4 2025 Forecast
💵 🎯 Q4 2025 Forecast & Range
• Base-case: EUR/USD around $1.18–1.22 in Q4 2025, drifting toward ~1.20 by year-end.
• Bull case: Faster US slowdown, Fed cuts, euro resilience → test 1.25+.
• Bear case: Fed stays hawkish, euro weakens → drop tow

EUR/AUD - Selling Pressure Below 1.7850 (22.09.2025)#EURAUD #Forex #Trading #TechnicalAnalysis
EUR/AUD – Channel Breakout Pattern (30M)
EUR/AUD has broken below the rising channel, confirming a bearish reversal after completing a Head & Shoulders pattern at the top.
🔹 Market Structure:
Clear rejection from the resistance zone (1.7850 – 1.7860)
B

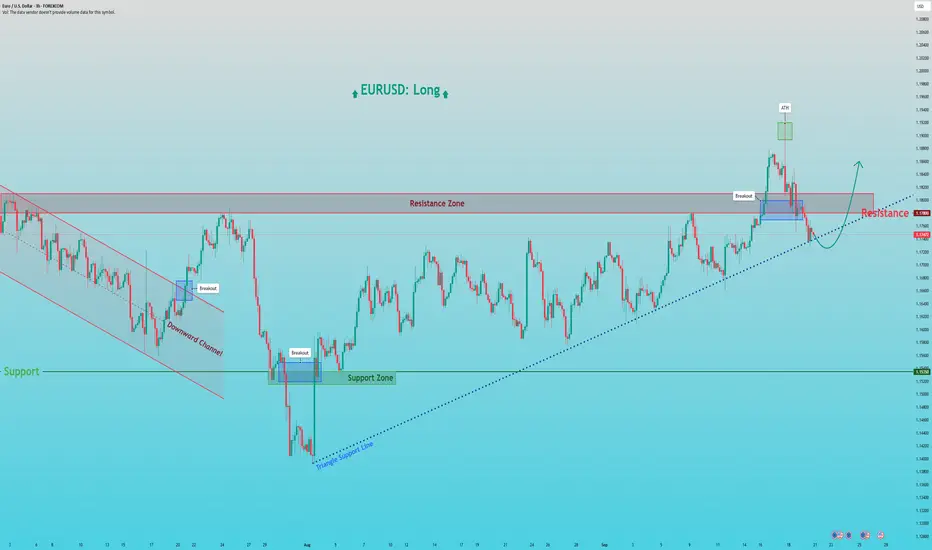
EURUSD: Dip and Bounce from Triangle SupportHello everyone, here is my breakdown of the current Euro setup.
Market Analysis
After reversing from a prior Downward Channel, EURUSD has been consolidating in a large Upward Triangle. This pattern is typically bullish and is defined by a flat horizontal Resistance at the 1.1780 level and an as
AUDJPY Momentum Weakens, Sellers Eye Deeper PullbackAUDJPY has lost steam after a strong recovery rally, with sellers now pressing back below trendline support. The recent rejection near 98.40 signals exhaustion, and the pair looks set for a corrective leg lower toward key support zones. Unless buyers reclaim higher ground quickly, the near-term risk

GBP/USD: Bullish Signal from Support Zone👋Hello traders, what’s your view on the FX:GBPUSD trend?
Today, GBP/USD is trading around 1.3499, showing signs of reversing and completing its pullback after touching the ascending trendline and the critical support zone. Recovery momentum is firming up, with the first target at the 1.3550 resi

Which Path for EUR/USD as the Dollar Stays Strong?Hello everyone,
Today EUR/USD is facing strong selling pressure around 1.172x. On the H1 chart, price remains below the Ichimoku Cloud, with layered FVG/supply zones above acting as barriers, meaning each rebound is quickly sold off. Volume is light during declines but even weaker on recoveries,

AUDUSD Pullback Toward 0.65300 Within Ongoing UptrendHey Traders, in today's trading session we are monitoring AUDUSD for a buying opportunity around the 0.65300 zone. The pair is trading in an uptrend, with price currently correcting toward this key support/resistance level.
Structure: The broader bias remains bullish, but price is retracing after r

Hellena | EUR/USD (4H): LONG to the resistance area 1.18935.We did pretty well last week and I was waiting for the correction to show us its movement in wave “4”. Now I believe that the correction is coming to an end and I expect the upward movement to continue in wave “5”.
I think that we will target the resistance area at 1.18935.
Fundamentals:
Euro is su

See all forex ideas
| - | - | - | - | - | - | - | ||
| - | - | - | - | - | - | - | ||
| - | - | - | - | - | - | - | ||
| - | - | - | - | - | - | - | ||
| - | - | - | - | - | - | - | ||
| - | - | - | - | - | - | - | ||
| - | - | - | - | - | - | - | ||
| - | - | - | - | - | - | - |
Trade directly on the supercharts through our supported, fully-verified and user-reviewed brokers.


