Gold 1979 vs 2025 — When History Whispers and Markets Listen
🌕 1. The Echo of 1979
In 1979, the world watched Gold do the impossible. The metal surged from $226 to over $850 per ounce in less than a year, a 275% explosion that turned fear into fortune.
The triggers were seismic.
🇮🇷 The Iranian Revolution disrupted global oil flows.
🏛️ The U.S. Embassy host

The best trades require research, then commitment.
Get started for free$0 forever, no credit card needed

Scott "Kidd" PoteetThe unlikely astronaut

Where the world does markets
Join 100 million traders and investors taking the future into their own hands.

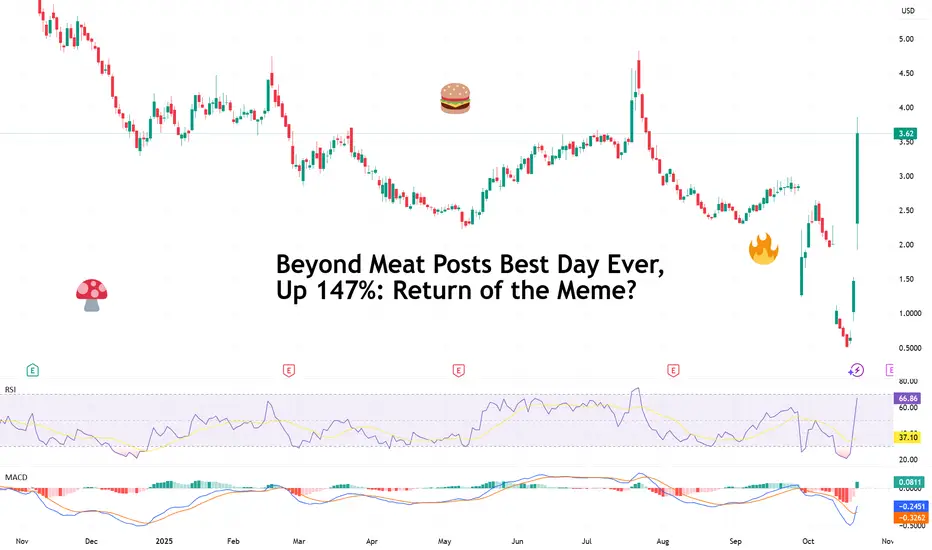
Beyond Meat Posts Best Day Ever, Up 147%: Return of the Meme?🔥 A Sizzling Comeback or Just Froth?
Beyond Meat NASDAQ:BYND , once the darling of the plant-based revolution and later the focus of every “overcooked IPO” joke, just got on everyone’s radar: a 147% single-day surge, its best performance ever.
For a company that was trading at just 65 cents las
Silver bull will try to throw you off, but long term healthyA pause that could refresh might be warranted in silver and gold.
I am still optimistic for precious metals long term.
Silver is still undervalued based on historical metrics and money supply.
I worry about the rise in metals and what it implies for the broad stock market indices.

Gold Analysis: Break Above $4,293 Could Trigger a New HighHi guys!
Gold has been moving inside a clear ascending channel, respecting both its upper and lower boundaries. Recently, we saw a double top formation near the upper trendline , which triggered a corrective move down to the $4,190–$4,200 support zone, an area that has already shown strong buying

Moment of Fate - BTC Analysis (3D)There are many reasons to go up but also going down is starting to look way more charming than ever right now.
Let's examine what we have;
-FED is about to cut rates for a second time but we'll most likely to see another rate cut in december which is bullish af.
-All companies are keeping buying
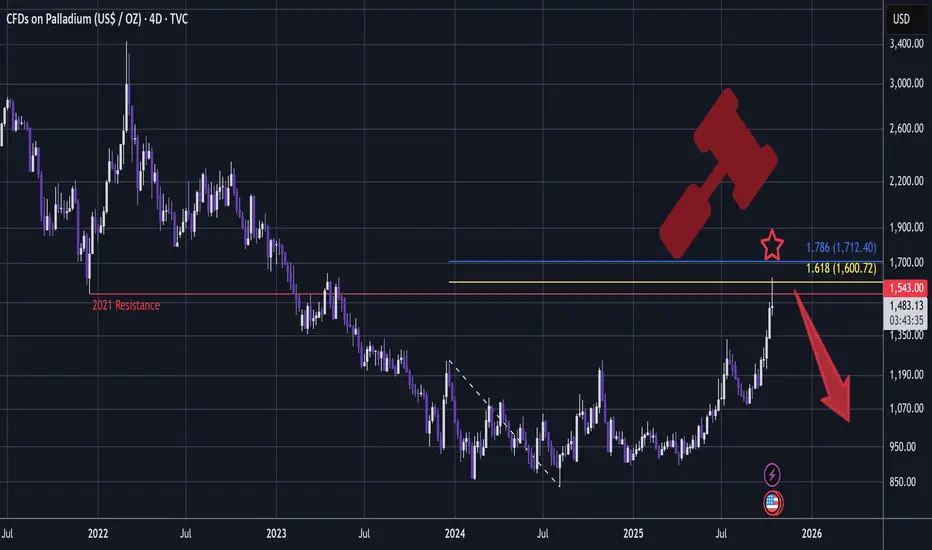
PALLADIUM - Short Setup, Bearish Rotation In MetalsA very bearish setup is developing:
Since the top, there is nowhere on the chart that has a whipsawing candle like this:
A very big Shooting Star!
This setup has my favourite conditions met:
- Whipsawing candle that sweeps liquidity through key resistance (2021)
- Tidy 1.618 Golden Window (1.6
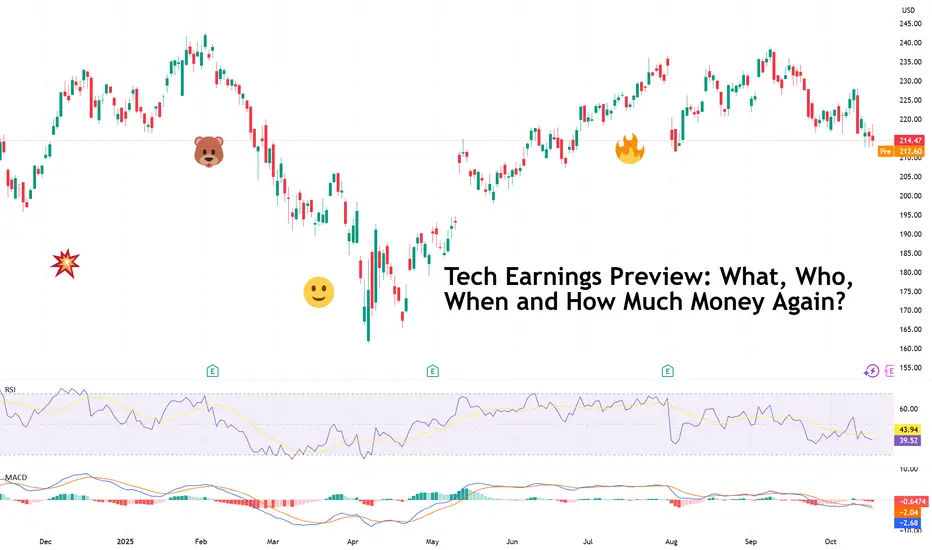
Tech Earnings Preview: What, Who, When and How Much Money Again?“ I don’t know, probably at least around $600 gazillion dollars ,” Zuck, probably if you asked him how much Meta NASDAQ:META will spend over the fiscal year.
It’s earnings season , which means Wall Street’s most expensive hobby — guessing how much the tech giants will make while pretending it’s
Tesla (TSLA) — Momentum Reload or Major Cooldown?The Next $400–$450 Decision Zone!
🧭 Weekly Chart — Big Picture Momentum
Tesla has printed one of the cleanest BOS (Break of Structure) patterns on the weekly timeframe since the post-2023 recovery, confirming that the macro downtrend has flipped into a sustained bullish expansion. The stock ripped

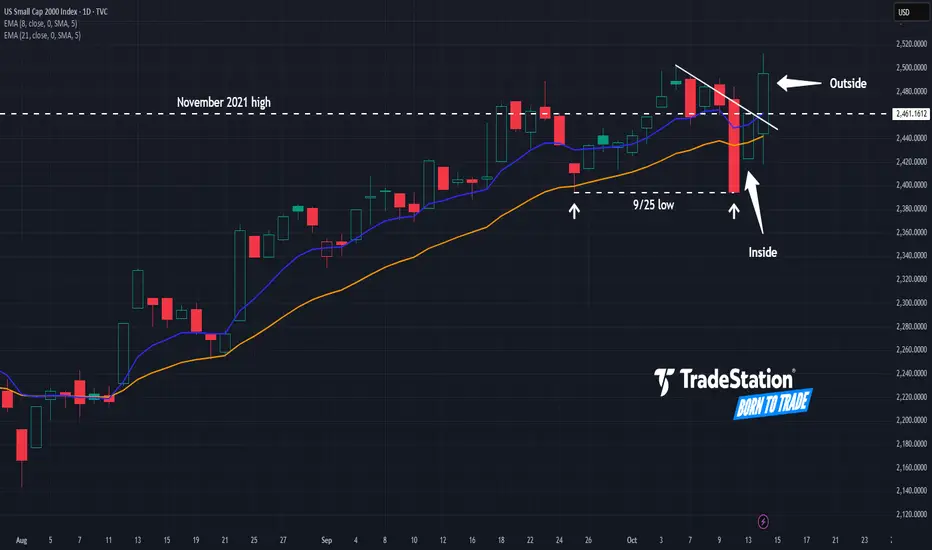
Small Caps: Finally a Breakout?The Russell 2000 has been stuck in a rut for years, but some traders may think the small-cap index has finally achieved escape velocity.
The first pattern on today’s chart is the November 2021 high around 2,460, where prices stalled last November. RUT has gotten above it this month and refused to s
“I Am Become Meme, Destroyer of Short-Sellers”: Gold at $4,200Remember those days where you could short gold and turn a profit? They’re gone. The precious metal is relentlessly pushing higher, breaking every short-seller’s dreams and portfolio.
It’s official — gold has gone full meme. The shiny metal that your grandparents swore by is now trending on Reddit

See all editors' picks ideas
Adaptive Volume Delta Map---
📊 Adaptive Volume Delta Map (AVDM)
What is Adaptive Volume Delta Map (AVDM)?
The Adaptive Volume Delta Map (AVDM) is a smart, multi-timeframe indicator that visualizes buy and sell volume imbalances directly on the chart.
It adapts automatically to the best available data resolution

Dynamic Equity Allocation Model"Cash is Trash"? Not Always. Here's Why Science Beats Guesswork.
Every retail trader knows the frustration: you draw support and resistance lines, you spot patterns, you follow market gurus on social media—and still, when the next bear market hits, your portfolio bleeds red. Meanwhile, institution

First Passage Time - Distribution AnalysisThe First Passage Time (FPT) Distribution Analysis indicator is a sophisticated probabilistic tool that answers one of the most critical questions in trading: "How long will it take for price to reach my target, and what are the odds of getting there first?"
Unlike traditional technical indicators

PongExperience PONG! The classic arcade game, now on your charts!
With this indicator, you can finally achieve your lifelong dream of beating the Markets. . . at PONG!
Pong is jam-packed with features! Such as:
2 Paddles
A moving dot
Floating numbers
The idea of a net
This indicator is solel

Options Max Pain Calculator [BackQuant]Options Max Pain Calculator
A visualization tool that models option expiry dynamics by calculating "max pain" levels, displaying synthetic open interest curves, gamma exposure profiles, and pin-risk zones to help identify where market makers have the least payout exposure.
What is Max Pain?
Max

Volume Profile 3D (Zeiierman)█ Overview
Volume Profile 3D (Zeiierman) is a next-generation volume profile that renders market participation as a 3D-style profile directly on your chart. Instead of flat histograms, you get a depth-aware profile with parallax, gradient transparency, and bull/bear separation, so you can see w

RiskMetrics█ OVERVIEW
This library is a tool for Pine programmers that provides functions for calculating risk-adjusted performance metrics on periodic price returns. The calculations used by this library's functions closely mirror those the Broker Emulator uses to calculate strategy performance metrics (

Simple Decesion Matrix Classification Algorithm [SS]Hello everyone,
It has been a while since I posted an indicator, so thought I would share this project I did for fun.
This indicator is an attempt to develop a pseudo Random Forest classification decision matrix model for Pinescript.
This is not a full, robust Random Forest model by any stretch o

Tick CVD [Kioseff Trading]Hello!
This script "Tick CVD" employs live tick data to calculate CVD and volume delta! No tick chart required.
Features
Live price ticks are recorded
CVD calculated using live ticks
Delta calculated using live ticks
Tick-based HMA, WMA, EMA, or SMA for CVD and price
Key tick levels (S

analytics_tablesLibrary "analytics_tables"
📝 Description
This library provides the implementation of several performance-related statistics and metrics, presented in the form of tables.
The metrics shown in the afforementioned tables where developed during the past years of my in-depth analalysis of various str

See all indicators and strategies
Community trends
TSLA Triple TopTriple tops = market drop!
As soon as the market tanks, TSLA is in major trouble!
For 5 long years, people have been trying to pump this stock with no good results. Instead, they got a -75% decline and a -66% decline for their efforts.
This stock will fall bidless! All hype with no substance.
Th

Beyond Meat Posts Best Day Ever, Up 147%: Return of the Meme?🔥 A Sizzling Comeback or Just Froth?
Beyond Meat NASDAQ:BYND , once the darling of the plant-based revolution and later the focus of every “overcooked IPO” joke, just got on everyone’s radar: a 147% single-day surge, its best performance ever.
For a company that was trading at just 65 cents las
Ferrari RACE Technicals Led Entry With 100% Upside in 2026
RACE is in a measured correction after its July 2025 ATH (~$517). A repeat of prior ~35% corrections (2018/19; 2022) implies a symmetry target near ~$336 (35% off $516), creating a high-quality “buy the pullback” setup for smart investors willing to scale in before fundamentals re-assert. With th

RIOT – Short-Term Bullish SetupNASDAQ:RIOT completed its wave 4 pullback after attracting buyers at the #BlueBox support zone of $18.34–$17.24, and has already reacted higher from that level.
Currently, the wave ((ii)) correction is unfolding in 3 swings, reaching another equal legs area at $20.49–$19.58, where price is expecte

$BYND is giving me Opendoor vibes- NASDAQ:BYND stands to benefit health conscious trend.
- Today's generation is getting healthier and thinking twice before they pick things for their meal.
- Mental wellness, diet and fitness industry is growing rapidly after the pandemic.
- Processed meat and red meat in general is Carcinogenic

HIMX 1D - eyes back on the screen?Himax Technologies is shaping a strong setup: after breaking above the downtrend line, the stock is now retesting the $8.70–$9.00 support zone, aligning perfectly with previous resistance and short-term EMAs. It’s a textbook breakout + retest situation.
All moving averages (MA/EMA/SMA) are below t

Oklo slides to the downside - Watch for the next levels In this video I cover the next important levels for Oklo during what I perseve as being the start
of a correction after pushing up some 900% over the past 5 months .
Tools used Fibs, Pivots, TPO chart and Volume Profile

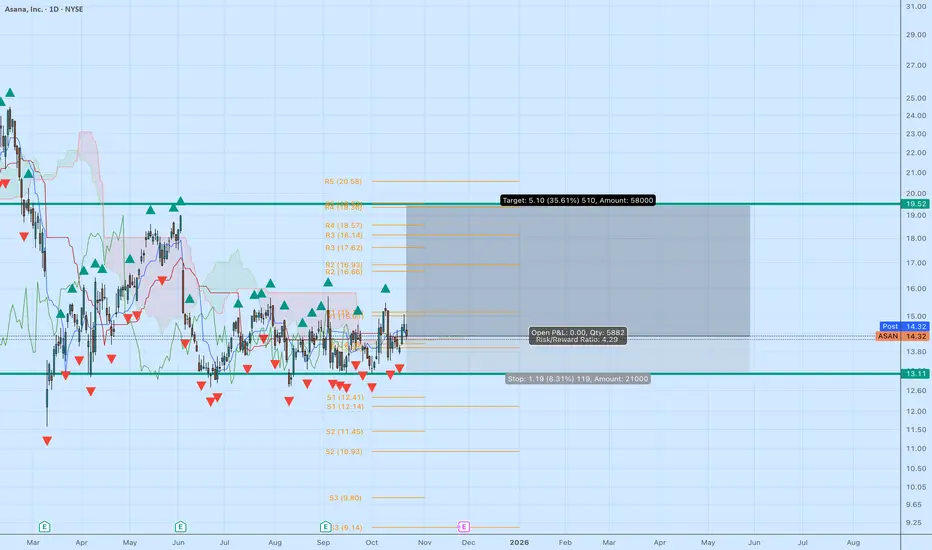
ASANA – Breakout Watch from Base | IchimokuDescription:
Asana (ASAN) is consolidating tightly around $14.30, coiling beneath key resistance and showing early signs of a potential breakout. Price is now sitting right at the Kijun and Tenkan cross zone, with the Ichimoku Cloud flattening and narrowing — a setup that often precedes trend expan
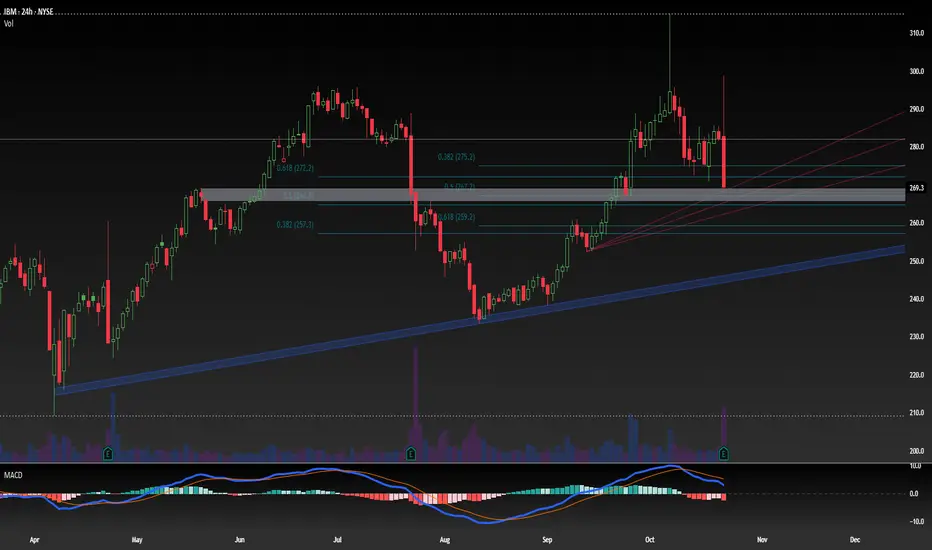
Levels to trade IBM's Wyckoff Distribution phaseWhile IBM beat EPS and revenue estimates, the stock is selling off hard. News indicates investors are focused on decelerating growth in the key Red Hat (software) segment. This "sell the news" reaction is a classic confirmation of a distribution top.
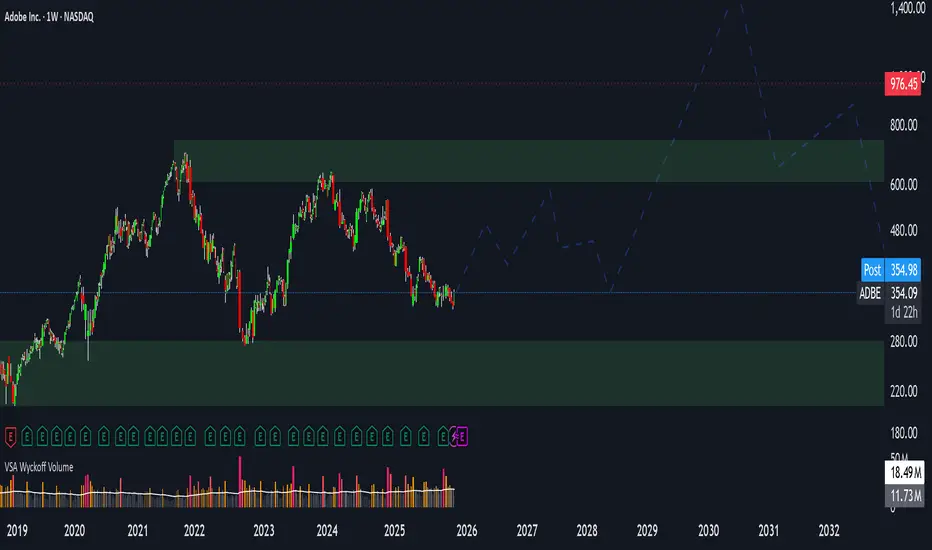
Adobe: Entering the Fourth Wave — Smart Money Distribution PhaseAdobe’s stock is entering a critical structural phase — the completion of its third global impulse and the start of the fourth corrective wave.
While the long-term uptrend remains intact, the price structure and fundamentals suggest that the most explosive growth period may already be behind us.
🧭
See all stocks ideas
Today
FBNCFirst Bancorp
Actual
0.49
USD
Estimate
0.66
USD
Today
DOWDow Inc.
Actual
−0.19
USD
Estimate
−0.31
USD
Today
WSTWest Pharmaceutical Services, Inc.
Actual
1.96
USD
Estimate
1.68
USD
Today
THRMGentherm Inc
Actual
0.73
USD
Estimate
0.65
USD
Today
ALLEAllegion plc
Actual
2.30
USD
Estimate
2.21
USD
Today
HONHoneywell International Inc.
Actual
2.82
USD
Estimate
2.57
USD
Today
TPHTri Pointe Homes, Inc.
Actual
0.64
USD
Estimate
0.52
USD
Today
AMALAmalgamated Financial Corp.
Actual
—
Estimate
0.88
USD
See more events
Community trends
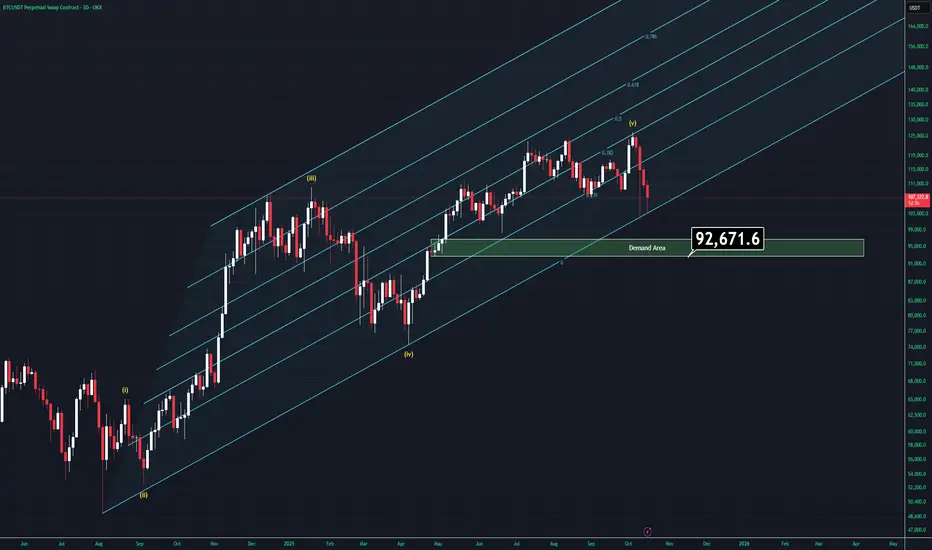
BTCUSDTHello Traders! 👋
What are your thoughts on BITCOIN?
Bitcoin has entered a healthy corrective phase after hitting the upper boundary of its ascending channel. Price is now approaching a key demand zone, which could offer strong support for the next leg higher within the broader bullish trend.
As lo

BTC WAIT FOR THE CRACK!After months of repeated warnings throughout the year about crypto's vulnerability, we’ve now arrived at a critical inflection point.
If Bitcoin breaks down here, it could trigger a waterfall decline — potentially into a bidless market.
This is a major level. What happens next could define the nex

ETHEREUM → Manipulation before a possible fall BINANCE:ETHUSDT , as part of manipulation and updating the local maximum to 4108, confirms strong resistance, forms a false breakout, and falls, testing key support.
Bitcoin, as part of yesterday's rally in the US trading session, is trying to turn the tide, but after encountering resistance a

BITCOIN: Retracement Toward $109,500 ExpectedPrice had been in a clear downtrend, showing strong bearish momentum as sellers dominated the market. However, as price reached a key zone, selling pressure began to weaken, hinting at potential buyer interest.
A bullish push then broke above the short-term descending trendline, marking the first s

Bitcoin - Symmetrical triangle's target is 92,000 USD! Must seeBitcoin is forming a symmetrical triangle pattern, which in classic forex is a 50/50 bullish/bearish pattern. But here we do predictions, so I predict this pattern to break down! In this analysis, I will explain the reasons behind my prediction.
On Friday, October 10, we had the biggest crash in cr

BTC's Make or Break Zone: Will $101K Hold?Bitcoin continues to respect the short-term downtrend structure, with price now testing the mini trendline resistance, a zone that has aligned perfectly with the “President Trump Tweet Resistance” a region that historically triggered notable market corrections.
Despite the selling pressure from thi

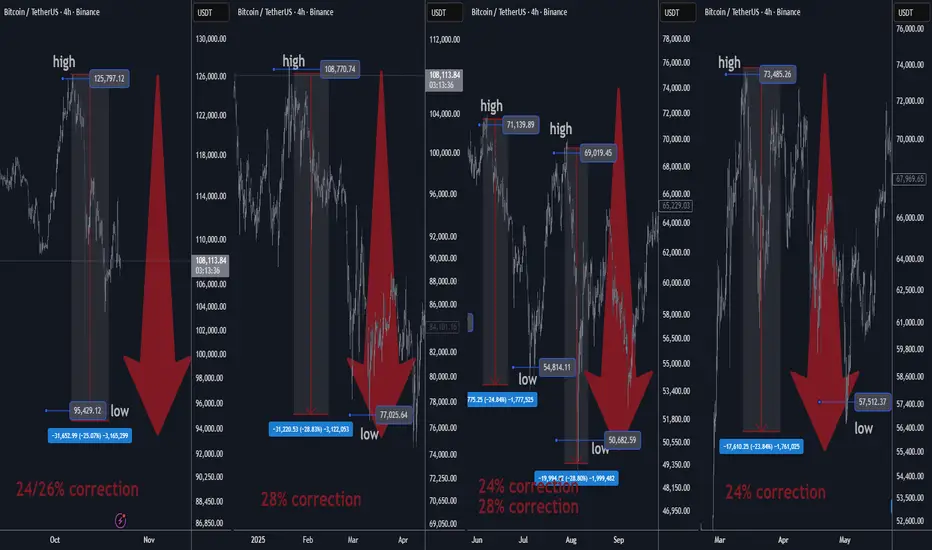
BTC High Probability Forecast Based on Real Math Bitcoin has repeatedly corrected ~mid-20% during the last 12–24 months. Using this empirical drawdown profile, a base-case correction of ~25% from a recent $126,000 high implies a **probable correction low near $94,500–$95,000.
This is a high probability forecast based on real math and stats, no
Bitcoin: Strong Downtrend – Don’t Miss the Sell Chance!Hello traders,
Although Bitcoin showed a slight recovery on Wednesday, the crypto market is still struggling after the sharp decline in early October. Selling pressure remains strong, as the market hovers near recent lows with no clear signs of recovery.
With uncertainty surrounding the U.S. econo

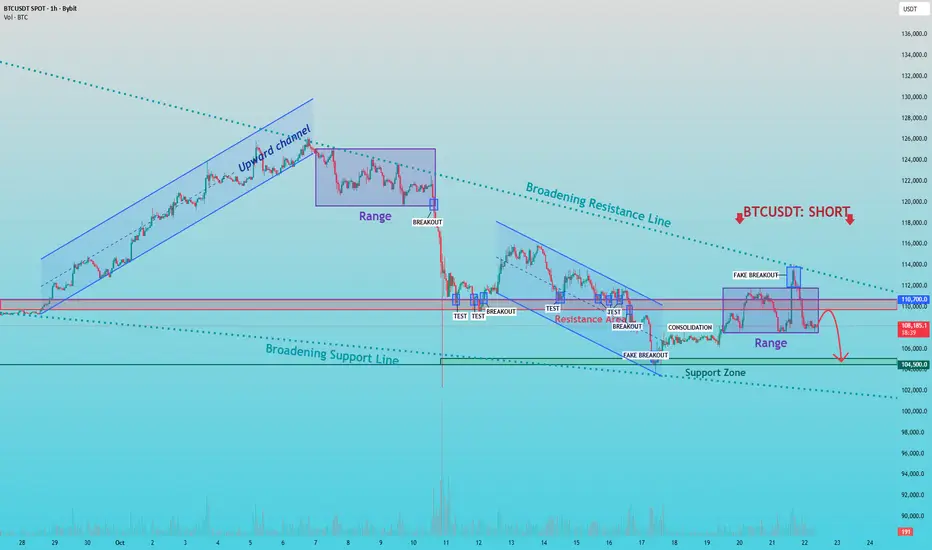
BTCUSDT — Bearish Structure Intact, Watching for BreakdownHello everyone, here is my breakdown of the current Bitcoin setup.
Market Analysis
From a broader perspective, BTCUSDT has been trading inside a broadening formation, marked by expanding highs and lows — a typical sign of increasing volatility and market uncertainty. After a strong upward move wi
$OTHERS possible scenariosIt’s decision time for CRYPTOCAP:OTHERS , arguably the most accurate index to gauge the true altcoin market.
We’re now testing the $220 billion level, a critical support zone.
From here, two paths emerge:
either we bounce and start a meaningful trend reversal,
or we break down and revisit the wick

See all crypto ideas
( Gold Protocol ) Bullish & Bearish Reversal Detected➕ Bearish Reversal " 4115 Zone
➕ Bullish Reversal : 3990
🩸 Volume Surge Confirmed — Institutional buyers active
🩸 Session Aligned — Timing matches liquidity expansion window
🩸 Cluster Shield Formed — Demand imbalance verified
🩸 Delta Shift Positive — Accumulation phase confirmed
🩸 POC Retest Comple
Gold 1979 vs 2025 — When History Whispers and Markets Listen
🌕 1. The Echo of 1979
In 1979, the world watched Gold do the impossible. The metal surged from $226 to over $850 per ounce in less than a year, a 275% explosion that turned fear into fortune.
The triggers were seismic.
🇮🇷 The Iranian Revolution disrupted global oil flows.
🏛️ The U.S. Embassy host
XAU/USD | Gold’s Historic Dump – Will $4,000 Hold or Break?By analyzing the Gold chart on the 2-hour timeframe , we can see that gold experienced an extremely sharp sell-off — the biggest single-day drop in over 12 years — falling nearly $400 in less than 24 hours!
After dropping from $4,381 to $4,003 , price rebounded to $4,162, but then corrected a

GOLD Analysis: Watching for Reaction Near Buyer ZoneHello traders, I want to share with you my opinion about Gold. The market for Gold has been in a strong bullish trend for quite some time, forming a clear upward channel structure. Each impulse has been followed by a short consolidation phase (range), allowing the market to gather liquidity for the

Silver - The catastrophic rejection!🆘Silver ( TVC:SILVER ) is just collapsing:
🔎Analysis summary:
At this exact moment, Silver is retesting the previous all time highs, which were already rejected about 45 years ago. Considering the extremely bearish rejection on the smaller timeframes, Silver simply fails to break out. This wi

GOLD → Correction after aggressive growthFX:XAUUSD is in a correction phase after a month and a half of aggressive growth. The price is forming a trading range and continues to storm support...
The record growth was overheated, and traders are closing long positions. A gradual change in the fundamental background and market sentiment

Lingrid | GOLD Weekly Support Hold Long OpportunityOANDA:XAUUSD pulled back sharply from the resistance and printed a higher low right at the confluence of the uptrend and above previous week low 4,050. Structurally, the broader upward channel remains intact while price retested the downward trendline from above, keeping the higher-low sequence ali

Gold Price in Free Fall👋Hello everyone, let’s take a look at OANDA:XAUUSD and see what’s happening!
At the time of writing, the precious metal continues to move within a downward wave. At one point, gold dropped close to the $4,000 mark, down more than $350 compared to the same time in the previous session — a decline

XAU/USD (Gold 4H timeframe)... XAU/USD (Gold 4H timeframe) — here’s what’s visible and how it breaks down technically:
Price: Around 4065 USD currently.
Trendline: A major uptrend line has been broken clearly.
Ichimoku Cloud: Price has fallen below the Kumo, confirming bearish momentum.
Support Zone: Between 4120–4160 USD, a

#XAUUSD: Massive Drop Is In Making! Bears In ControlDear all,
We are seeing significantly increased bearish volume since yesterday now we think price is likely to remain bearish for couple of days or week so price could make major correction. Please wait for price to settle down.
Good Luck
Team Setupsfx_

See all futures ideas
GBP/USD - Fundamental Drive Ahead! (21.10.2025)🧠 Setup Overview:
GBP/USD has broken below its rising trendline after testing the 1.3470 resistance zone multiple times. The pair is under fundamental selling pressure, fueled by risk aversion and renewed U.S. dollar strength.
Fundamental Drivers:
1️⃣ U.S. markets gained as President Trump decided

Latest EURUSD Update👋Hello everyone, what are your thoughts on FX:EURUSD ?
Earlier, in my latest analysis, I was more optimistic about EURUSD's recovery; however, the momentum wasn’t enough, and it pulled EURUSD back into a downtrend. As of now, at the time of writing, the price is fluctuating around 1.160, and no re

EURUSDHello Traders! 👋
What are your thoughts on EURUSD?
EUR/USD has broken its ascending trendline and completed a pullback to the broken level.
The pair is now trading below a key resistance zone, showing continued signs of bearish pressure.
After some short-term consolidation in this area, the price

USD/CAD Support breakdown bearish strong📉 USDCAD Update (1H Timeframe)
The pair has broken down from key support and consolidation zone around 1.40100, confirming strong selling pressure 🔥
🎯 Technical Targets:
1️⃣ 1.39800
2️⃣ 1.39600
3️⃣ 1.39300
Momentum remains bearish with sellers in control — watch for continued downside pressure

EURUSD Short: Setup After Fake Breakout and Supply RejectionHello, traders! The market for EURUSD has been developing within a well-defined descending structure, characterized by lower highs and consistent rejection from the upper supply levels. After the earlier breakout from the falling wedge formation, the price transitioned into a broad consolidation ran

GBP/USD – Sell Entry (H1 – Channel Pattern)
The GBP/USD Pair, Price has been trading within a Channel Pattern on the H1 chart, forming consistent lower highs and lower lows. Price action is now testing the lower boundary of the pattern, signalling a possible breakdown.
✅Market Context:
1️⃣Downward structure building inside the pattern.
2️⃣

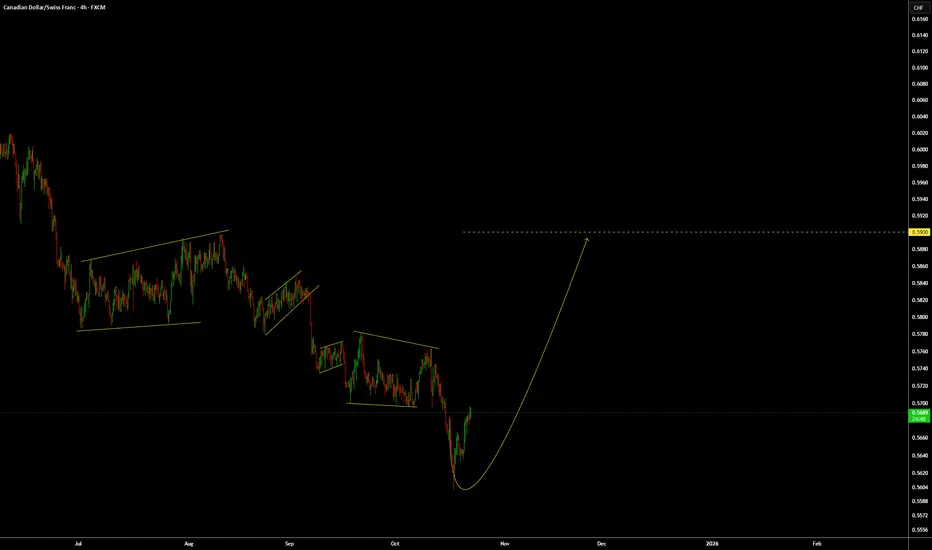
CADCHF: Looking for this wave up.FX:CADCHF is at a low and we are good to go to the upside for at least 200 to 300 pips.
If you get a buy setup or you have a strategy to go for the buy, try to not miss it.
WTW 4 Golder Rules:
1) Do not jump in
2) Do not over risk/trade
3) Do not trade without Stop Loss
4) Never ever add to a lo
EUR/USD Drops Sharply: A Huge "Sell" Opportunity Ahead!Hello traders,
Recent news from the European Central Bank (ECB) warns that Eurozone banks may face significant pressure if USD liquidity tightens. This could lead to banks reducing lending, negatively impacting Eurozone economic growth, and as a result, the EUR weakens.
Additionally, the curren

GBP/USD – Bearish SetupOn both the 4H and 1D charts, GBP/USD is maintaining a clear bearish structure, signaling continued downward momentum. Based on this analysis, I have taken a short (sell) position.
Note this week:
* 🇺🇸 US: CPI on Fri, Oct 24, plus government shutdown and tariff headlines could fuel USD volatility.

GBP/NZD: Smart Money Flows Back Into Sterling🔹 COT (Commitment of Traders)
British Pound (GBP)
Non-commercial longs: 84,500 (+3,704)
Non-commercial shorts: 86,464 (−912)
→ Institutions increased long exposure and trimmed shorts → signaling renewed bullish interest in the pound.
New Zealand Dollar (NZD)
Non-commercial longs: 12,295 (+3,044)
Non

See all forex ideas
| - | - | - | - | - | - | - | ||
| - | - | - | - | - | - | - | ||
| - | - | - | - | - | - | - | ||
| - | - | - | - | - | - | - | ||
| - | - | - | - | - | - | - | ||
| - | - | - | - | - | - | - | ||
| - | - | - | - | - | - | - | ||
| - | - | - | - | - | - | - |
Trade directly on the supercharts through our supported, fully-verified and user-reviewed brokers.


