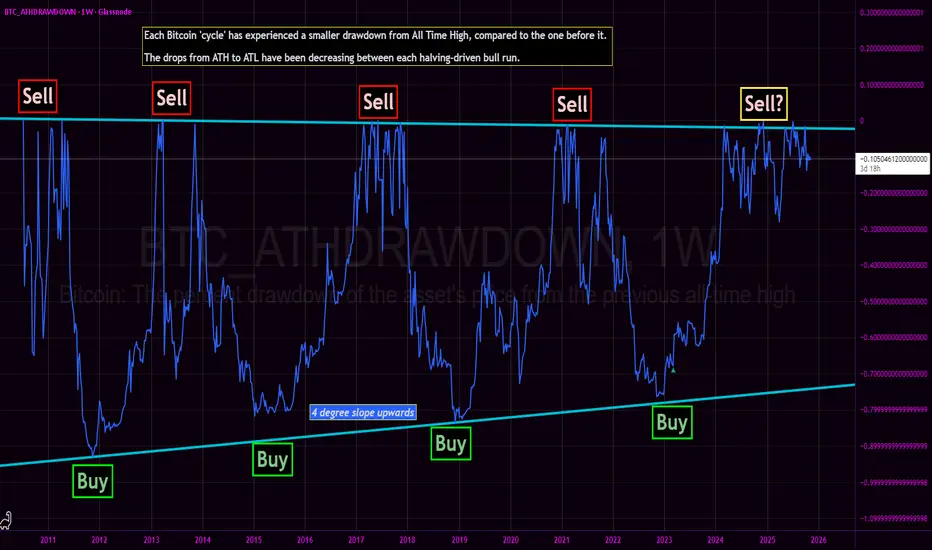
Bitcoin All Time High Drawdown - Bottom nowhere in sight?We revisit the Bitcoin All Time High Drawdown chart originally published in March 2023.
The core thesis of the BTC_ATHDRAWDOWN chart remains intact: each subsequent market cycle has exhibited a diminishing drawdown from its prior All-Time High, with generational cycle bottoms resting squarely on

The best trades require research, then commitment.
Get started for free$0 forever, no credit card needed

Scott "Kidd" PoteetThe unlikely astronaut

Where the world does markets
Join 100 million traders and investors taking the future into their own hands.
Wall Street Weekly Outlook - Week 44 2025 [27.10.- 31.10.2025]Wall Street Weekly Outlook – Week 44, 2025 📊💥
Let’s dive into another exciting trading week! 🚀
Rate decisions, month-end flows, and fresh quarterly earnings are setting the stage for strong market moves.
Sit back, enjoy the overview, and dive into the world of banks, hedge funds, and institution

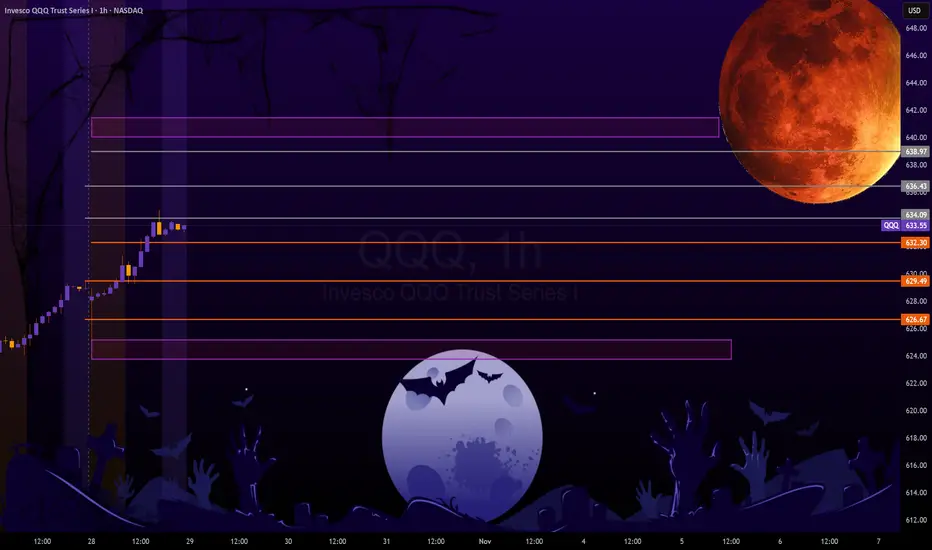
QQQ: Preparation for FOMC... and Halloween Okay, so here is my annual Halloween themed post! Have to stick to tradition I guess.
Here I am sharing intra-day predictions in anticipation for FOMC release tomorrow.
The FEDS are between a rock and a hard place. As the Federal reserve depends on the federal government to release statistics, i
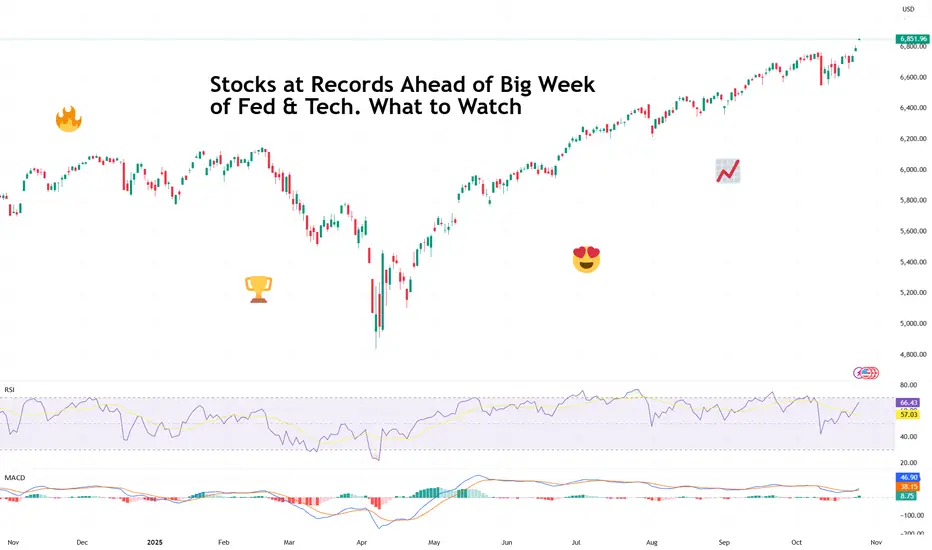
Stocks at Records Ahead of Big Week of Fed & Tech. What to WatchRecord highs, rate-cut optimism, five tech giants on deck — what a time to be a market participant!
It’s Monday, and Wall Street is back doing what it does best — setting new records and pretending not to worry about what comes next.
After a cooler-than-expected inflation print and some diplomat
BTCUSDT – When the Bullish Wave ReturnsBitcoin is showing a notable recovery phase after a series of previous corrections. On the daily timeframe, price continues to move within an ascending channel that has been forming since the beginning of Q3.
Currently, BTC is approaching the midline of the channel around 115,000–116,000 USD , w

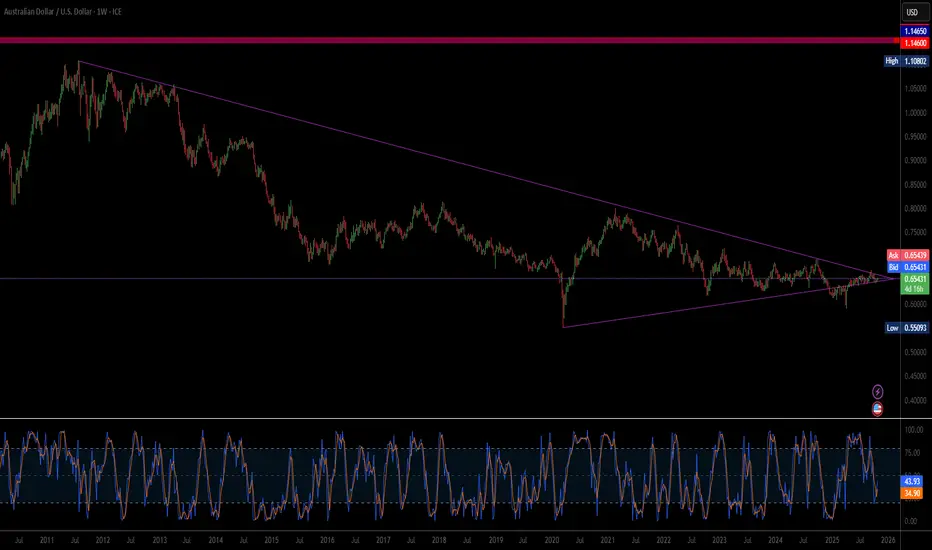
Is Geopolitical Re-Alignment the New AUD Catalyst?The Australian Dollar's (AUD) sharp surge against the US Dollar (USD) is driven by a powerful synergy of geopolitical de-escalation and structural economic realignment. Near-term momentum stems from optimism surrounding an imminent US-China trade deal. As a primary commodity exporter and a financial
Can WTI’s 8% Rally Hold After Trump-Putin Summit Collapse?WTI just staged its biggest two-day rally since June, as hopes for a Trump-Putin summit were dashed, leading to new US sanctions on Russian oil exports.
Here’s what’s fuelling the move and what traders should watch next:
- US sanctions on Russia’s top oil producers after failed Budapest summit tr

XAUUSD-seeking $4,000 region?As my H4 chart shows, gold did make a double top a few days ago and then crashed. You can give credit for this massive 3,800 points move to profit taking or economic uncertainty or any technical reason, maybe a combination but it really does not matter.
What does matter is that we now have a double

BTCUSDT: Bounce from Support Could Ignite Rally Toward $114KHello everyone, here is my breakdown of the current Bitcoin setup.
Market Analysis
Bitcoin (BTCUSDT) has recently transitioned from a bearish phase to a bullish structure after breaking out of a prolonged downward channel. The market had been forming a sequence of lower highs and lower lows until

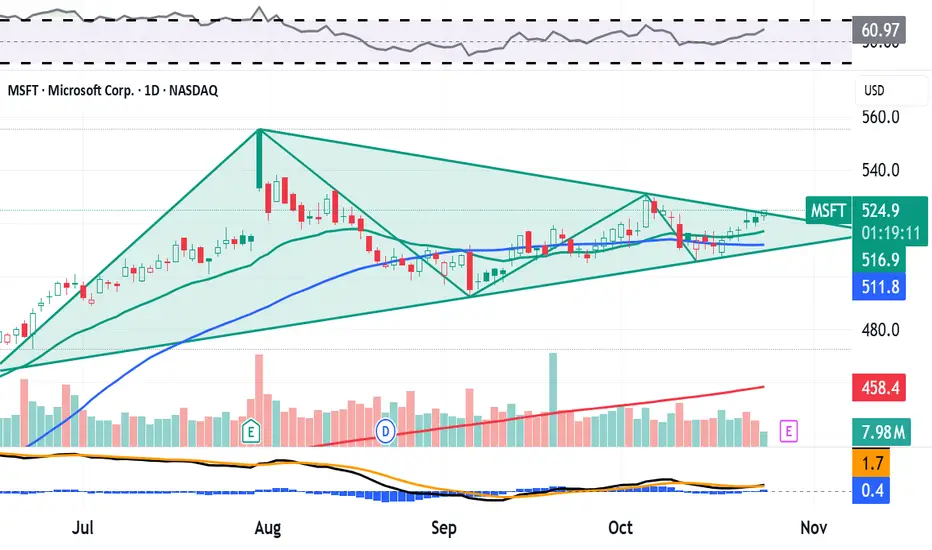
Here's What Microsoft's Chart Says Heading Into EarningsMicrosoft NASDAQ:MSFT , which will release earnings next week, is beating the S&P 500 SP:SPX year to date -- up 24.4% vs. about 15.7% for the SPX. MSFT has also gained roughly 112% over the past three years, while the S&P 500 has added just 78.9%. What does the company's chart show us ahead of e
See all editors' picks ideas
LogNormalLibrary "LogNormal"
A collection of functions used to model skewed distributions as log-normal.
Prices are commonly modeled using log-normal distributions (ie. Black-Scholes) because they exhibit multiplicative changes with long tails; skewed exponential growth and high variance. This approach i

Range Oscillator (Zeiierman)█ Overview
Range Oscillator (Zeiierman) is a dynamic market oscillator designed to visualize how far the price is trading relative to its equilibrium range. Instead of relying on traditional overbought/oversold thresholds, it uses adaptive range detection and heatmap coloring to reveal where pri

Volume Surprise [LuxAlgo]The Volume Surprise tool displays the trading volume alongside the expected volume at that time, allowing users to spot unexpected trading activity on the chart easily.
The tool includes an extrapolation of the estimated volume for future periods, allowing forecasting future trading activity.
🔶 U

Smooth Theil-SenI wanted to build a Theil-Sen estimator that could run on more than one bar and produce smoother output than the standard implementation. Theil-Sen regression is a non-parametric method that calculates the median slope between all pairs of points in your dataset, which makes it extremely robust to o

Fair Value Gaps by DGTFair Value Gaps
A refined, multi-timeframe Fair Value Gap (FVG) detection tool that brings institutional imbalance zones to life directly on your chart.
Designed for precision, it visualizes how price delivers into inefficiencies across chart, higher, and lower (intrabar) timeframes — offering a fl

TASC 2025.11 The Points and Line Chart█ OVERVIEW
This script implements the Points and Line Chart described by Mohamed Ashraf Mahfouz and Mohamed Meregy in the November 2025 edition of the TASC Traders' Tips , "Efficient Display of Irregular Time Series”. This novel chart type interprets regular time series chart data to create an ir

Simplified Percentile ClusteringSimplified Percentile Clustering (SPC) is a clustering system for trend regime analysis.
Instead of relying on heavy iterative algorithms such as k-means, SPC takes a deterministic approach: it uses percentiles and running averages to form cluster centers directly from the data, producing smoo

Adaptive Volume Delta Map---
📊 Adaptive Volume Delta Map (AVDM)
What is Adaptive Volume Delta Map (AVDM)?
The Adaptive Volume Delta Map (AVDM) is a smart, multi-timeframe indicator that visualizes buy and sell volume imbalances directly on the chart.
It adapts automatically to the best available data resolution

Dynamic Equity Allocation Model"Cash is Trash"? Not Always. Here's Why Science Beats Guesswork.
Every retail trader knows the frustration: you draw support and resistance lines, you spot patterns, you follow market gurus on social media—and still, when the next bear market hits, your portfolio bleeds red. Meanwhile, institution

First Passage Time - Distribution AnalysisThe First Passage Time (FPT) Distribution Analysis indicator is a sophisticated probabilistic tool that answers one of the most critical questions in trading: "How long will it take for price to reach my target, and what are the odds of getting there first?"
Unlike traditional technical indicators

See all indicators and strategies
Community trends
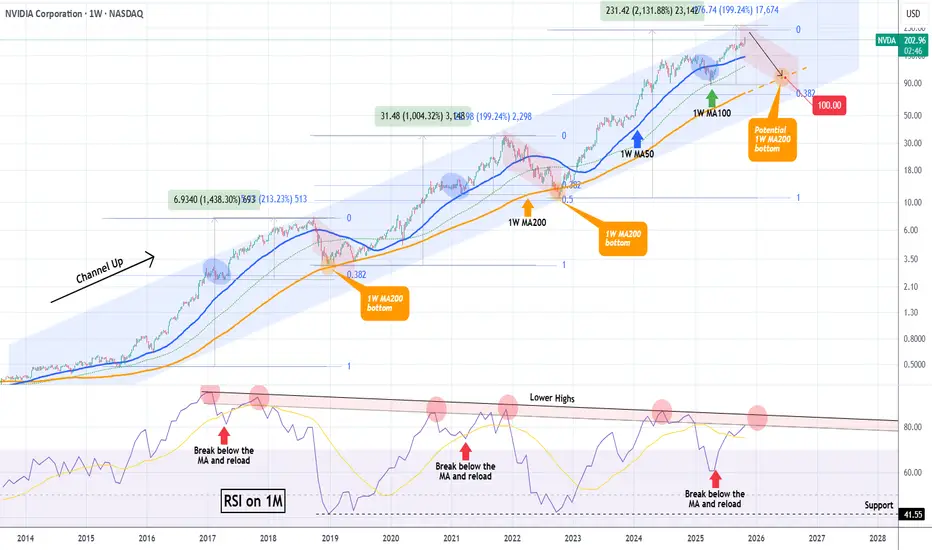
NVIDIA hit $5 Trillion but the end of the rally may be near.NVIDIA Corporation (NVDA) broke this week the $5 Trillion market cap barrier, becoming the first company to do so. In the meantime, it is extending the rally that started on the April 07 Low on the 1W MA100 (green trend-line), following the end of the Tariff War.
This rally has been nothing more th
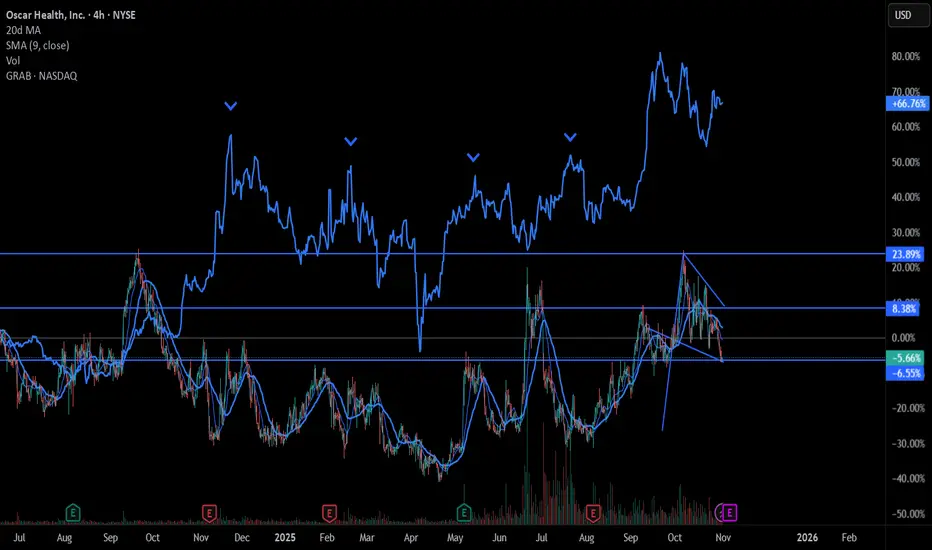
$OSCR Setting Up for a $GRAB-Style Breakout I'm calling this one early. NYSE:OSCR is mirroring the exact 4-peak formation NASDAQ:GRAB just broke out from. NASDAQ:GRAB tapped $6 four times, then blasted off on earnings. Now NYSE:OSCR is building the same pattern at $17, sitting right at the bottom of Bollinger band. RSI has cooled off
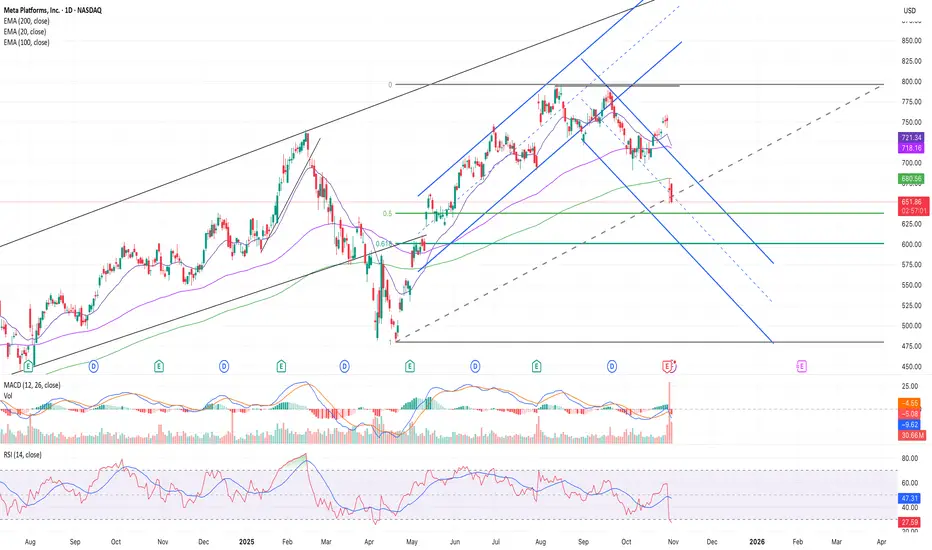
META | Descending Channel & 0.618 Fib SupportMETA is trading inside a descending channel after breaking its main uptrend. Price recently rejected the upper boundary with strong sell volume and a bearish MACD crossover, showing short-term weakness.
The 0.5 Fibonacci level is acting as current support — if price breaks below this, expect a retr
$QCOM Long - Get in while you still can
NASDAQ:QCOM has plenty of room to push, and although their chips don't actually come out for over 1 year from now. Markets are hot for AI, and just like internet companies in the dot com bubble, it does not need actual revenues to run on hype.
I am long and believe we will break all time highs

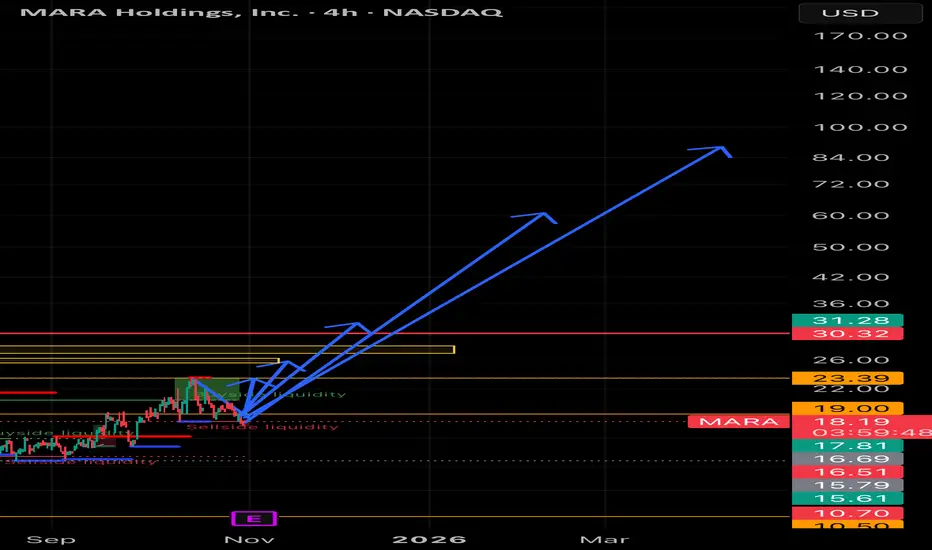
MARA Holdings – Bullish Continuation Setup (Bitcoin Correlation
MARA is showing a similar structure to RIOT and looks primed for a major leg up if Bitcoin strength continues. Price has pulled back into the $17–$18 zone, holding strong structure support and showing signs of accumulation.
From here, I’m watching for a breakout above $19 to confirm momentum, fol
Intensity Therapeutics, Inc. (INTS) Just Tank 21% In Premarket While other stocks were outperforming, Intensity Therapeutics, Inc. (INTS) nosedived over 21% early premarket trading albeit the stock's RSI was 96 during last trading session implying the stock was clearly overbought.
Present market metrics, connotes NASDAQ:INTS might dip further to the $1 sup

BYND gap filled!BYND has successfully filled the gap to $1.54 as anticipated. It might try to fill the gap at $0.67, but a breakout from the descending wedge would invalidate that. We are now observing how the price reacts; so far, the action remains calm.

META: Next Long Term Buy Following a disappointing earnings report, Meta (META) dropped more than 10% in post-market trading, decisively breaking through several key support levels. My primary support zones are typically derived from anchored VWAPs (Volume-Weighted Average Prices), which help identify where institutional bu

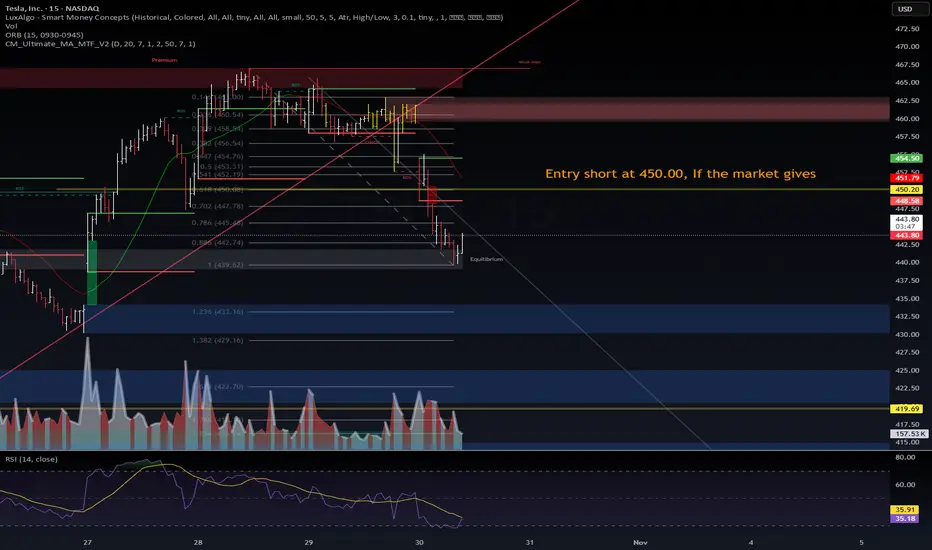
$TSLA | Short Setup Loading — 450 is the Line in the Sand⚙️ NASDAQ:TSLA | Short Setup Loading — 450 is the Line in the Sand
Tesla continues its controlled descent after rejecting the weak high at 465–470.
Price retraced into the 0.786 Fib (≈ 445) zone, finding short-term equilibrium before the next leg.
📊 VolanX DSS Technical Outlook (15m):
Structure
AMD's Tsunami Hitting $10,000+ | 8-Decade Blueprint🔥 FOR OUR DEDICATED FOLLOWER: The AMD Upside Target Blueprint is HERE! 🔥
You asked for clarity on AMD's path forward. This is for you, and for every trader who wants to see the real roadmap.
We've broken down the 3-week super-chart that tells the whole story. This isn't just about the next 10%; it

See all stocks ideas
Nov 3
LLoews Corporation
Actual
—
Estimate
—
Nov 3
MDPediatrix Medical Group, Inc.
Actual
—
Estimate
0.47
USD
Nov 3
LQDALiquidia Corporation
Actual
—
Estimate
−0.39
USD
Nov 3
FRPTFreshpet, Inc.
Actual
—
Estimate
0.42
USD
Nov 3
IDXXIDEXX Laboratories, Inc.
Actual
—
Estimate
3.14
USD
Nov 3
IIIInformation Services Group, Inc.
Actual
—
Estimate
0.04
USD
Nov 3
KTBKontoor Brands, Inc.
Actual
—
Estimate
1.36
USD
Nov 3
UVVUniversal Corporation
Actual
—
Estimate
1.34
USD
See more events
Community trends
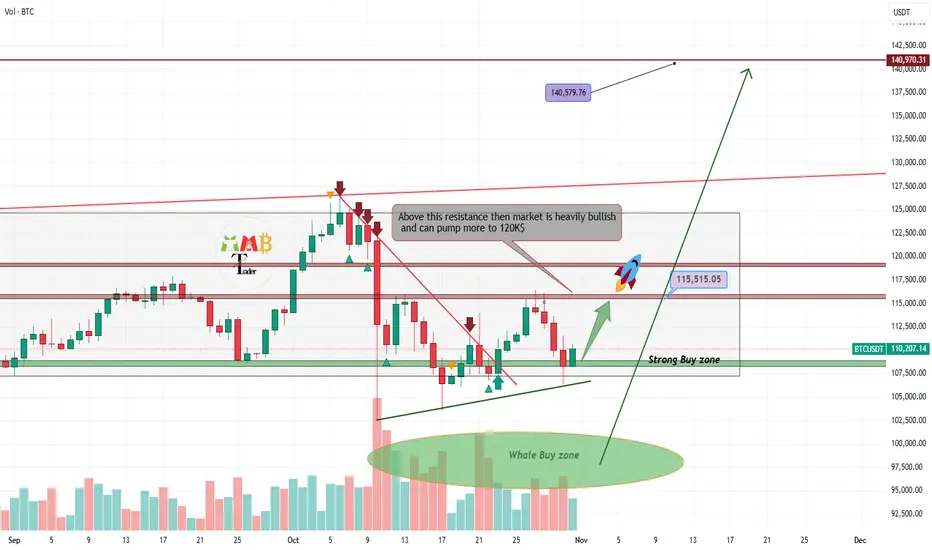
Bitcoin soon will hit 140K$ as new ATHAs the chart illustrates, Bitcoin continues to consolidate within a well-defined range, bounded by the key support at $100,000 and the significant resistance at $117,000. Periods of such compression are typically followed by a decisive directional move, which establishes a new trend path.
Our analy
Ethereum classic - An elder resident of God’s waiting roomAn opening statement: The idea is not restricted to Ethereum Classic (ETC), many legacy tokens are showing the same sequence of events as highlighted in the chart above. The recent update to the OTHERS total idea identifies a few.
Story so far
The Crypto gambling mania of older tokens continue

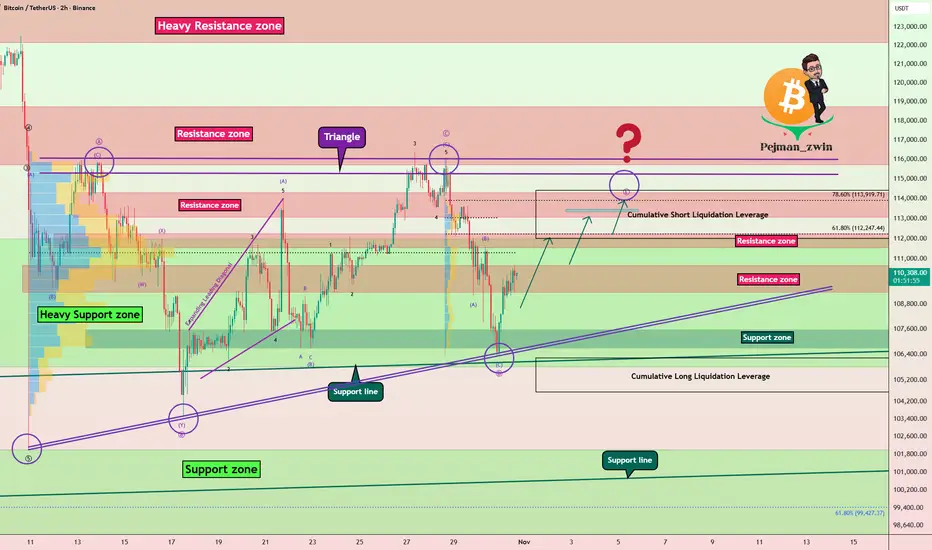
BTCUSD Rebound Setup: Buyers Target 114K Resistance ZoneHello traders, I want to share with you my opinion about Bitcoin (BTCUSD). Bitcoin continues to move within a well-defined descending channel, forming a consistent pattern of lower highs and lower lows. This confirms that the market remains under bearish control, with sellers actively defending each

Bitcoin - This chart is crumbling!⛔️Bitcoin ( CRYPTO:BTCUSD ) creates a massive top:
🔎Analysis summary:
All the previous cycles on Bitcoin have been lasting about 1,000 days. And exactly three years ago, Bitcoin retested the previous all time high, starting the next bullrun. If we soon see bearish confirmation on Bitcoin, thi

Bitcoin - Bull trap, expect 92000 USD in November! (must see)Bitcoin formed a symmetrical triangle, and the triangle broke bullish, but can we really believe this price action, or is it a bullish trap? To trap bulls into buying, but then sending the price down. I see many issues with the current price action.
Price created a CME GAP at around 111,000 USD,

Bitcoin Correction Forming a Triangle – Which Way Next?Bitcoin ( BINANCE:BTCUSDT ), just as I expected in the previous idea , started to decline and reached its full target .
Over the past 20 days , Bitcoin has been moving in a ranging pattern that seems to be forming into a triangle shape .
From an Elliott Wave perspective , this corrective s
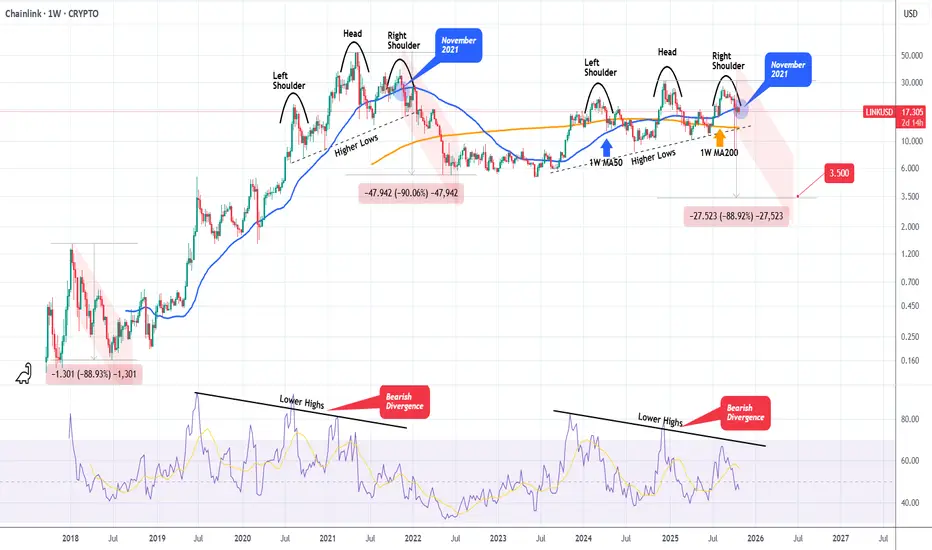
LINKUSD Massive Head and Shoulders starting the new Bear Cycle. Chainlink (LINKUSD) has been steadily rising within a Channel Up during this Bull Cycle but on the recent August 18 2025 High, it failed to make a Higher High and got rejected instead.
The Channel Up seems to have transitioned into a Head and Shoulders (H&S) pattern, while the 1W RSI has been on a
Bitcoin Bullish Breakout Toward 112,000 TargetBitcoin (BTC/USD) is showing bullish momentum, trading above the trend line support. The price is targeting the 112,000 level, with potential resistance zones ahead. A sustained move above 110,000 could confirm further upside continuation.

BTC Analysis 30/10/2025BTC / USDT
Bitcoin is forming a massive ascending wedge pattern, a bearish pattern currently undergoing a bearish retest.
The 200-day EMA is a significant support level and has been tested multiple times in the past few weeks. The more it is retested, the weaker the support becomes.
The sharp dr

BTC Prepares to Complete an ABCDE PatternBTC Prepares to Complete an ABCDE Pattern
On the 4-hour chart, Bitcoin found a strong zone near 106200. It looks like we have a strong zone that the bulls are defending quite strongly.
From the chart, we can see that BTC is developing a larger pattern and if the price respects it, there is a high

See all crypto ideas
XAU/USD | Gold Fills Liquidity Gap – Another Drop Below $3,900?By analyzing the #Gold chart on the 2-hour timeframe, we can see that after reaching the $3,915 demand zone, price reacted strongly and began to rise, filling the liquidity gap created by last night’s drop. Gold is currently trading around $3,973, and if it fails to hold above $4,015, we could see a

GOLD → Consolidation. The fundamental backdrop is changing...FX:XAUUSD stabilizes after a week-long decline, failing to consolidate above $4050. The market is taking a pause before new impulses. Focus on 4030 and 3980...
Investors are closing positions before the end of the week and month, the reason being the uncertainty surrounding the deal with China

GOLD 1H CHART ROUTE MAP UPDATE & TRADING PLAN FOR THE WEEKHey Everyone,
Please see our updated 1h chart levels and targets for the coming week.
We are seeing price play between two weighted levels with a gap above at 4134 and a gap below at 4090. We will need to see ema5 cross and lock on either weighted level to determine the next range.
We will see le

XAGUSDHello Traders! 👋
What are your thoughts on Silver ?
Silver entered a corrective phase following its recent rally and is now trading below the resistance zone and the broken trendline.
This structure suggests weakening bullish momentum and a potential continuation to the downside once the pullback

( Gold Protocol ) Bearish After Break Detected Status: Active Reversal Protocol
Symbol: Gold
Session: London–New York Overlap (Smart Exit Window)
Confidence Level: ★★★★★ ( Hanzo Volume Detected )
☄️ Bearish After Break Out 4005
Reasons
1. Alpha Sequence Engaged
— Smart flow detected within Hanzo precision range.
2. Volume Window Synce

GOLD: Waiting For the Bulls To Join the PartyGOLD: Waiting For the Bulls To Join the Party
From our previous analysis, gold reached the same target twice. The bullish momentum is low, but it could increase over time.
The prevailing trend is evident, which is intact and remains bullish.
Today on the US economic calendar, the PCE data was e

XAUUSD: Bulls vs. Resistance — 4050 Decides the Next MoveIn yesterday’s analysis, I mentioned that after the reversal from the 3920 support zone, Gold (XAUUSD) could continue higher toward the 4050 resistance area.
Indeed, that target has been reached, followed by a 600-pip leg down overnight.
At the moment, the price is resuming its upward move and is

Latest Gold Price Update Today – The Downtrend Isn’t Over Yet👋Hello everyone , great to see you again — let’s take a look at OANDA:XAUUSD !
From a fundamental perspective, gold remains range-bound as the US dollar (USD) shows a strong recovery following remarks from Fed Chair Jerome Powell during Wednesday’s press conference.
On the technical chart, go

XAUUSD major pump not finished yet Gold has initiated a short-term corrective phase, with technical indicators suggesting potential for further downside in the immediate term. However, this near-term weakness does not alter our constructive long-term fundamental and technical outlook.
The broader macroeconomic backdrop, including fa

XAU/USD (Gold Spot vs. U.S. Dollar) on the 30-minute timeframe..XAU/USD (Gold Spot vs. U.S. Dollar) on the 30-minute timeframe, using the Ichimoku Cloud with a clearly drawn ascending trendline providing support.
Here’s what’s visible:
Current price: around $4,002 – $4,009.
The price is sitting above the trendline and at the edge of the cloud, suggesting poss

See all futures ideas
GBPAUD Textbook Bear FlagGBPAUD price had been falling sharply, sellers were in full control, driving the market lower with strong bearish momentum.
Then came a pause. Price started climbing slowly, forming a rising channel. That’s the bear flag. Buyers are trying to recover, but it is weak and hesitant, every push higher

EURUSD: Bounce from Support Could Trigger Move Toward 1.1640Hello everyone, here is my breakdown of the current Euro setup.
Market Analysis
EURUSD has been trading in a corrective phase after breaking down from the Upward Channel that previously guided its bullish movement. The pair formed a Range near the 1.1760 Resistance Area, showing consolidation bef

Hawkish Fed Tone Caps EURUSD Near 1.1580!!Hey Traders, in today’s trading session we’re monitoring EURUSD for a potential selling opportunity around the 1.15800 zone.
The pair remains in a downtrend, and the current correction phase is bringing price back toward the 1.15800 resistance area, aligning with the broader bearish structure.
On t

Lingrid | USDCHF Structure Based Trade SetupFX:USDCHF is trading near the upper boundary of its multi-week range, testing the resistance zone at 0.8050–0.8060. Price action shows repeated rejections from this area while maintaining a higher-low structure supported by an ascending trendline. A short-term pullback toward 0.7980 could occur bef

CHF/JPY: Confirmed Intraday Bullish SignalI spotted an additional instance aligning with my breakout trading strategy.
The 📈CHFJPY pair showed a decisive violation and close above a significant intraday horizontal resistance level.
Following this, the price retested the broken structure and subsequently breached the resistance line of a f

Euro Finds Support — Correction Phase Targets 1.16340Hello traders! I’d like to share my view on the current EUR/USD market structure. After a strong bullish impulse within the ascending channel, the price faced rejection near the Resistance Level around 1.16600, where sellers stepped in, forming a clear turnaround structure. Following that, the pair

A 30-Minute Look at USDJPY AnalysisHello friends,
I have prepared my USDJPY analysis for you.
In this analysis, I plan to open a buy position between the 154.003 and 153.831 levels, aiming for the 154.453 level.
This analysis has been carried out on the 30-minute timeframe.
Once my target is reached, I will share the update

USD/JPY bullish breakout bullish move watch resistance🚀 USD/JPY Technical Update 🇺🇸🇯🇵
The pair is looking bullish 🔥 — showing strong momentum after a resistance breakout! More buying opportunities may open up once we see a confirmed breakout above 154.300 📈
🎯 Key Resistance Levels:
155.600 🧱
156.700 🚧
📊 Timeframe: 4H ⏰
⚠️ Always remember — prope

USD/JPY 30-Min — Volume Bearish Reversals TriggeredStatus: Active Reversal Protocol
🆚Symbol: USDJPY
Session: London–New York Overlap (Smart Exit Window)
bearish Reversal : 154.150
☄️ Volume Surge Confirmed — Sellers dominate exhausted highs
☄️ Session Aligned — Smart money exit window open
☄️ Cluster Shield Active — Supply imbalance verified

EUR/USD Faces Renewed Downside Pressure as Sellers DominateHello everyone, the EUR/USD pair is showing clear signs of weakness as sellers continue to dominate, pushing the price back to around 1.1550 after a brief rebound. On the H4 timeframe, the market structure remains in a medium-term downtrend with a series of lower highs and lower lows, confirming co

See all forex ideas
| - | - | - | - | - | - | - | ||
| - | - | - | - | - | - | - | ||
| - | - | - | - | - | - | - | ||
| - | - | - | - | - | - | - | ||
| - | - | - | - | - | - | - | ||
| - | - | - | - | - | - | - | ||
| - | - | - | - | - | - | - | ||
| - | - | - | - | - | - | - |
Trade directly on the supercharts through our supported, fully-verified and user-reviewed brokers.


