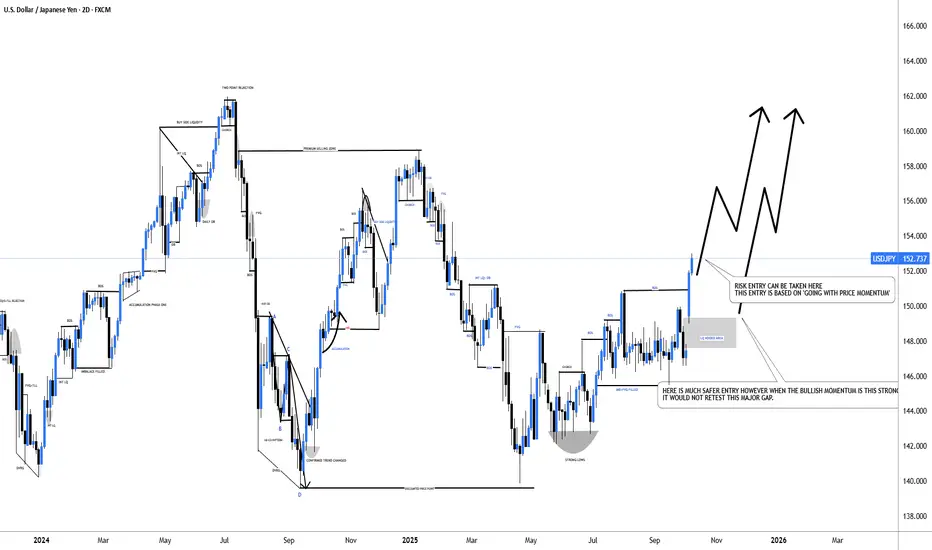
#USDJPY: From +1100 Pips To +1350 Pips A Possible Swing BuyDear Traders,
I hope you’re all having a great trading week!
The USDJPY is currently trading in a 152 price range and is experiencing extreme bullish momentum. The price is rallying without making any corrections, primarily due to the collapse of the Yen. We may see it fall further below. Given th

The best trades require research, then commitment.
Get started for free$0 forever, no credit card needed

Scott "Kidd" PoteetThe unlikely astronaut

Where the world does markets
Join 100 million traders and investors taking the future into their own hands.
Major indices
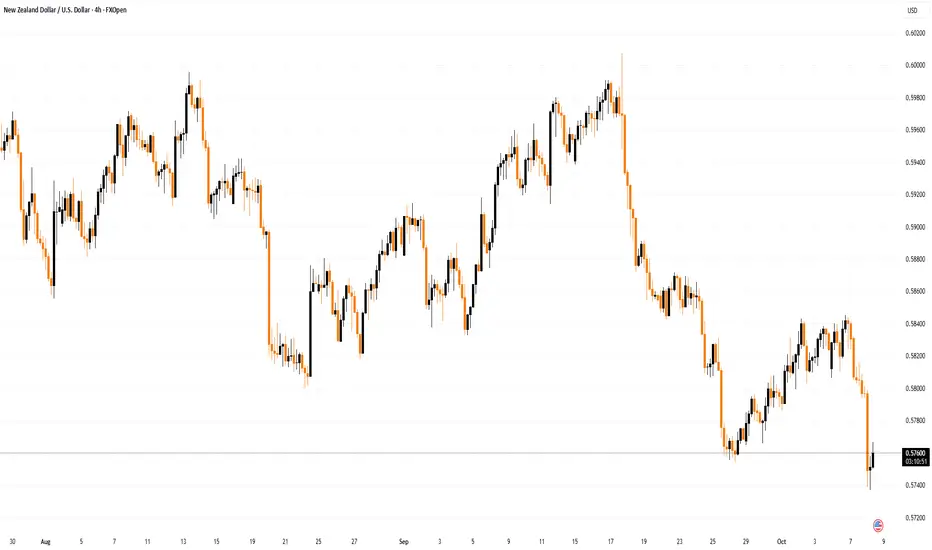
NZD/USD Rate Drops Sharply After Central Bank DecisionNZD/USD Rate Drops Sharply After Central Bank Decision
This morning, the Reserve Bank of New Zealand (RBNZ) cut its key interest rate. According to Forex Factory, the Official Cash Rate was reduced by 50 basis points from 3.0% to 2.5%, while most analysts had expected a smaller cut to 2.75%.
More
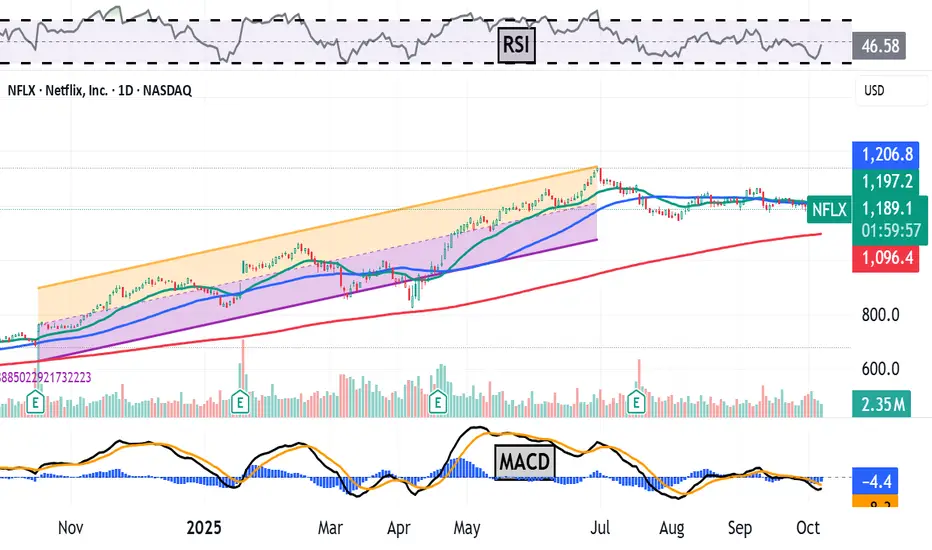
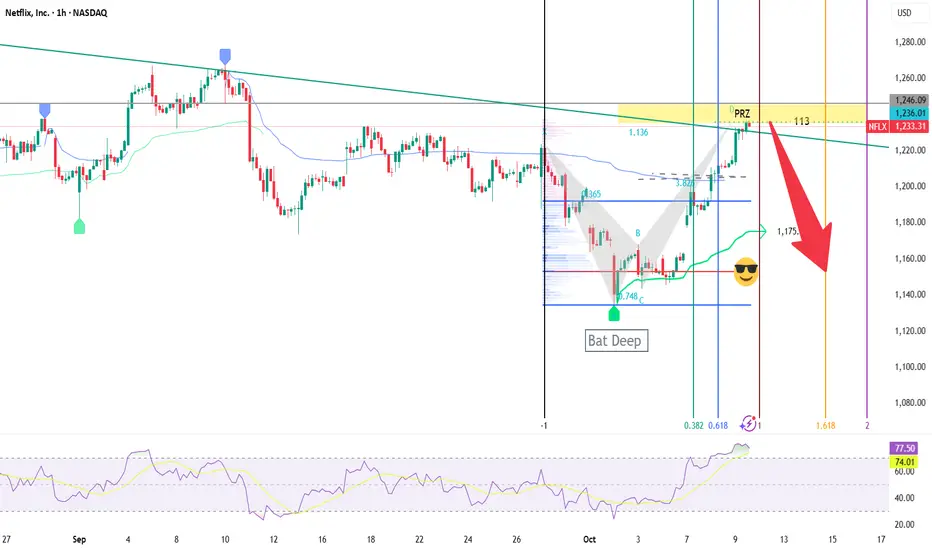
Netflix Is -11% Since June's All-Time High. What Its Chart SaysNetflix NASDAQ:NFLX has fallen more than 10% since hitting an all-time high in June, but the streaming giant is still beating the S&P 500 SP:SPX in the year-to-date, one-year and five-year periods. What does technical and fundamental analysis say is going on?
Let's take a look:
Netflix's Fund
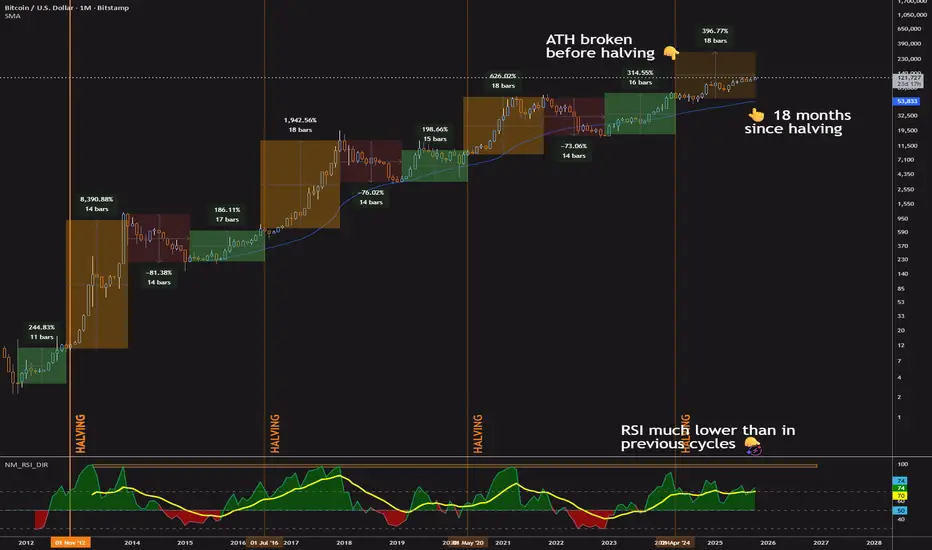
Is Bitcoin's 4-Year Cycle Over? Bitcoin’s 4-year cycle has been a go-to for traders, driven by halving events that spark price surges, sharp corrections, and recovery periods. But something’s off this time.
We’re 18 months into the post-2024 halving rally—hitting the historical peak for bull runs—yet there’s no sign of a crash,
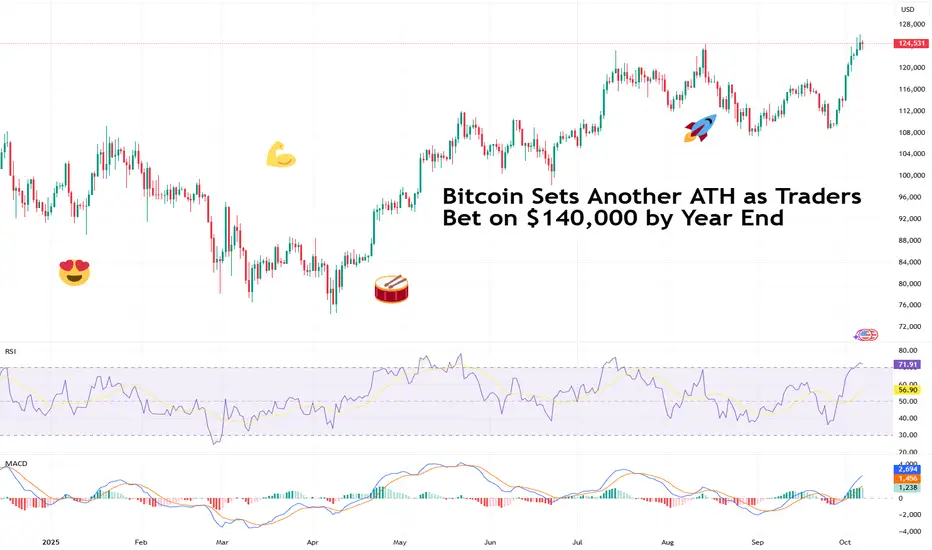
Bitcoin Sets Another ATH as Traders Bet on $140,000 by Year EndBlink and you’ll miss it. Bitcoin’s recent leg up caught lots of traders unprepared. After sinking below $110,000 few weeks back, the OG coin slingshotted to a fresh record high above $126,000 this week. Not a bad way to start October Uptober .
Now, traders are adding to bets that the price will
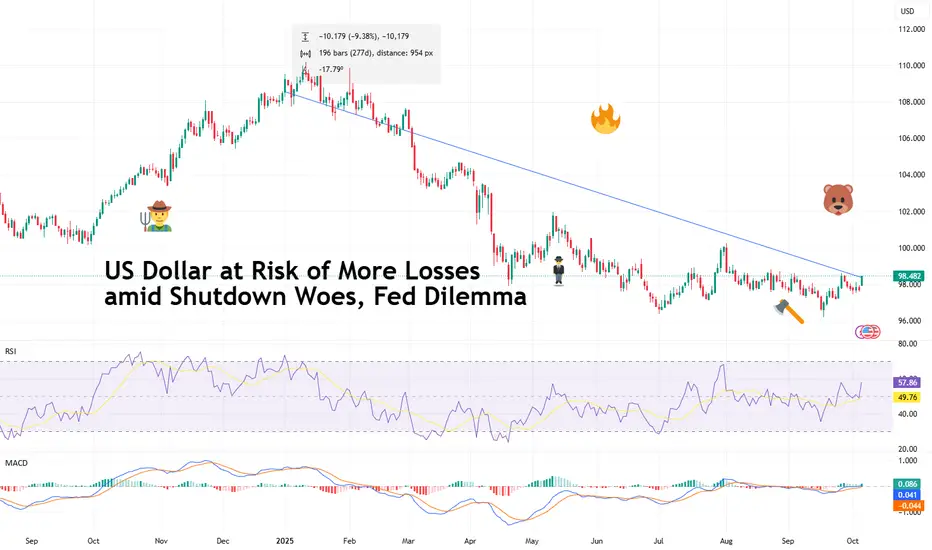
US Dollar at Risk of More Losses amid Shutdown Woes, Fed DilemmaThe US dollar TVC:DXY has been knocked by last week’s US government shutdown and the subsequent economic blackout. At the same time, the Federal Reserve can’t figure out what’s worse – inflation or job crunch.
After Congress failed to pass a funding bill, the government officially went dark at
Retro Editors' picks 2024Closing our retro EP selection , we present to you the last collection of additional scripts that have earned a spot in our Editors' picks, in this case from 2024.
These retrospective selections reflect our continued commitment to honoring outstanding contributions in our community, regardless of

SILVER (XAG/USD): One More Bullish Wave is Coming?!⚠️ SILVER appears to be confined within a horizontal range, as observed on the 4-hour chart. The price is currently nearing the upper limit of this range.
Given the prevailing strong bullish trend, there is a considerable likelihood of a continued upward movement.
A breakout and a 4-hour candle cl

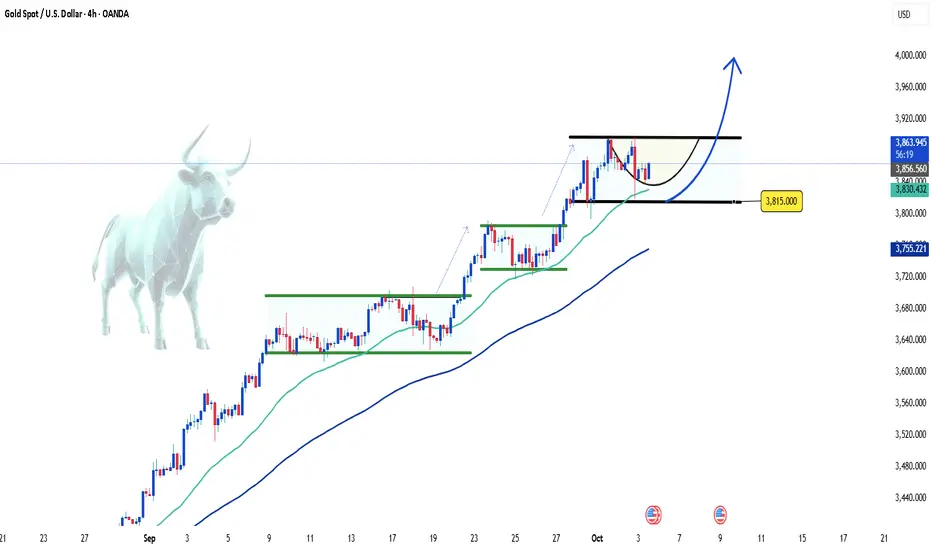
Gold Continues to Challenge Record Resistance Levels👋Hello everyone, what are your thoughts on OANDA:XAUUSD ?
As of this writing, gold continues its upward momentum, having reached new highs as investors increase their bets on the Federal Reserve cutting interest rates in the near future. The concerns over the U.S. government shutdown and global e
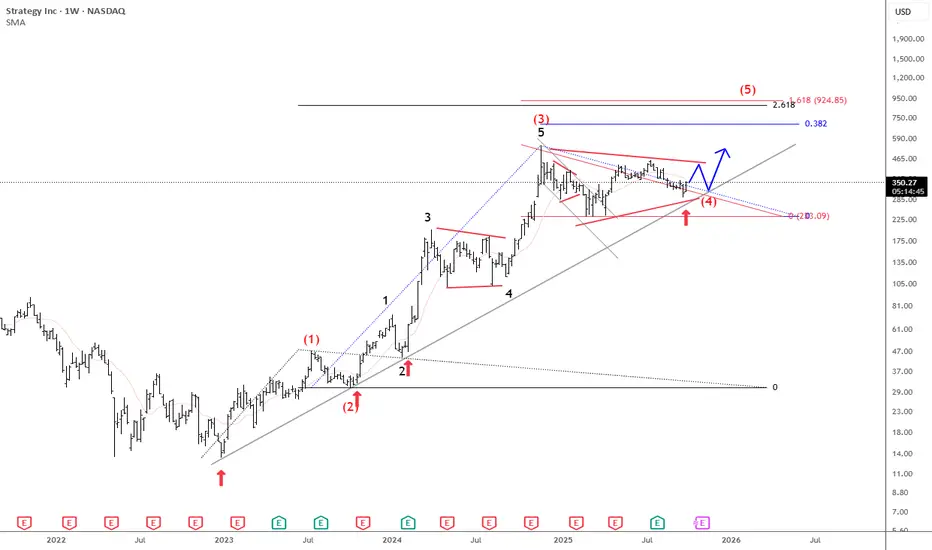
Microstrategy Is Still Pointing Higher For The Final 5th WaveMicrostrategy is a US business intelligence and software company, but it has become best known for its aggressive Bitcoin strategy. Under co-founder Michael Saylor, the company shifted from focusing mainly on software to also using Bitcoin as its primary treasury reserve asset.
Since 2020, MicroStra
See all editors' picks ideas
Dynamic Equity Allocation Model"Cash is Trash"? Not Always. Here's Why Science Beats Guesswork.
Every retail trader knows the frustration: you draw support and resistance lines, you spot patterns, you follow market gurus on social media—and still, when the next bear market hits, your portfolio bleeds red. Meanwhile, institution

First Passage Time - Distribution AnalysisThe First Passage Time (FPT) Distribution Analysis indicator is a sophisticated probabilistic tool that answers one of the most critical questions in trading: "How long will it take for price to reach my target, and what are the odds of getting there first?"
Unlike traditional technical indicators

PongExperience PONG! The classic arcade game, now on your charts!
With this indicator, you can finally achieve your lifelong dream of beating the Markets. . . at PONG!
Pong is jam-packed with features! Such as:
2 Paddles
A moving dot
Floating numbers
The idea of a net
This indicator is solel

Options Max Pain Calculator [BackQuant]Options Max Pain Calculator
A visualization tool that models option expiry dynamics by calculating "max pain" levels, displaying synthetic open interest curves, gamma exposure profiles, and pin-risk zones to help identify where market makers have the least payout exposure.
What is Max Pain?
Max

Volume Profile 3D (Zeiierman)█ Overview
Volume Profile 3D (Zeiierman) is a next-generation volume profile that renders market participation as a 3D-style profile directly on your chart. Instead of flat histograms, you get a depth-aware profile with parallax, gradient transparency, and bull/bear separation, so you can see w

RiskMetrics█ OVERVIEW
This library is a tool for Pine programmers that provides functions for calculating risk-adjusted performance metrics on periodic price returns. The calculations used by this library's functions closely mirror those the Broker Emulator uses to calculate strategy performance metrics (

Simple Decesion Matrix Classification Algorithm [SS]Hello everyone,
It has been a while since I posted an indicator, so thought I would share this project I did for fun.
This indicator is an attempt to develop a pseudo Random Forest classification decision matrix model for Pinescript.
This is not a full, robust Random Forest model by any stretch o

Tick CVD [Kioseff Trading]Hello!
This script "Tick CVD" employs live tick data to calculate CVD and volume delta! No tick chart required.
Features
Live price ticks are recorded
CVD calculated using live ticks
Delta calculated using live ticks
Tick-based HMA, WMA, EMA, or SMA for CVD and price
Key tick levels (S

analytics_tablesLibrary "analytics_tables"
📝 Description
This library provides the implementation of several performance-related statistics and metrics, presented in the form of tables.
The metrics shown in the afforementioned tables where developed during the past years of my in-depth analalysis of various str

Adaptive Trend Classification: Moving Averages [InvestorUnknown]Adaptive Trend Classification: Moving Averages
Overview
The Adaptive Trend Classification (ATC) Moving Averages indicator is a robust and adaptable investing tool designed to provide dynamic signals based on various types of moving averages and their lengths. This indicator incorporates multipl

See all indicators and strategies
Community trends
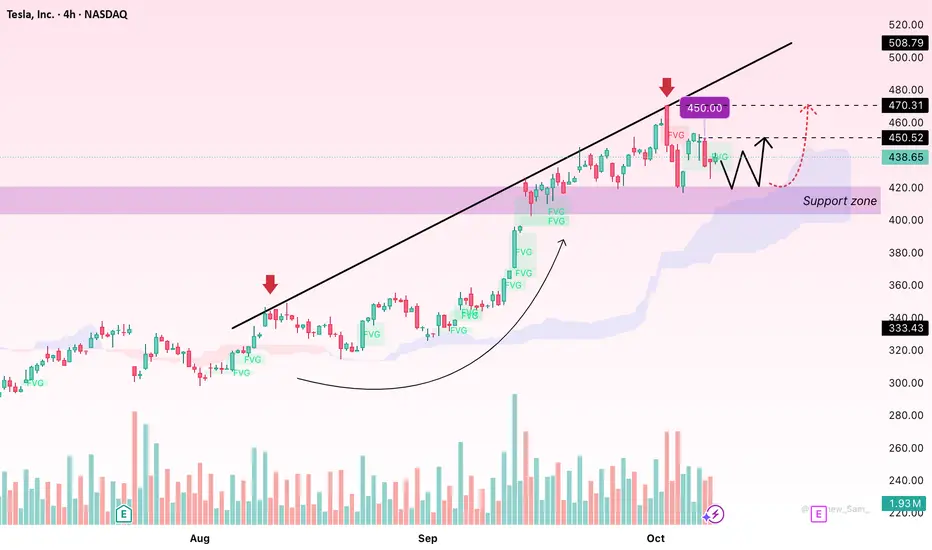
TSLA – Mild Pullback Before Resuming Its Upward TrajectoryHello everyone,
Tesla (TSLA) is showing a healthy technical pullback after an impressive rally, yet the broader bullish trend remains intact. The stock is currently hovering around $438.69, down 4.5% in the latest session — a move that reflects short-term profit-taking rather than a shift in marke
Falling Wedge on NFLX: Set for a Break?Price on NASDAQ:NFLX has been consolidating inside a falling wedge, with each swing showing weaker momentum from sellers. And buyers are slowly stepping back in.
A strong breakout above the upper trendline would confirm bullish strength and signal a potential continuation toward the 1,400.00 leve

SWK (long): something big might be comingStanley Black & Decker (weekly): Everyone knows it. Nobody trades it. The horizontal S/R trendline goes back to 2013. I dont think the tariff headwinds for the stock will be as strong as the rate cut regime tailwinds which should unlock the housing market. Inside candle last week after taking ou

NVIDIA Next stop.. $200For a long time we've been calling for a $200 Target on NVIDIA Corporation (NVDA). That was our main Target for the Bull Cycle that started in November 2022. The stock is very close to this level and the short-term pattern that can get to it is this Channel Up.
Supported by the 1H MA100 (green tren

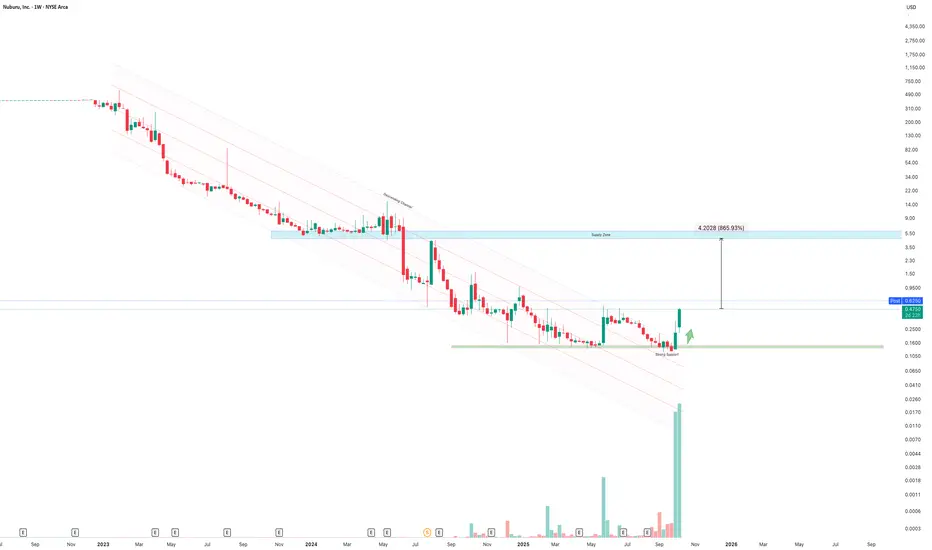
Buru to $5.00 NearTerm?!The chart illustrates a confirmed breakout from a long-term descending channel following an extended period of accumulation near strong support around $0.16–$0.20. A powerful volume surge — the largest in the stock’s history — confirms strong momentum and potential trend reversal.
Price has now clo
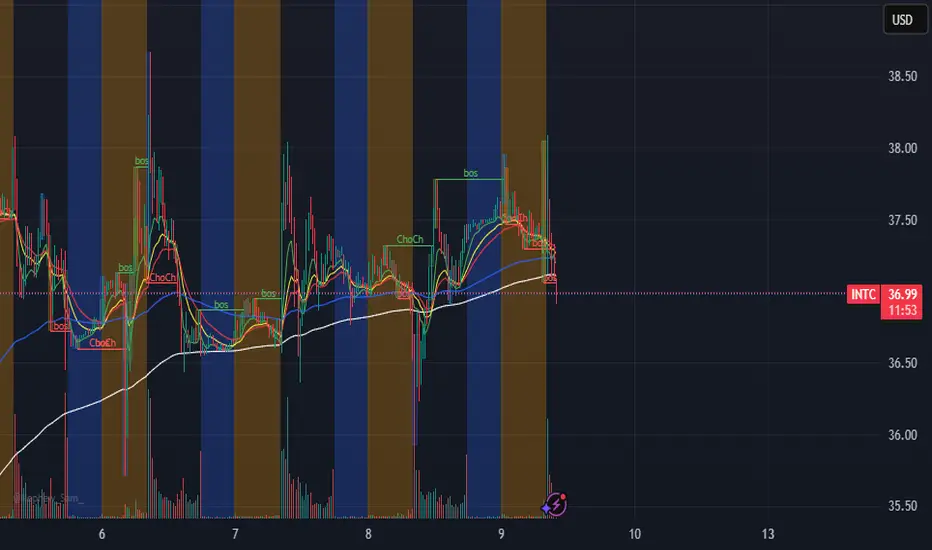
Initiation of Coverage of intel: Rating: BuyReason: over the last several months Intel has aligned itself with multiple competitors as of late. Its latest involvement with AMD, and AMD’s involvement with Open AI will prove a formidable player in the AI realm along with those of the semiconductor business.
Price target $55
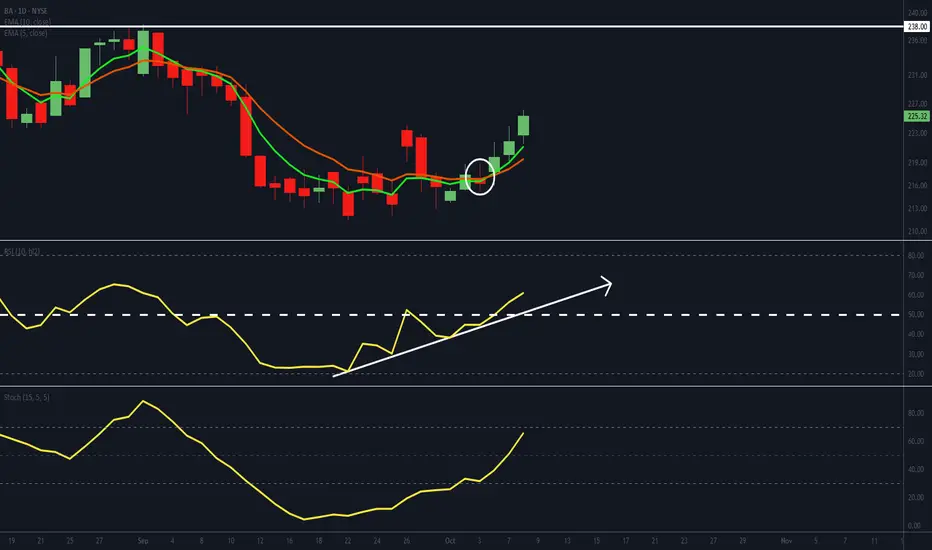
BA setting up for potentially strong move
- BA's EMAs have crossed bullishly and are developing angle and separation.
- Its RSI has popped above 50, suggesting a shift to positive momentum.
- Its stochastic is on the borderline to cross through 70. A move above, will add to the positive momentum argument. The longer it maintains above 70,
NFLX I did some analysis as per harmonic pattern school and with fibo time to check and it seems time to change direction down. also, i add RSI and volume profile to support. this is not recommendation to buy its just sharing information for learning purpose.
Breakout Incoming!Tesla remains within a well-defined channel range, consolidating near lower channel support on declining volume, which reflects healthy consolidation after prior momentum. The recent action has formed a symmetrical triangle, with price compressing between rising support and descending resistance — a

BUY FMC CORP!!!!We have finally reached our significant demand zone where we can expect this bear cycle to bottom out with attractive targets.
Good luck

See all stocks ideas
Today
VFSVinFast Auto Ltd.
Actual
—
Estimate
−0.26
USD
Today
CMTLComtech Telecommunications Corp.
Actual
—
Estimate
−0.75
USD
Today
UNTYUnity Bancorp, Inc.
Actual
—
Estimate
1.29
USD
Today
LFCRLifecore Biomedical, Inc.
Actual
—
Estimate
−0.31
USD
Today
CCELCryo-Cell International, Inc.
Actual
—
Estimate
−0.03
USD
Today
GMGIGolden Matrix Group, Inc.
Actual
—
Estimate
−0.00
USD
Today
WAFDWaFd, Inc.
Actual
—
Estimate
0.77
USD
Oct 13
FASTFastenal Company
Actual
—
Estimate
0.30
USD
See more events
Community trends
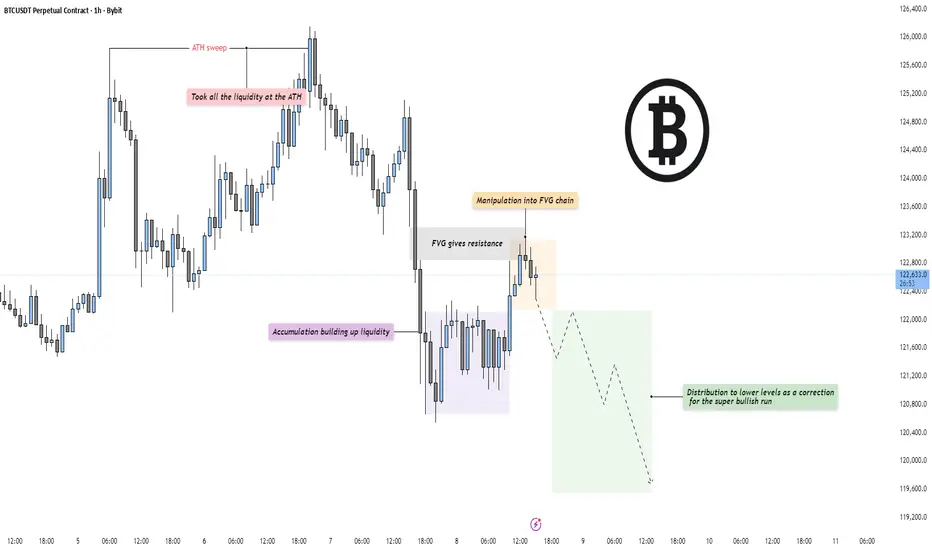
BTC - Distribution after ATH sweepMarket Context
Bitcoin has completed a clear liquidity sweep at the all-time high (ATH) and is now transitioning into a corrective phase. After taking all the liquidity above the prior high, price aggressively rejected and shifted structure to the downside, signaling that smart money may now be eng
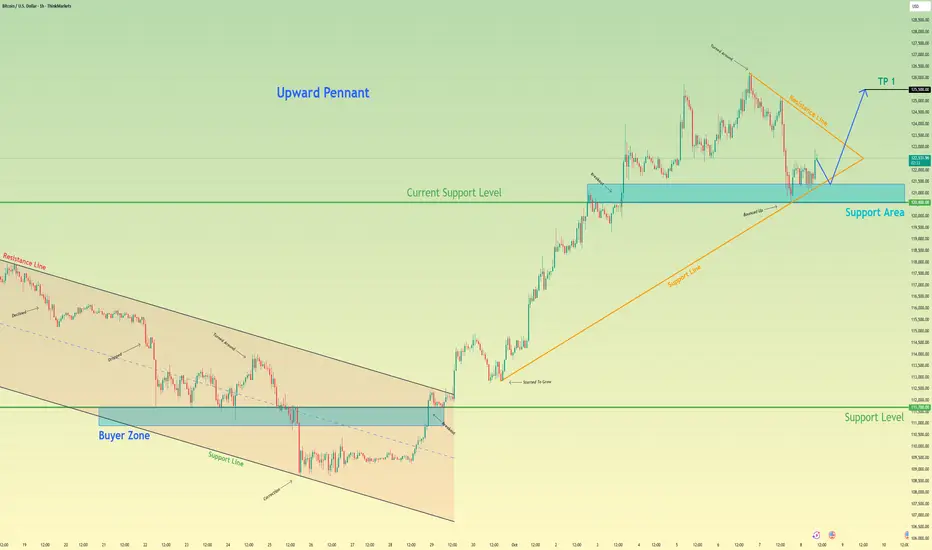
Bitcoin will Bounce From Pennant Support and Rally HigherHello traders, I want share with you my opinion about Bitcoin. The market structure for Bitcoin has recently undergone a major transition from bearish to bullish, following a decisive reversal from the 111700 support level. This shift triggered a breakout from the previous descending channel and gav
Solana - We have to see new all time highs!🚀Solana ( CRYPTO:SOLUSD ) has to break out:
🔎Analysis summary:
Over the course of the past couple of months, Solana has been rallying another +100%. This rally ultimately resulted in another, third retested of the previous all time high. And if Solana now creates bullish confirmation, we can

ETH/USDT: Two shortsHi guys!
Overall Market Structure
The price has been moving within a rising parallel channel, making higher highs and higher lows, which forms a bullish structure.
Recently, however, the price broke below the lower boundary of the ascending channel, signaling a potential bearish reversal or a cor

COAIUSDT 3-Drive Pattern in Motion 88x Journey Underway Altcoins are reminding every doubter what altseason truly looks like.
COAI is currently one of the standout performers, unfolding a Cup & Handle breakout and now forming a 3-Drive bullish pattern that could complete a potential 88x move from base to target.
• Cup & Handle breakout confirmed ✅
• D

XRP Holds Strong Support – Possible Rebound AheadXRP Holds Strong Support – Possible Rebound Ahead
XRP is currently testing a major support zone around 2.70, which has already held strong several times in the past (as shown by the previous reactions in early September and late September).
As long as the price stays above this support, there’s a

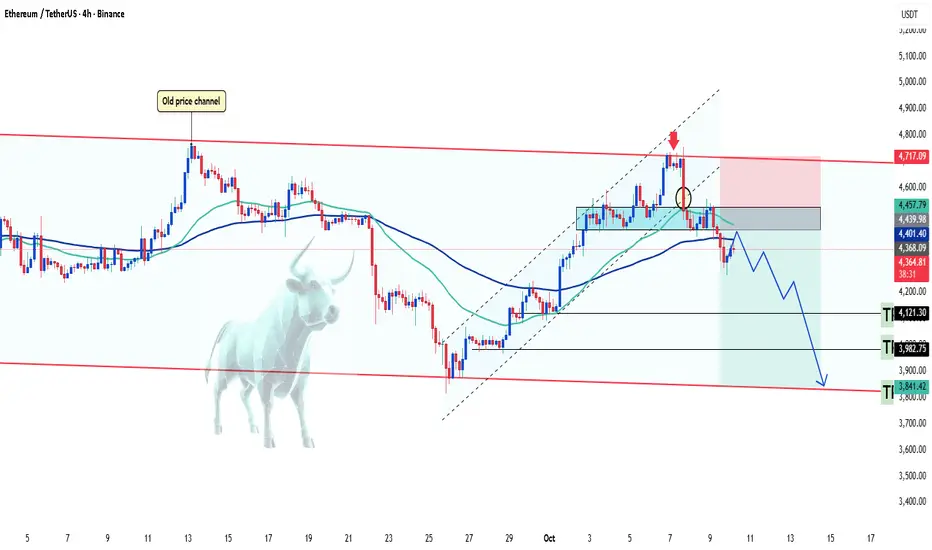
ETHUSDT - Reversal at Key Resistance Level👋Hello everyone, what do you think about the trend of BINANCE:ETHUSDT ?
Previously, I expected ETHUSDT to form a flag pattern and break out of the price channel. However, the buying momentum was not strong enough, and ETHUSDT pulled back when it encountered the upper boundary of the channel.
Lo
TOTAL 3 UPDATE !!The TOTAL3 chart is showing some cautionary signs but has not yet broken the key trendline. The price is testing this support level, and a breakout below the trendline will be crucial for determining the next move. Currently, the price is holding above the trendline, but if we see a close below this

BTCUSD: Rally between Trend Line can ContinueHello everyone, here is my breakdown of the current Bitcoin setup.
Market Analysis
From a broader perspective, the market for Bitcoin has been through a very complex and volatile consolidation. After multiple failed moves and tests of both the 108800 Support and the 118000 resistance, the price

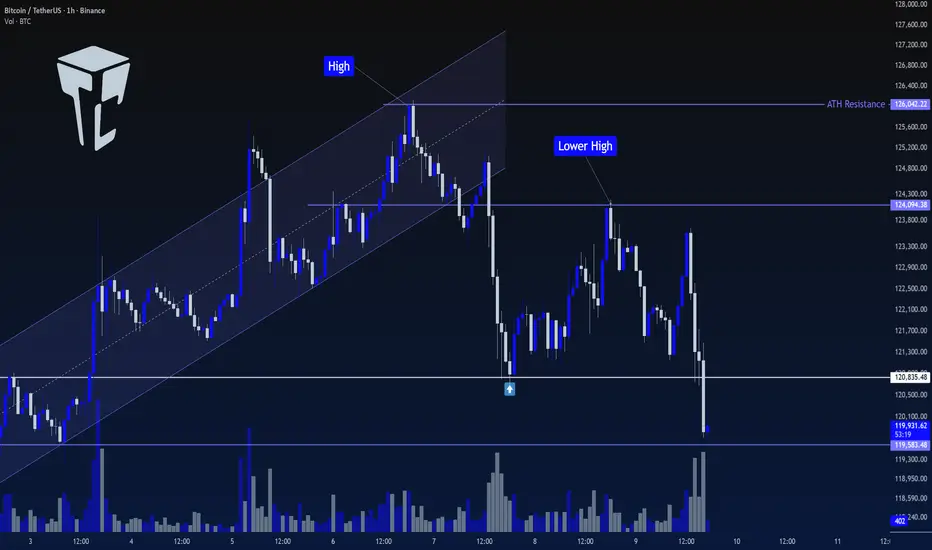
TradeCityPro | Bitcoin Daily Analysis #191👋 Welcome to TradeCity Pro!
Let’s get into Bitcoin analysis. The market is still in a ranging phase, so let’s take a look at today’s triggers together.
⌛️ 1-Hour Timeframe
In this timeframe, Bitcoin is still consolidating and has formed a new range high around 124,094.
✔️ Right now, the price is n
See all crypto ideas
Gold Lacks a Healthy CorrectionGold has been trending steadily within an ascending channel, with buyers keeping control and driving price higher and higher.
And recently price broke above the channel, but it lacked conviction and price is falling back inside the channel.
This might signal buyer exhaustion and a potential shift
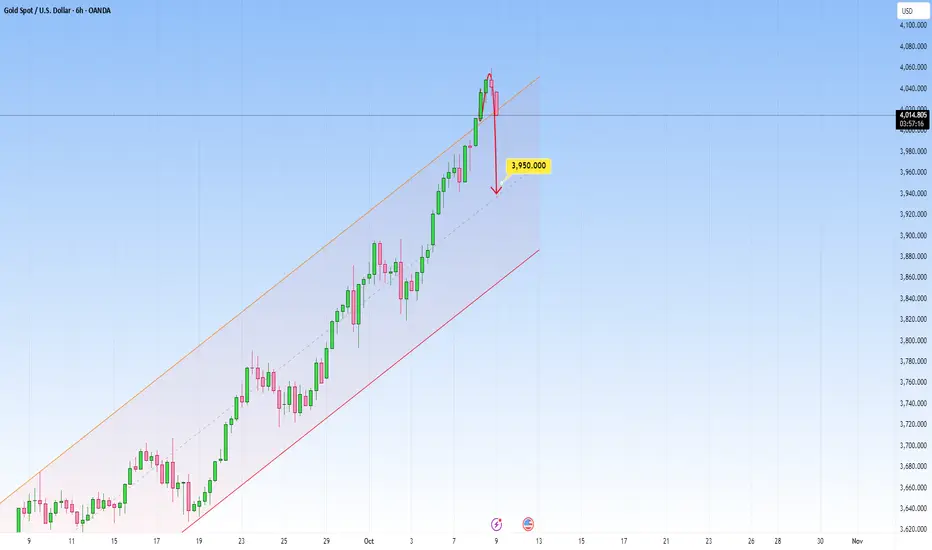
GOLD → The correction will provide a good opportunity for longFX:XAUUSD remains above the psychologically important level of $4,000, having corrected from a record high of $4,059. The market is awaiting Powell's speech, which could set the medium-term tone for the markets...
Key supporting factors: Uncertainty over the shutdown: The phased reopening plan
Xauusd again Bullish SetupGold (XAU/USD) is trading near the demand zone after a pullback. Price is expected to bounce from support around 4020 toward the target level of 4082. Buy setup active with stop loss below 3995.

Gold Bullish Setup Targeting New ATHThis XAU/USD 1-hour chart shows gold trading around 4039 with a bullish setup. Price is respecting the support trend line, confirming upward momentum. Key support is marked near 4001, providing a strong base for buyers.
The chart highlights the previous ATH at 4060 and projects a potential breakout

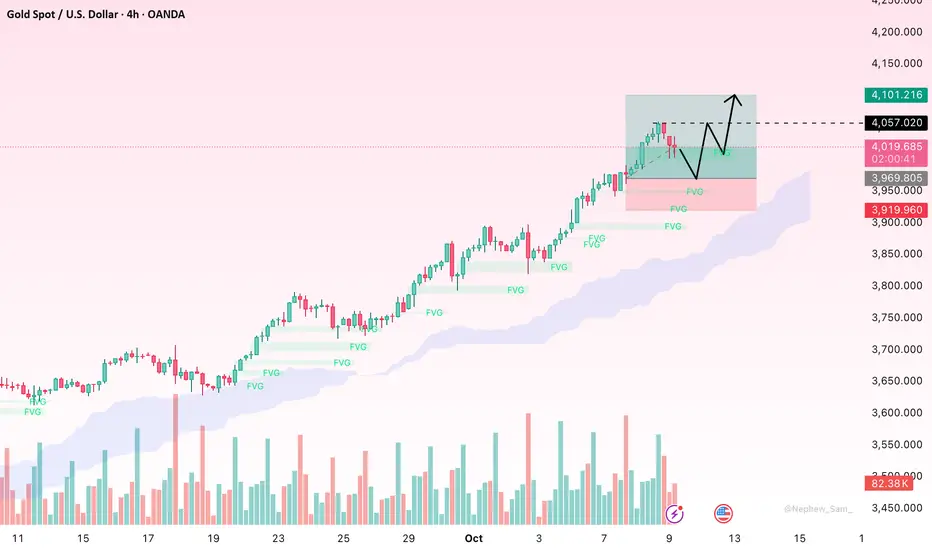
XAU/USD – Uptrend Persists After a Brief CorrectionHello everyone,
Gold is currently taking a natural pause after an impressive October rally. After reaching a peak near $4,036, prices pulled back slightly to around $4,021, yet the overall structure remains firmly bullish. The stepwise Fair Value Gaps (FVG) continue to form and fill shallowly — a
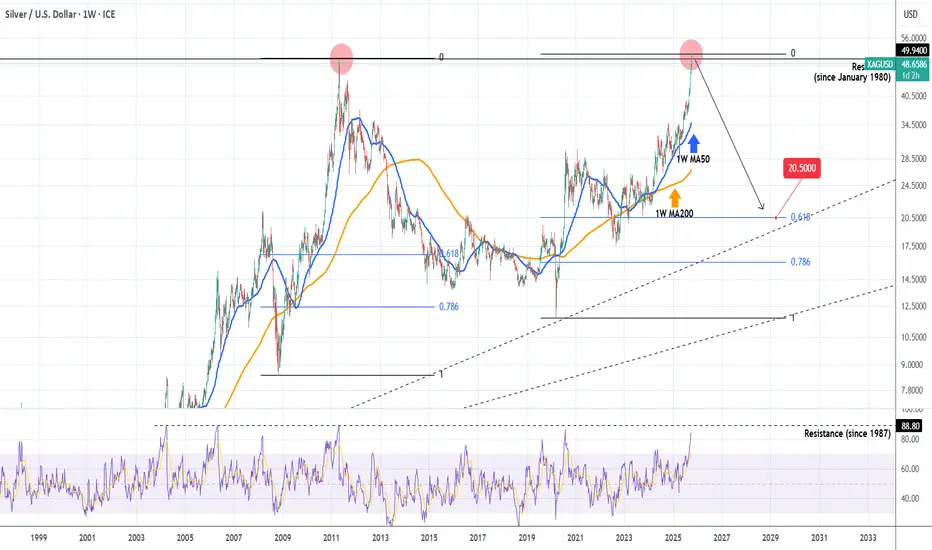
SILVER made new ATH. Multi-year Bear Cycle starting.Last time we took a look at Silver (XAGUSD) (August 22, see chart below), we had a clear buy signal on its 1D MA50 at the bottom of the Channel Up, that quickly hit our 4050 Target:
The pattern even broke aggressively upwards and this week crossed the 49.9400 Resistance, which is the All Time H
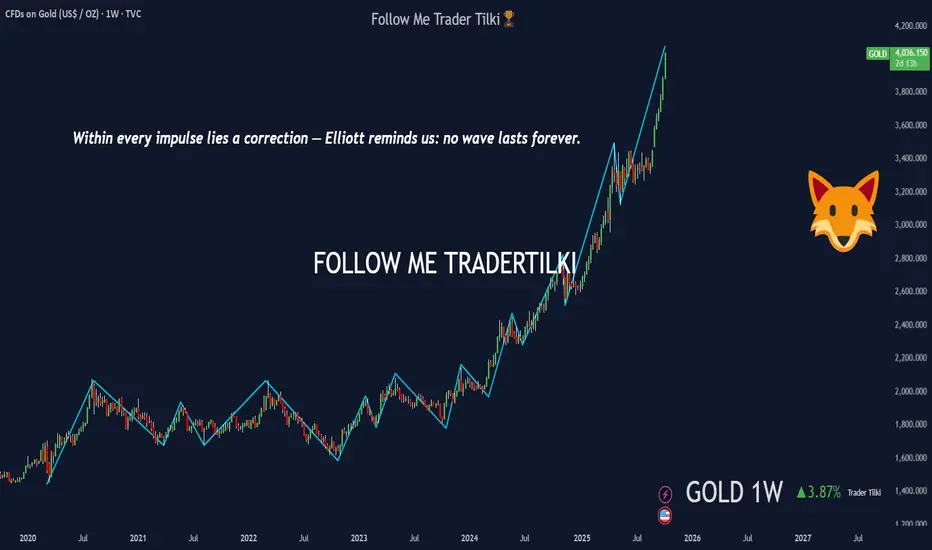
Impulse and Correction — XAUUSD-GOLD InformationElliott Wave Perspective on Gold
Gold is now testing the $4,000 level, marking one of its historic highs. On a yearly basis, the metal has been in a strong uptrend for a long time. But Elliott Wave Theory reminds us: no impulse lasts forever — every rally hides a correction.
At some point, this cl
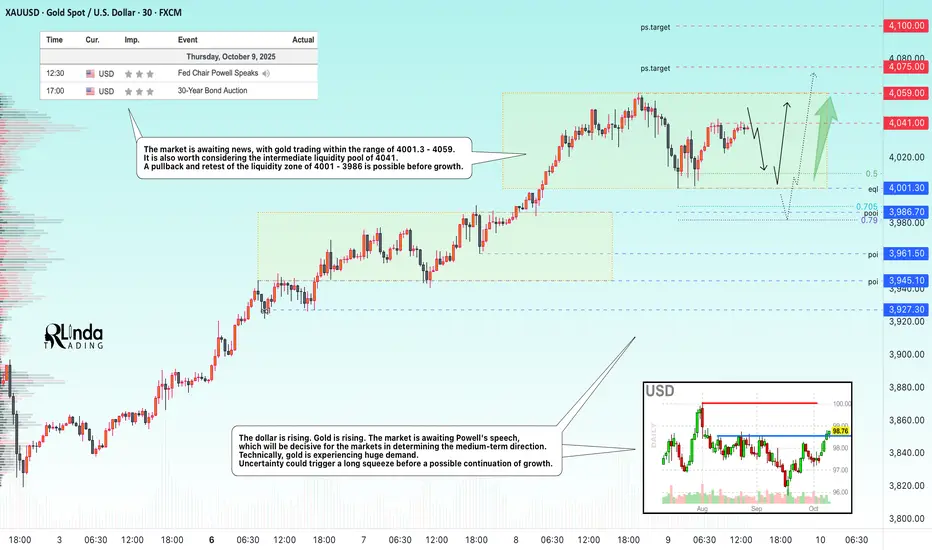
Latest Gold Price Update Today👋Hello everyone, let's take a look at OANDA:XAUUSD !
Gold has just experienced an incredible surge, briefly reaching 4059 USD, setting a new historic high. This recent upward movement continues to be supported by the ongoing US government shutdown and various geopolitical uncertainties, which hav

SILVER (XAG/USD): Bullish Rally ContinuesIt appears that 📈SILVER is expected to continue its upward trend, potentially reaching the 50.00 psychological level.
The observed break of structure on the 4-hour chart suggests a strong presence of buyers.
Given the lack of significant US news today, the market is anticipated to maintain a bulli

Gold can Push Towards a New High of 4150Hello traders, I want share with you my opinion about Gold. The market for Gold has been defined by a strong and sustained bullish momentum, which began after the price broke out of a prolonged consolidation range with support from the 3380 buyer zone. This structural shift initiated a new uptrend,

See all futures ideas
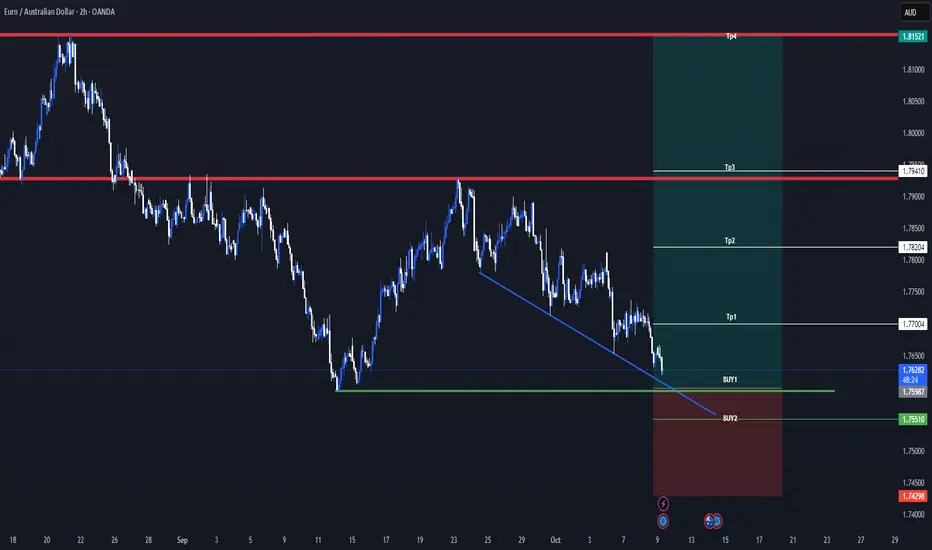
EURAUD Signal : H2 / H4 : Big Long !!!Hello Traders! 👋
What are your thoughts on EURAUD ?
This correction could offer a buy-the-dip opportunity, with potential for a move back toward the recent highs.
EURAUD H2 / H4
Market price : 1.7620
Buy limit : 1.7600 - 1.7550
Tp1 : 1.7700
Tp2 : 1.7820
Tp3 : 1.7940
Tp4 : 1.8150
Sl : 1.7
Yen Slips as New Fiscal Policies Emerge:GBPJPY Watching 203.900!Hey Traders,
In today’s session, we’re monitoring GBPJPY for a potential buying opportunity around the 203.900 zone. The pair remains in a broader bullish structure, and price is currently in a corrective phase, approaching a key trendline and support confluence near 203.900.
On the fundamental sid

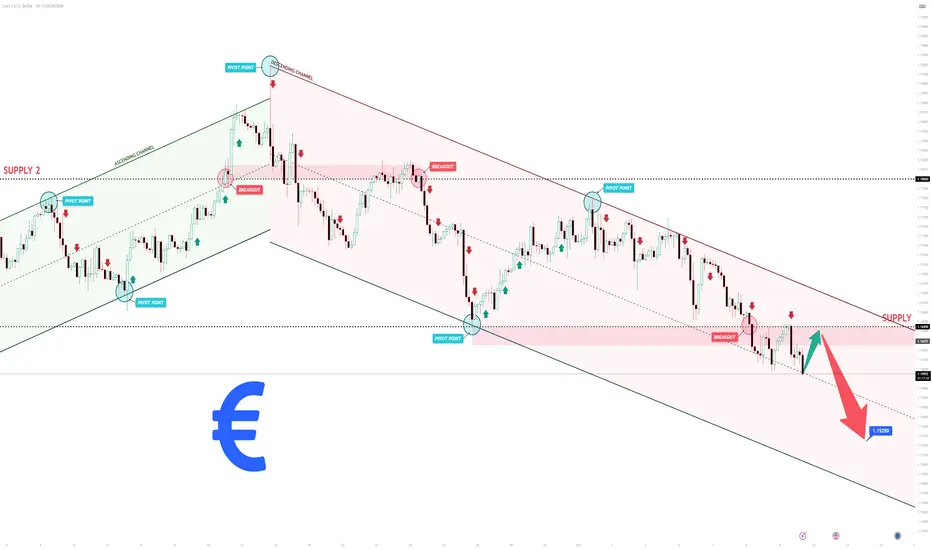
EURUSD Short: Trend Continuation to 1.1525 pointsHello, traders! The prior market structure for EURUSD has shifted to a bearish bias. This occurred after a failed breakout above the 1.1800 resistance level, which concluded a prior ascending channel. The subsequent reversal established the current descending channel, which has been guiding the pric
USDJPY 30Min Engaged ( Bullish & Bearish Entry Detected )➕ Bearish Reversal " 153.700
➕Bullih Reversal : 152.500 : 152.600 Zone
🩸 Volume Surge Confirmed — Institutional buyers active
🩸 Session Aligned — Timing matches liquidity expansion window
🩸 Cluster Shield Formed — Demand imbalance verified
🩸 Delta Shift Positive — Accumulation phase confirme

GBPUSD: Likely to ReversePrice had been trending higher, but momentum started to slow dwn. Buyers attempted to push higher twice, but both times met strong rejection at almost the same level, forming a Double Top pattern, a classic sign of potential trend exhaustion.
Now, all eyes are on the neckline.
A clean break and clo

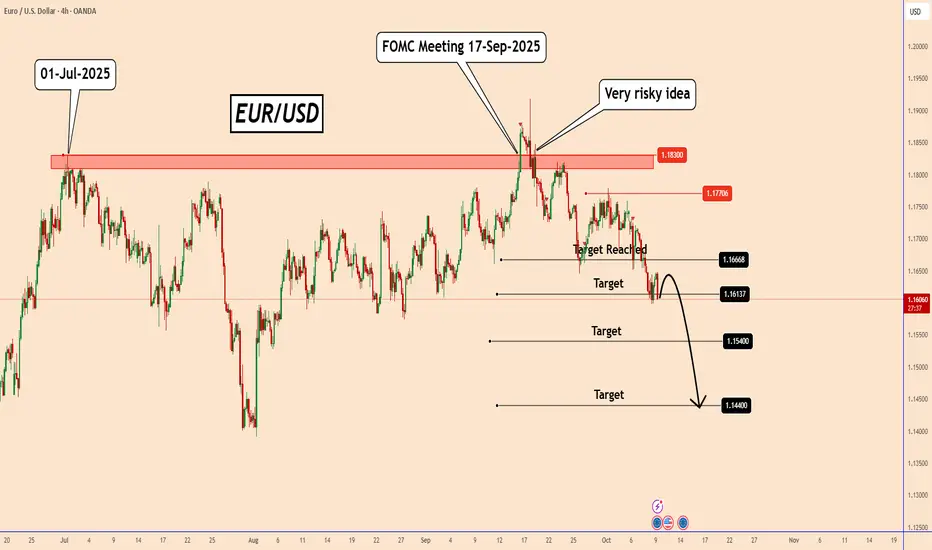
EURUSD: Remains Bearish Despite FOMC MinutesEURUSD: Remains Bearish Despite FOMC Minutes
From our previous analysis, EURUSD achieved two of our targets.
EURUSD remains bearish. Price tested 1.1650 after the FOMC minutes yesterday, but as we can see, the USD is holding up well despite the US Government shutdown.
The fact that the FOMC is c
EUR/USD time frame 4HEURUSD is at the bottom of the descending channel on the 4H timeframe, which is likely to form a reversal pivot given the existing 4H support and trading node and divergence is also evident in the MACD indicator, and buyers will enter the trade with long positions, and the price will grow to the cha

EURUSD longs potential 7RR+Very simple analysis, we are in a bull market/trend, we simply identify premium and discount using the fib tool, we pick a good area with liquidity to be taken, we wait for it to be taken, then when it starts showing signs of going up, we hop on and ride the trend

Lingrid | GBPUSD Support Breakdown Short OpportunityFX:GBPUSD is moving within a sustained downtrend after rejecting the 1.3667 resistance zone and forming a series of lower highs. Price action confirms a descending triangle breakout and equal lows, with momentum now focused on the 1.3200 support target. As long as the downward trendline caps recove

#EURUSD: DXY To Bounce Back Stronger, Stay Tuned! | Setupsfx_ |Dear Traders,
If you look at the current price behaviour and volume in the weekly timeframe, we can see the EURUSD price reversing and the USD bouncing back sharply. However, we need fundamental support for this idea to succeed. Please remember that this is just an overview and does not guarantee a

See all forex ideas
| - | - | - | - | - | - | - | ||
| - | - | - | - | - | - | - | ||
| - | - | - | - | - | - | - | ||
| - | - | - | - | - | - | - | ||
| - | - | - | - | - | - | - | ||
| - | - | - | - | - | - | - | ||
| - | - | - | - | - | - | - | ||
| - | - | - | - | - | - | - |
Trade directly on the supercharts through our supported, fully-verified and user-reviewed brokers.


