Microsoft: a major technical support at $350–$400Should Microsoft stock once again be considered in a DCA zone, after having corrected on the stock market since last November and now being the most expensive (in valuation terms) among the Magnificent 7 stocks?
This is the question I will address in this new analysis on TradingView. Feel free to f

The best trades require research, then commitment.
Get started for free$0 forever, no credit card needed

Scott "Kidd" PoteetPolaris Dawn astronaut

Where the world does markets
Join 100 million traders and investors taking the future into their own hands.

Job Growth Takes Off but Traders Stay Put. What’s Happening?Are these jobs in the room with us right now?
📊 A Blockbuster Headline
The delayed January jobs report arrived Wednesday. Nonfarm payrolls ECONOMICS:USNFP showed 130,000 new hires , more than double the 55,000 estimate. On paper, that looked like a strong start to the year.
Wall Street’s re

$TAO Sitting on a Level That Has Never FailedGETTEX:TAO is sitting on a major long-term support level and this isn’t the first time.
If we look at the last three times we touched this support, we bounced strongly.
We may see some drop to form a wick below the support, just as we’ve seen in the last three instances. However, in each case, we

BTC: The "Invisible Wall" at $70k (Why We Flush to $59.8k)The retail narrative is that Bitcoin is "consolidating" at $70k. The On-Chain data says Bitcoin is DISTRIBUTING . We just hit an "Invisible Sell Wall" driven by three massive structural failures. This is not a dip to buy; it is a Rational Deleveraging triggered by a $6.3B supply shock that the ma

Silver Under Pressure – Sellers Are in ControlXAGUSD is currently clearly leaning toward a short-term BEARISH trend, as both recent news and the technical structure fail to support a sustainable bullish move.
From a news perspective , silver is facing pressure from profit-taking after the previous strong rebound , while the U.S. dollar and

S&P 500: Late-Cycle Signals Are BuildingThe S&P 500 is still holding near highs, but under the surface, things are starting to weaken. Both the chart and the economy are sending warning signs that are easy to miss if you only look at price.
Weekly Bearish Divergence
On the weekly chart, price made higher highs, but momentum did not .

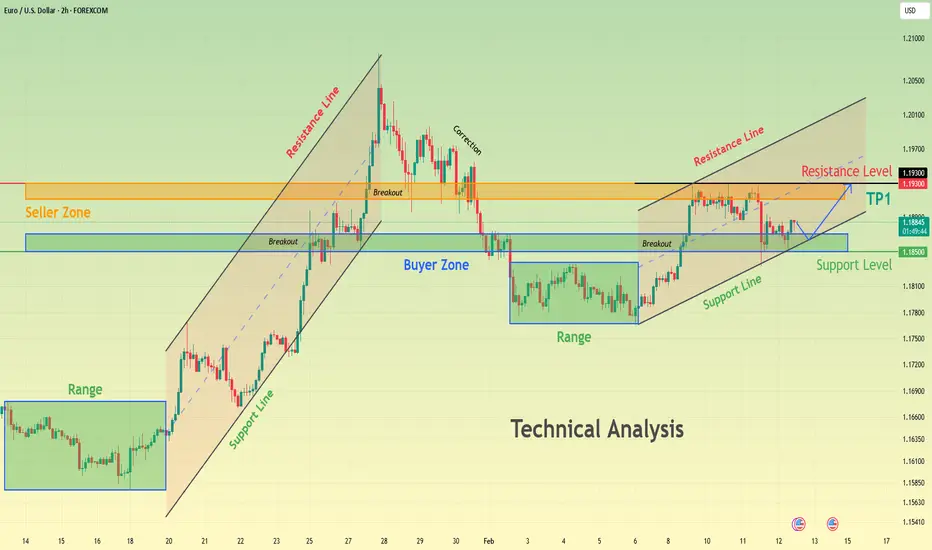
EURUSD Buyers in Control After Corrective Move, Eyes on 1.1930Hello traders! Here’s my technical outlook on EURUSD (1H) based on the current chart structure. EURUSD previously traded within a strong bullish environment, supported by a well-defined rising trend line. During this phase, price consistently formed higher highs and higher lows, confirming sustained

Paypal Bottom is in ?! Long from herePayPal Holdings (PYPL) is currently trading at approximately $40.42 (as of the latest close, +1.30% on the session), marking a continuation of the multi-year downtrend from its 2021 peak of ~$310–$340.
The chart applies a Fibonacci retracement drawn from the 2021 high (~$310.16) to the post-peak lo

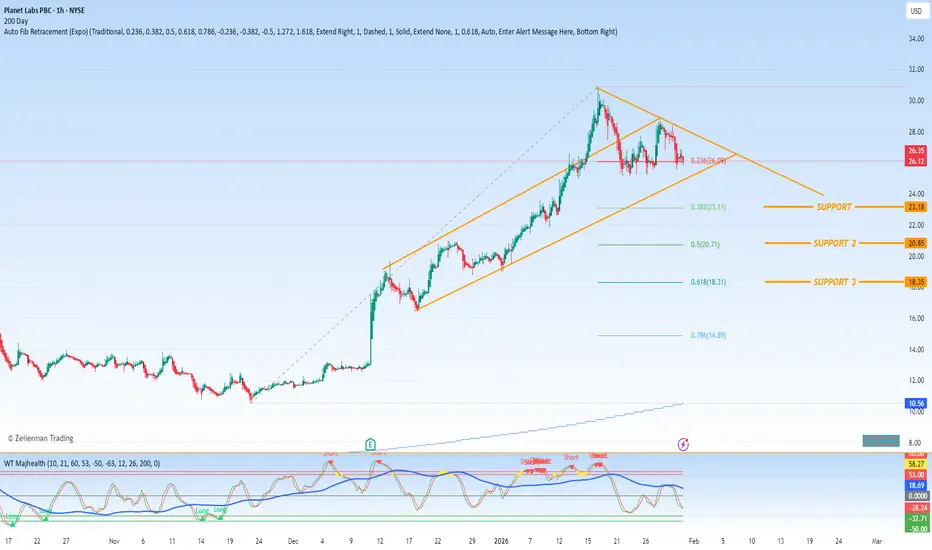
$PL - RACE TO SPACE!This reported merger proposal between SpaceX and xAI, along with the broader industry moves toward orbital AI data centers, represents a bold and high-stakes strategic gambit in the escalating global AI infrastructure race. Here’s a structured analysis of the implications, motivations, and challenge
Bitcoin Back Above $70,000. Here Are Key Levels to Watch NowA trip to $60,000 and back before coffee.
Bitcoin BITSTAMP:BTCUSD spent the end of last week doing what it does best: reminding traders that fire-breathing dragons aren’t in fairytales only.
After a sharp drop to $60,033 on Thursday torched thousands of long positions, the world’s largest crypt

See all editors' picks ideas
Peak Trading Activity Graphs [LuxAlgo]The Peak Trading Activity Graphs displays four graphs that allow traders to see at a glance the times of the highest and lowest volume and volatility for any month, day of the month, day of the week, or hour of the day. By default, it plots the median values of the selected data for each period. T
Pine Script® indicator

Smart Trader, Episode 03, by Ata Sabanci, Candles and TradelinesA volume-based multi-block analysis system designed for educational purposes. This indicator helps traders understand their current market situation through aggregated block analysis, volumetric calculations, trend detection, and an AI-style narrative engine.
━━━━━━━━━━━━━━━━━━━━━━━━━━━━━━━━━━━━━━━
Pine Script® indicator

Asset Drift ModelThis Asset Drift Model is a statistical tool designed to detect whether an asset exhibits a systematic directional tendency in its historical returns. Unlike traditional momentum indicators that react to price movements, this indicator performs a formal hypothesis test to determine if the observed d
Pine Script® indicator

Hyperfork Matrix🔱 Hyperfork Matrix 🔱 A manual Andrews Pitchfork tool with action/reaction propagation lines and lattice matrix functionality. This indicator extends Dr. Alan Andrews' and Patrick Mikula's median line methodology by automating the projection of reaction and action lines at equidistant intervals, cr
Pine Script® indicator

Arbitrage Matrix [LuxAlgo]The Arbitrage Matrix is a follow-up to our Arbitrage Detector that compares the spreads in price and volume between all the major crypto exchanges and forex brokers for any given asset.
It provides traders with a comprehensive view of the entire marketplace, revealing hidden relationships among d
Pine Script® indicator

Wyckoff Schematic by Kingshuk GhoshThe "Wyckoff Schematic" is a Pine Script indicator that automatically detects and visualizes Wyckoff Method accumulation and distribution patterns in real-time. This professional tool helps traders identify smart money movements, phase transitions, and critical market structure points.
Key Features
Pine Script® indicator

Volume Cluster Profile [VCP] (Zeiierman)█ Overview
Volume Cluster Profile (Zeiierman) is a volume profile tool that builds cluster-enhanced volume-by-price maps for both the current market window and prior swing segments.
Instead of treating the profile as a raw histogram only, VCP detects the dominant volume peaks (clusters) insid
Pine Script® indicator

DeeptestDeeptest: Quantitative Backtesting Library for Pine Script
━━━━━━━━━━━━━━━━━━━━━━━━━━━━━━━━━━
█ OVERVIEW
Deeptest is a Pine Script library that provides quantitative analysis tools for strategy backtesting. It calculates over 100 statistical metrics including risk-adjusted return ratios (Sharpe
Pine Script® library

Arbitrage Detector [LuxAlgo]The Arbitrage Detector unveils hidden spreads in the crypto and forex markets. It compares the same asset on the main crypto exchanges and forex brokers and displays both prices and volumes on a dashboard, as well as the maximum spread detected on a histogram divided by four user-selected percenti
Pine Script® indicator

Multi-Distribution Volume Profile (Zeiierman)█ Overview
Multi-Distribution Volume Profile (Zeiierman) is a flexible, structure-first volume profile tool that lets you reshape how volume is distributed across price, from classic uniform profiles to advanced statistical curves like Gaussian, Lognormal, Student-t, and more.
Instead of forcin
Pine Script® indicator

See all indicators and strategies
Community trends
NVDA - Techs Fail and Insiders BailThis chart looks ugly for the bulls. That red trendline has been holding the price up for months, but now it is finally giving way. When a major support level like this cracks, it usually means the uptrend is over and we are heading lower.
But the real red flag is what the leadership is doing.
Ins

AAPL Daily Chart Analysis – Bullish Continuation Setup | Target Strong Support Zone: $243 – $258 area
Price previously bounced from this level, confirming it as a major demand zone.
• Resistance Level: $289
This is the next major resistance marked on the chart. A breakout above this level could open the path toward $300+.
• Market Structure:
After a correction

Coinbase triple-bottom, complete correction & bullish impulseThis signal is so strong that I will not have to go too much about it. It is just too simple and so hard to miss—easy to see.
When in doubt, look around. Coinbase moves together with Bitcoin and Cryptocurrency as a whole.
When the Cryptocurrency market is bullish and set to grow, Coinbase (COIN) i

CRWV CoreWeave StockThe Chart reads as Ai will always be the future to come, it is a tool.
A tool is either used or not and often mastered. Cloud storage is the future as well.
The chart shows where the algo is leaving $ behind once HHighs are made and held we will see NEW ATH. NFA.... But one thing is for sure laws

COINBASE $150 Target hit. Bear Cycle now enters Phase 2 to $55.More than 2 months ago (December 04 2025, see chart below), we gave a massive Sell Signal on Coinbase (COIN) as it was testing for several weeks its 1W MA50 (blue trend-line) without breaking above it:
Last week's dramatic sell-off finally hit our $150 mid-term Target and this week despite its

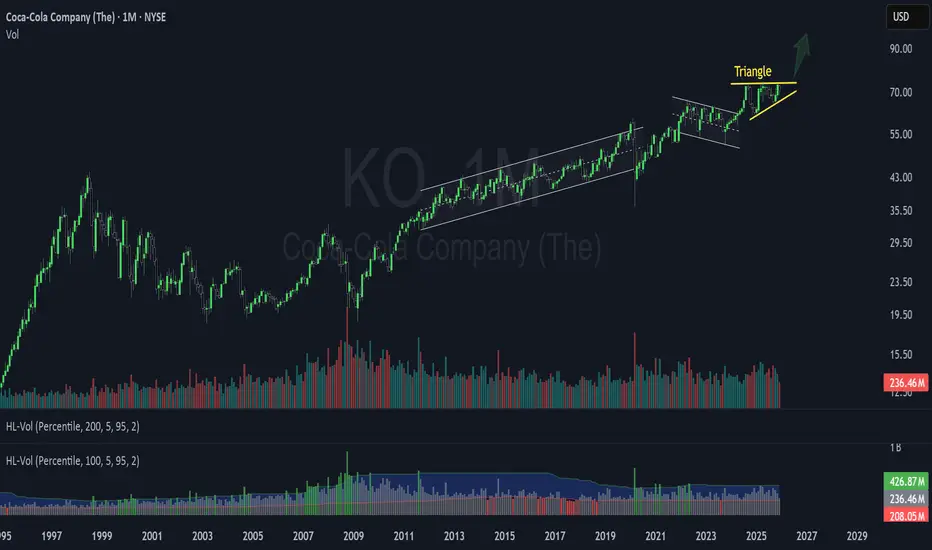
Coca-Cola, Prepared for a Magnificent 2026Coca-Cola, Prepared for a Magnificent 2026
Hello traders,
I want to invite you to look closely at the chart I have shared with you today. It is not often we see such a clear story being written by the market, but when we do, it is our responsibility to pay attention.
We are looking at NYSE:KO
RECAP - Rivian's Inflection Point: R2 Hype, Earnings BeatRivian's Inflection Point: R2 Hype, Earnings Beat, and the Battle for Tesla's Crown
Rivian Automotive Inc. delivered a emphatic response to skeptics this week, as shares surged more than 26% on Friday following a fourth-quarter earnings report that, while mixed, successfully refocused investor atten

TSLA - Not looking greatTSLA idea: trend break + bear flag under MAs (sell-the-rip until proven otherwise)
Tesla lost the major uptrend line and keeps getting rejected under the moving averages — that’s not “dip buy” behavior, that’s overhead supply.
Key map
Pivot / chop shelf: ~420
Line in the sand: 410.9 (LOD)
Downs

$Playboy Looks bottomed on HTF unless we aren't....
Risking 5%
interesting to see what is about to come if #Playboy will be doing better :)

750% Upside Potential! Only Green From HereFrom a technical standpoint:
The stock has retraced nearly the entire 2020–2021 move. Price is testing deep Fibonacci retracement levels (~0.886). Prior consolidation in the $45 - $50 zone now acts as resistance.
Sentiment is extremely bearish — which historically aligns with long-term opportunity

See all stocks ideas
Tomorrow
BEPCBrookfield Renewable Corporation
Actual
—
Estimate
−0.30
USD
Tomorrow
CVMCel-Sci Corporation
Actual
—
Estimate
—
Tomorrow
LITSLite Strategy, Inc.
Actual
—
Estimate
—
Tomorrow
BBGIBeasley Broadcast Group, Inc.
Actual
—
Estimate
—
Tomorrow
USBCUSBC, Inc.
Actual
—
Estimate
−2.80
USD
Tomorrow
AMBQAmbiq Micro, Inc.
Actual
—
Estimate
−0.38
USD
Tomorrow
ULHUniversal Logistics Holdings, Inc.
Actual
—
Estimate
−0.05
USD
Tomorrow
OGENOragenics Inc.
Actual
—
Estimate
—
See more events
Community trends
Bitcoin 10X Long with 689% profits potentialIt's been several days since Bitcoin hit bottom, six days now.
The drop that started 14-January 2026 was composed of strong bearish momentum; it was lower, followed by lower and then more lower. The longest stop was one or two days, never more than that. There was nothing weak about the drop.
Bitc

Bitcoin Rejects Resistance, Eyes Support Test Around $65KHello traders! Here’s my technical outlook on BTCUSDT (1H) based on the current chart structure. Bitcoin previously traded within a well-defined descending channel, where price respected both the resistance and support boundaries, confirming controlled bearish pressure rather than impulsive selling.

Bitcoin: Is the WXYXZ Correction Setting Up Wave C?Bitcoin: Is the WXYXZ Correction Setting Up Wave C?
During the last 5 days BTC declined by nearly 5% from 72250 to 65170
Looks like the B wave has more a corrective movement and is expanding as WXYXZ pattern. If the price manages to move above the previous X near 68300 it will add the chances t

Bitcoin flashing traditional accumulation signals (alt season?)TL:DR
Bitcoin is finding a bottom but probably still has some downside. Strong hand are probably accumulating Bitcoin and especially alts.
Introduction
Bitcoin is flashing multiple accumulation signals. But this downtrend has been so gradual and lacking in volatility it barely feels like a bea
BITCOIN - Correction against the global bearish trend BINANCE:BTCUSDT.P is recovering from an interim low of 65K. The area of interest is 71,500, but it is too early to talk about a bull market, as the influence of buyers may be short-term within the global downtrend.
The main growth factor that emerged on Thursday/Friday was cooling inflation in

DOGE – At Weekly Support… But Not Bullish YetDOGE is currently approaching a major weekly support zone $0.08 – $0.05 .
This area has previously acted as a strong demand zone, so it’s definitely a level to watch. However, structure still matters.
Price remains bearish, trading inside the falling red channel with clear lower highs and lower lo

$BTC.dchecking this to see if bitty is going to range now and let this bleed
sooner or later this shall give way loosing the lower range is when we accelerate
reclaiming 59.38 i'd be cautious on alts
hopium is alive :)

$BTC Post-Drop Consolidation in ProgressCRYPTOCAP:BTC 3D timeframe
After that sharp flush toward $60K, price is doing exactly what we talked about bouncing and moving between nearby support and resistance instead of continuing straight down.
That $60K area looks like it’s acting as a local low for now.
Not saying it’s the bottom… but i

BULLISH SCENARIO - BITCOINHello traders ,
The Bitcoin price is currently trading within a descending channel structure.
Let’s consider the bullish scenario :
If the market breaks and closes above the resistance trendline, this would signal a potential shift in momentum and open the door for a bullish move.
🎯 Target:

BTCUSD Breakout from Downtrend, Eyeing FVG Refill & 70K Target
This 1H **BTCUSD** chart shows price breaking out of a descending trendline after a prolonged consolidation range. Following the breakout, price has pushed higher and is now pulling back into a marked **FVG (Fair Value Gap)** area, which aligns with the Ichimoku cloud acting as dynamic support. As

See all crypto ideas
Elise | XAUUSD – 30M – Demand Rejection with Bullish RecoveryOANDA:XAUUSD
After consolidating near 5,040 supply, gold delivered an aggressive sell-off into higher timeframe demand. The immediate rejection confirms institutional buying interest. Current structure suggests a potential continuation toward internal resistance before testing higher supply near 5

GOLD - Consolidation ahead of the news? Will the trend continue?FX:XAUUSD is attempting to recover to $5,000 after a sharp 3.5% drop on Thursday. There are no clear reasons for this. All market attention is focused on today's US inflation report - CPI.
Yesterday's gold sell-off was caused not only by technical factors, but also by capital flight to the dol

#XAUUSD(GOLD): +7350 Pips Swing Buy From A Safe Zone! Dear traders,
I hope you’re doing well.
Gold, after consolidating for a week or two, finally dropped significantly, indicating a strong bearish presence in the market. Currently, the bulls are still struggling to push the price higher. A possible scenario is to wait for the price to drop further

Gold Short Trigger — PRZ Rejection or One More Push?This Gold( OANDA:XAUUSD ) idea is focused on the 15-minute timeframe and is in line with the previous 1-hour idea I shared, where the first target was reached.
Now, let’s see if on the 15-minute chart we can spot a short trigger for gold—stay with me!
Gold appears to be moving within an ascendi

Gold next move (selling continued)(13-02-2026)Plz Go through the analysis carefully and do trade accordingly.
Anup 'BIAS for the day (13-02-2026)
Current price- 4970
"if Price stays below 5040 then next target is 4920, 4860, 4760 and 4580 and above that 5170 and 5270".
-POSSIBILITY-1
Wait (as geopolitical situation are worsening )
-POSSIBI

XAUUSD Long: Rebounds From Support - Buyers Target 5,100Hello traders! Here’s my technical outlook on XAUUSD (2H) based on the current chart structure. Gold was previously trading inside a well-defined ascending channel, where price respected both the rising support and resistance boundaries, forming a steady sequence of higher highs and higher lows. Thi

Gold 30Min Engaged ( Bearish & Bullish Entry Detected )⚡Base : Hanzo Trading Alpha Algorithm
The algorithm calculates volatility displacement vs liquidity recovery, identifying where probability meets imbalance.
It trades only where precision, volume, and manipulation intersect —only logic.
✈️ Technical Reasons
/ Direction — LONG / Reversal 4908 Area

XAUUSD Stop Hunt Completed – Liquidity Sweep Before Major Move? The recent XAUUSD price action suggests a classic stop hunt and liquidity sweep scenario. Price briefly broke below a key support zone, triggering sell-side liquidity and stop-loss orders from retail traders, before sharply reversing back into the previous range.
This move appears less like a true

GOLD DAILY CHART ROUTE MAPHey Everyone,
Please see our Daily chart idea, which had a strong candle body close above the 5030 axis level on Monday opening the long-range upside target at 5198.
On Tuesday, we saw a small corrective move back to test the EMA5, which acted as dynamic support. The bounce from EMA5 aligned perfe

Selena | XAUUSD · 30M – Bullish Structure Inside Rising ChannelFOREXCOM:XAUUSD PEPPERSTONE:XAUUSD
After the aggressive sell-side sweep, buyers regained control and pushed price back into a structured bullish channel. The current strong consolidation under 5,100 suggests accumulation before a potential expansion move. As long as price holds above the intern

See all futures ideas
EURUSD is Nearing a Decent Support!Hey Traders, in today's trading session we are monitoring EURUSD for a buying opportunity around 1.18200 zone, EURUSD is trading in an uptrend and currently is in a correction phase in which it is approaching the trend a 1.18200 support and resistance area.
Trade safe, Joe.

EUR/USD - Triangle Breakout | Sellers in Control📊 Technical Overview TICKMILL:EURUSD
EUR/USD formed a clear symmetrical triangle pattern on the M30 timeframe, showing consolidation after a strong impulsive move.
✅Price rejected precisely from a higher-timeframe bearish order block, confirming strong supply in that zone.
✅The recent break be

USDJPY 30Min Engaged ( Bearish & Bullish Entry Detected )⚡Base : Hanzo Trading Alpha Algorithm
The algorithm calculates volatility displacement vs liquidity recovery, identifying where probability meets imbalance.
It trades only where precision, volume, and manipulation intersect —only logic.
✈️ Technical Reasons
/ Direction — LONG / Reversal 152.515 Ar

EURUSD - Will it break the resistance?EURUSD is currently trading within a well-defined 4-hour structure, where both support and resistance are clearly mapped by fair value gaps. After a strong recovery from the lows, price has entered a consolidation phase just below a key resistance zone. The market is now reacting precisely to higher

EUR/USD at Key Zone – Support Test Incoming! (13.02.2026)📊 Description✅ Setup OANDA:EURUSD
EUR/USD is reacting from a higher-timeframe resistance zone after a strong bullish move.
Price is now respecting a rising trendline support, showing a slowing momentum and possible distribution.
We can see:
👉Multiple rejections from resistance
👉Trendline acti

GBPUSD - Trend Still IntactGBPUSD has been overall bullish, printing higher highs and higher lows inside the rising blue channel.
Now price is pulling back into a key intersection:
• The lower bound of the blue trendline
• The green support zone
As long as this confluence holds , we’ll be looking for trend-following long

Selena | EURUSD · 4H – Bullish Channel StructureFX:EURUSD
After sweeping liquidity near 1.1600, buyers reclaimed control and pushed price back into the upper half of the channel. Current compression beneath 1.1950–1.2000 resistance suggests accumulation before potential breakout. Structure remains bullish unless channel support fails.
Key Scen

EURUSD Compressing Above Demand - Next Move IncomingHello traders! Here’s my technical outlook on EURUSD (2H) based on the current chart structure. The pair is trading within a broader bullish environment, supported by a clearly defined rising support line that has guided price higher over time. Earlier in the move, EURUSD entered a consolidation pha

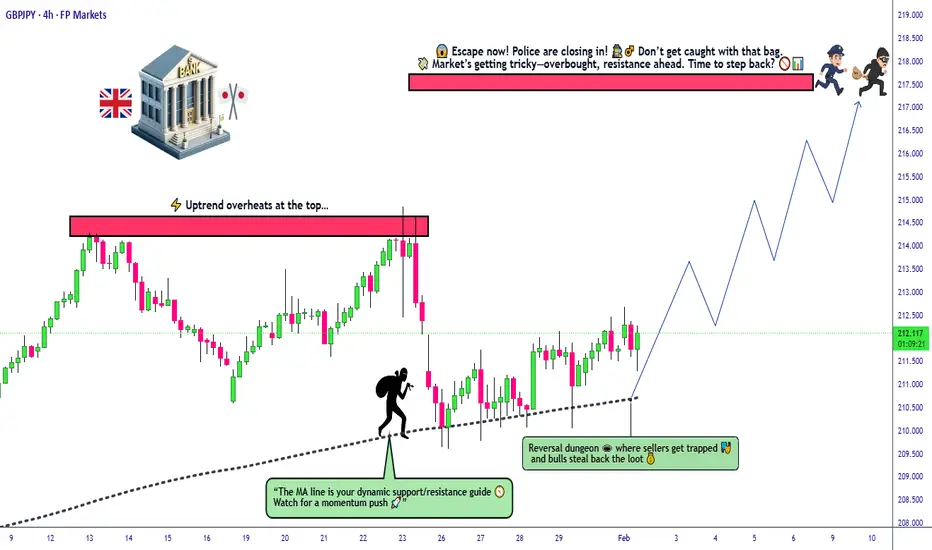
GBP/JPY Upside Scenario | Technical & Macro Alignment🐉 GBP/JPY "THE DRAGON" - BULLISH SWING/DAY TRADE SETUP | Thief Trader Strategy 🎯
📊 MARKET OVERVIEW
Asset: GBP/JPY (British Pound / Japanese Yen) - "The Dragon" 🐉
Market: Forex - Major Cross Pair
Trade Type: Swing / Day Trade Opportunity
Bias: BULLISH 🚀
Strategy: Thief Layering Method + Moving Avera
See all forex ideas
Trade directly on Supercharts through our supported, fully-verified, and user-reviewed brokers.


