Apple Shares (AAPL) Close to Reaching Record HighApple Shares (AAPL) Close to Reaching Record High
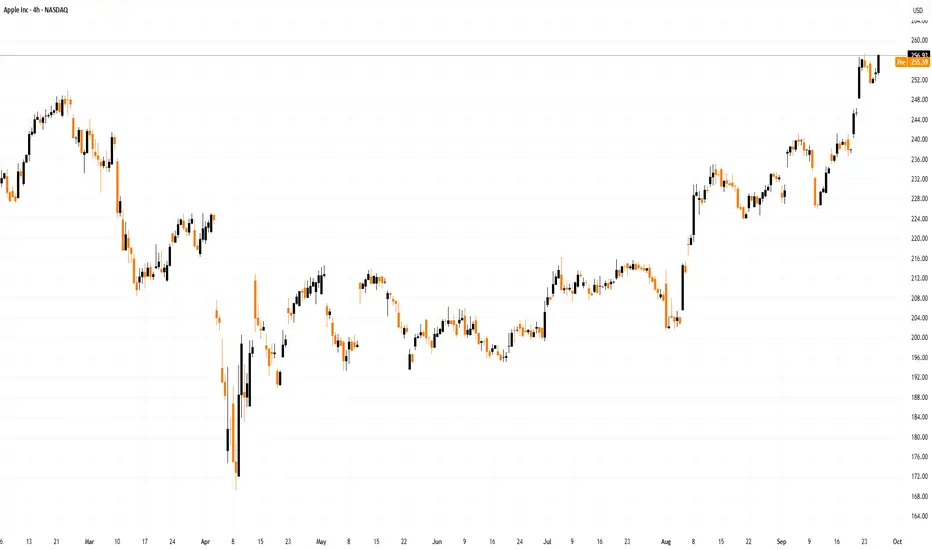
On 10 September, we noted that following the launch of new products — including the iPhone 17 — AAPL shares had fallen by approximately 1.5%, as analysts considered the model lacked the breakthrough appeal necessary to drive further growth.
Howeve

The best trades require research, then commitment.
Get started for free$0 forever, no credit card needed

Scott "Kidd" PoteetThe unlikely astronaut

Where the world does markets
Join 100 million traders and investors taking the future into their own hands.
Major indices
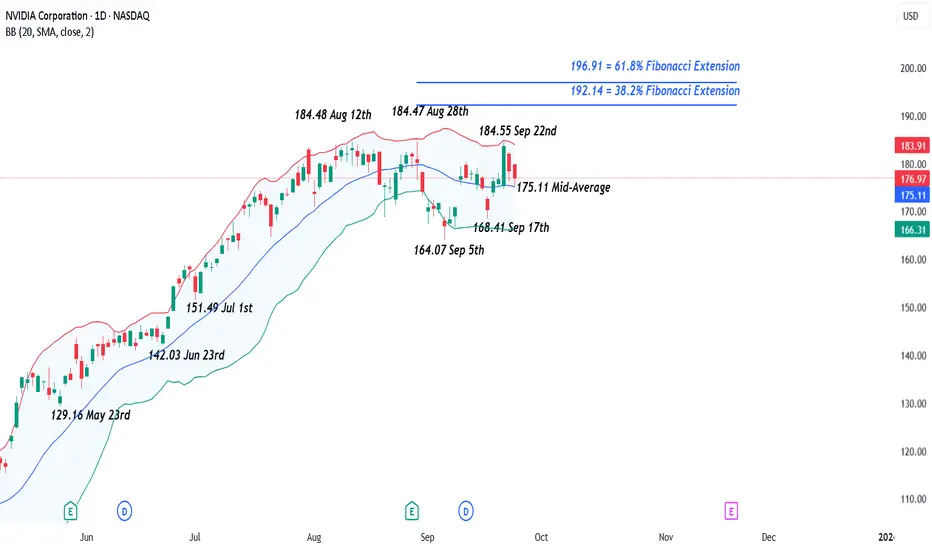
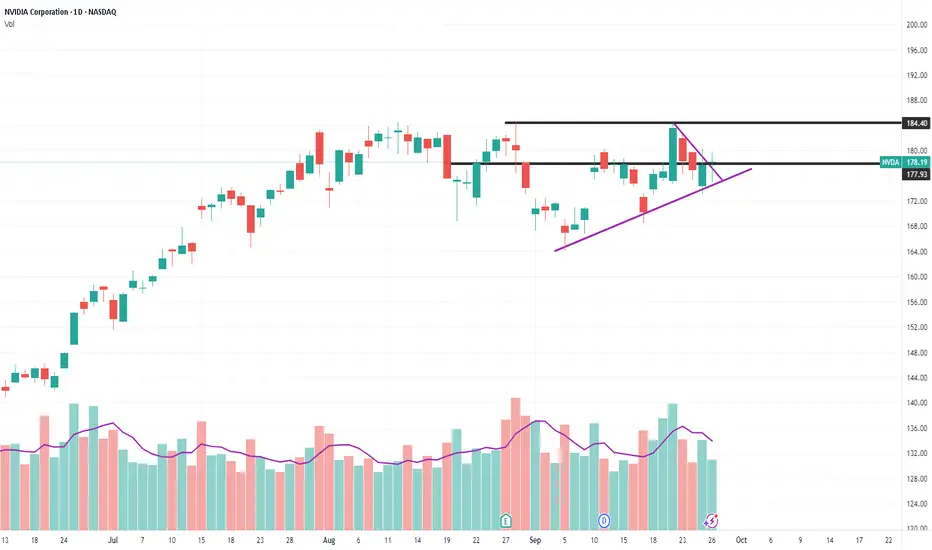
NVIDIA – Bumping Up Against Record HighsNVIDIA’s share price is experiencing an interesting run into the end of September as traders try and work out whether it can extend its run of gains through all time highs sitting just above the 184 level (184.55 Sept 22nd), a line in the sand that has capped the upside since the start of August (mo
Retro Editors' picks 2024Closing our retro EP selection , we present to you the last collection of additional scripts that have earned a spot in our Editors' picks, in this case from 2024.
These retrospective selections reflect our continued commitment to honoring outstanding contributions in our community, regardless of

The Bear Market Isn't Coming? Old BTC Playbook is a TrapFor years, traders have relied on Bitcoin's predictable cycles. We look for the same clues, the same topping signals, and the same patterns. But what if the market has evolved? What if the playbook we've all been studying is now a trap?
This analysis dives deep into key indicators across all three

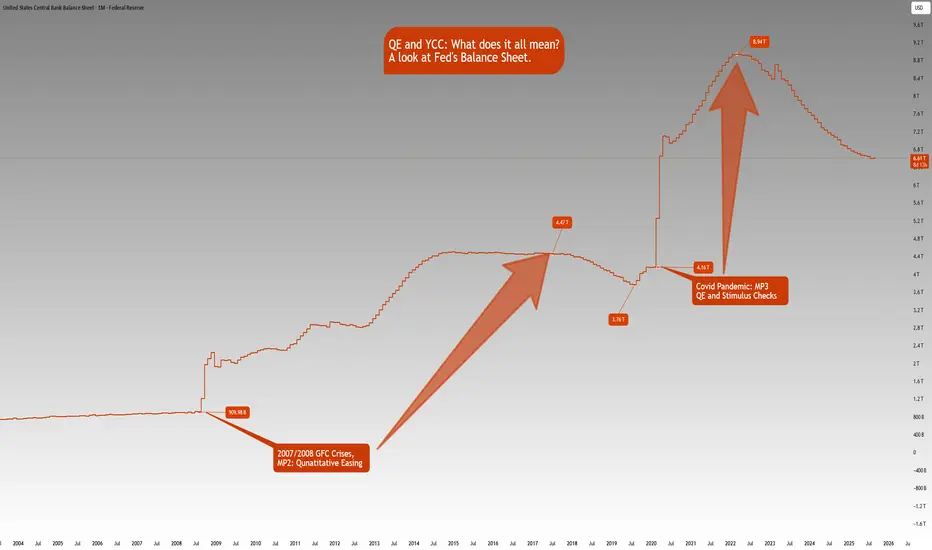
QE and YCC: What does it all mean?ECONOMICS:USCBBS
CBOT:ZB1! CBOT:ZN1! CME_MINI:NQ1!
There is growing market speculation that the Fed may tolerate inflation above 2% for longer, consistent with its Average Inflation Targeting (AIT) framework introduced in 2020.
This also implies that real rates i.e., nominal rates minus
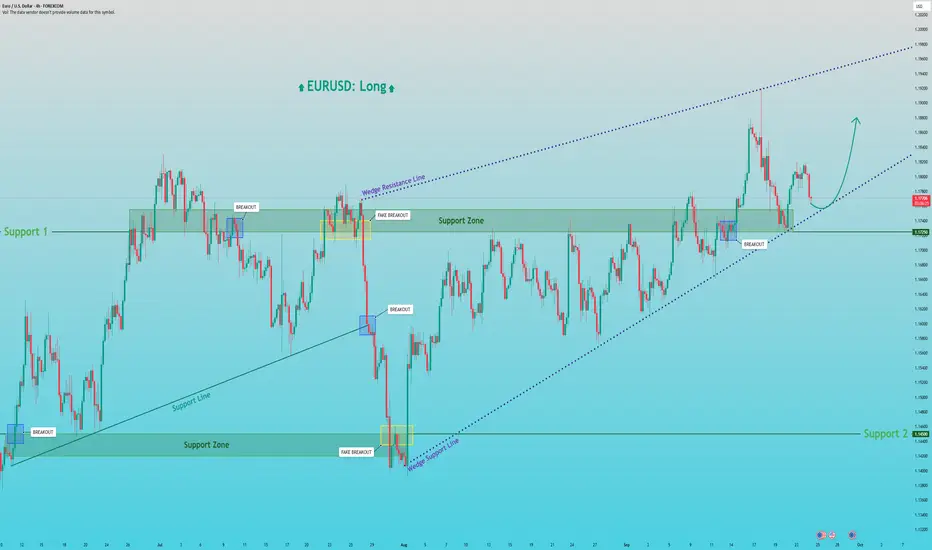
EURUSD: Rally from Wedge Support to 1.1880Hello everyone, here is my breakdown of the current Euro setup.
Market Analysis
A prior uptrend failed, leading to a sharp drop down to the major Support zone 2 around the 1.1450 level. However, strong buying pressure emerged from that low, initiating a powerful reversal and establishing the cu
BTC Breakdown: Watching 112.6K-113.5K for Rejection Toward 109kHello guys!
Trend Structure:
The price was moving in a clear ascending channel, but recently broke down below the lower boundary with strong bearish momentum. This confirms a structural shift from bullish to bearish sentiment.
Current Price Action:
After the breakdown, BTC attempted a relief rally

XAUUSD Long: Bullish Momentum to ContinueHello, traders! The price auction for XAUUSD has been in a strong bullish phase, confirmed by the establishment of a well-defined ascending channel. This uptrend was initiated after a breakout from lower levels and has shown significant strength by pushing through multiple prior resistance areas, in

Bear market has startedThe End of the Bull Cycle. Why I'm Selling Everything and Won't Buy Again Until September 2026.
For the last year and a half, I have said that we are in a bull market. I never once changed my opinion. But all things come to an end. The time has come.
September 13, 2025, the date I have been ment

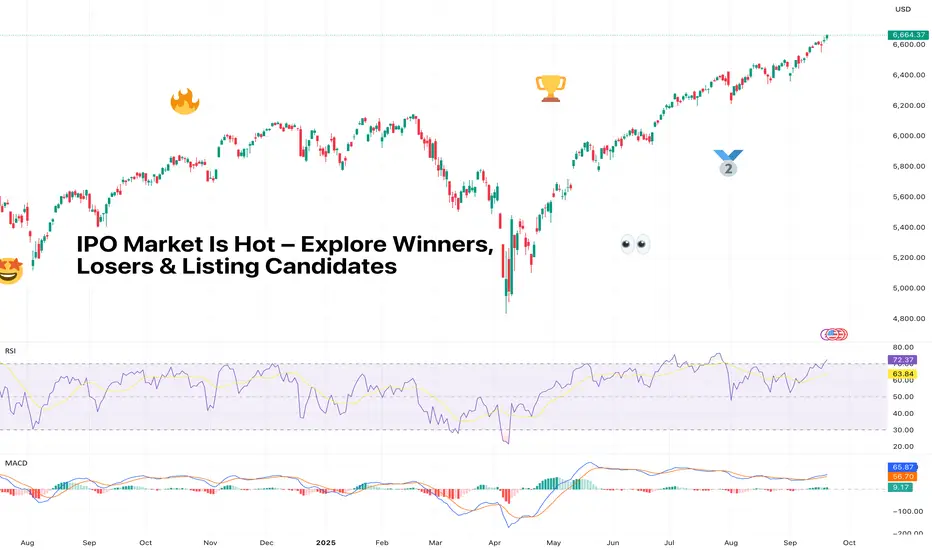
IPO Market Is Hot – Explore Winners, Losers & Listing CandidatesThe IPO market has woken up from its multi-year nap and is now in beast mode. But as always, Wall Street’s hottest party comes with an entrance fee and a dose of uncertainty – opaque prices, sketchy balance sheets, and a whole lot of FOMO.
So who’s winning, who’s losing, and who’s still waiting in
See all editors' picks ideas
RiskMetrics█ OVERVIEW
This library is a tool for Pine programmers that provides functions for calculating risk-adjusted performance metrics on periodic price returns. The calculations used by this library's functions closely mirror those the Broker Emulator uses to calculate strategy performance metrics (

Simple Decesion Matrix Classification Algorithm [SS]Hello everyone,
It has been a while since I posted an indicator, so thought I would share this project I did for fun.
This indicator is an attempt to develop a pseudo Random Forest classification decision matrix model for Pinescript.
This is not a full, robust Random Forest model by any stretch o

Tick CVD [Kioseff Trading]Hello!
This script "Tick CVD" employs live tick data to calculate CVD and volume delta! No tick chart required.
Features
Live price ticks are recorded
CVD calculated using live ticks
Delta calculated using live ticks
Tick-based HMA, WMA, EMA, or SMA for CVD and price
Key tick levels (S

analytics_tablesLibrary "analytics_tables"
📝 Description
This library provides the implementation of several performance-related statistics and metrics, presented in the form of tables.
The metrics shown in the afforementioned tables where developed during the past years of my in-depth analalysis of various str

Adaptive Trend Classification: Moving Averages [InvestorUnknown]Adaptive Trend Classification: Moving Averages
Overview
The Adaptive Trend Classification (ATC) Moving Averages indicator is a robust and adaptable investing tool designed to provide dynamic signals based on various types of moving averages and their lengths. This indicator incorporates multipl

Statistics • Chi Square • P-value • SignificanceThe Statistics • Chi Square • P-value • Significance publication aims to provide a tool for combining different conditions and checking whether the outcome is significant using the Chi-Square Test and P-value.
🔶 USAGE
The basic principle is to compare two or more groups and check the results

FiniteStateMachine🟩 OVERVIEW
A flexible framework for creating, testing and implementing a Finite State Machine (FSM) in your script. FSMs use rules to control how states change in response to events.
This is the first Finite State Machine library on TradingView and it's quite a different way to think about your

Trading Activity Index (Zeiierman)█ Overview
Trading Activity Index (Zeiierman) is a volume-based market activity meter that transforms dollar-volume into a smooth, normalized “activity index.”
It highlights when market participation is unusually low or high with a dynamic color gradient:
Light Blue → Low Activity (thin p

Expected Value Monte CarloI created this indicator after noticing that there was no Expected Value indicator here on TradingView.
The EVMC provides statistical Expected Value to what might happen in the future regarding the asset you are analyzing.
It uses 2 quantitative methods:
Historical Backtest to ground your anal

Bar Index & TimeLibrary to convert a bar index to a timestamp and vice versa.
Utilizes runtime memory to store the 𝚝𝚒𝚖𝚎 and 𝚝𝚒𝚖𝚎_𝚌𝚕𝚘𝚜𝚎 values of every bar on the chart (and optional future bars), with the ability of storing additional custom values for every chart bar.
█ PREFACE
This library aims to tackle s

See all indicators and strategies
Community trends
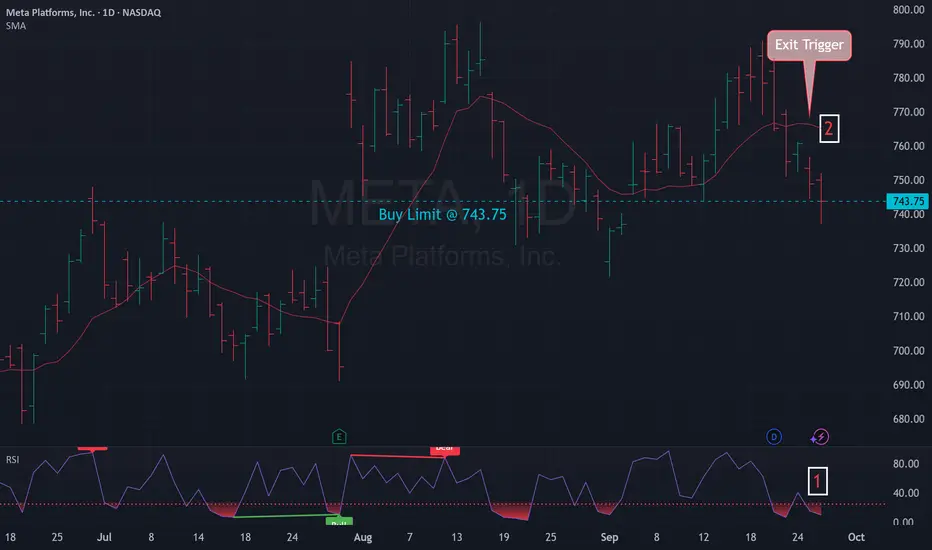
Mean Reversion Setup: META1. RSI in oversold region
2. Price likely to rebound back the the mean
Trade Rules:
Entry Trigger - RSI has cross below oversold region, enter limit buy at close price
Exit Trigger - Close at market when close price cross above exit trigger (Red Line)
Wolfspeed Inc Stock on Friday almost completed wave 2 in WXY flat regular correction.
It reached after trading hours about 1.16$ .
Days coming will trigger wave 3 ( Motive powerful wave ) that can take the price up to 9.60$ - 12.92$ zone ... open Zone., after a correction in wave 4 ,,,, wave 5 of W1 could ende

Carrier Global (CARR) – Neckline Zone at RiskOn the Weekly timeframe, price action is showing potential weakness:
A Double Top pattern is visible at the top, and the price is now testing the critical neckline zone.
The global trendline has been broken with stronger-than-usual volume. Importantly, price has reached this trendline faster

NVO-Still strugglingSadly we did not break through and got rejected from the Down trend resistance.
Next support levels,
$45 previous low
$37-35 next accumulation zone and 200 SMA monthly Time frame
Prepare to buy more if we goes down

NVDA: Potential Long Opportunity at Key Support LevelHello, fellow traders.
This analysis looks at a potential bullish setup on the 15-minute chart for NVIDIA (NVDA).
A key horizontal level has been identified around the $175.24 mark. As seen on the chart, this price has acted as a significant area of both support and resistance in recent trading sess

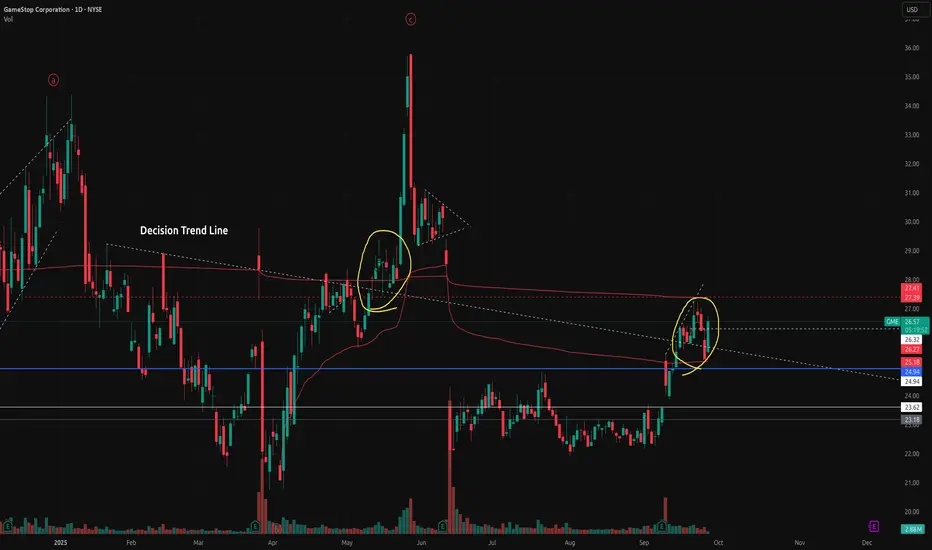
GME - Time for Giants again?GME is not a stock I have a clear wave-count on by any means, but elliot wave theory is not the only means by which I trade. I selectively look at volume/market structures to make decisions. And let me say, for ALL of 2025, this 'Decision Trend Line' has been the deciding factor between GME running
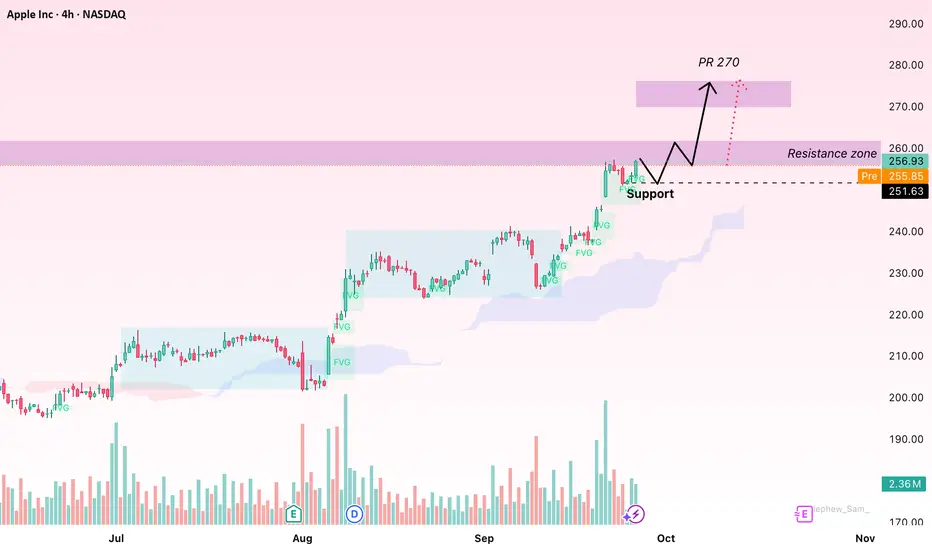
Apple Stock Supported by Earnings Strength and New ProductsApple Inc. (AAPL) is currently trading around $256.93, up 1.35% in the latest session. Following a strong rally, AAPL remains supported by both technical signals and macro factors. On the technical side, $257 is acting as a key resistance; a breakout above this level could open the way toward $260 a
Peloton (PTON): Can Bulls Ride Toward $17?Peloton (PTON): Can Bulls Ride Toward $17?
Peloton is showing signs of life after months of consolidation. With price action breaking above the $8.00 resistance and forming a bullish pattern.
The breakout above $8.00 confirms bullish intent. A sustained close above $8.00 could attract swing trade

TESLA WEEKLY STOCKSTESLA STOCK TO THE moon again ,if we get a pull back into 389-390 zone and stop loss will be 350$ then go long and target 540$ supply roof or more .
nice risk to reward.
#tesla #stocks #shares #bonds

NVDA Is Setup to Break New All-time Highs2025-09-26: NVDA Bullish Setup is Ready
1). Higher Lows Thursday ($173.13), Friday ($174.93). Will be perfect setup if next Monday close higher than $174.93.
2). Today vs Startup date Volume 23% Decrease 09-18: 191.76M vs 09-26 148.47M
3). Support Doji (Lower wig longer)
4). Close above all Moving
See all stocks ideas
Tomorrow
BSETBassett Furniture Industries, Incorporated
Actual
—
Estimate
0.09
USD
Tomorrow
BNEDBarnes & Noble Education, Inc
Actual
—
Estimate
—
Tomorrow
TAYDTaylor Devices, Inc.
Actual
—
Estimate
0.69
USD
Tomorrow
IXHLIncannex Healthcare Inc.
Actual
—
Estimate
−0.29
USD
Tomorrow
APOGApogee Enterprises, Inc.
Actual
—
Estimate
0.84
USD
Tomorrow
TAOPTaoping Inc.
Actual
—
Estimate
—
Tomorrow
GMGIGolden Matrix Group, Inc.
Actual
—
Estimate
−0.00
USD
Tomorrow
ANEBAnebulo Pharmaceuticals, Inc.
Actual
—
Estimate
−0.07
USD
See more events
Community trends
Bitcoin - Sacrificed by the banks! (100k, then 130k - buy here)Bitcoin and the whole crypto market have been dropping heavily these days. And I know why! You may wonder, why is Bitcoin in such a weak uptrend, and why do the majority of altcoins never grow, or after a small pump, a huge dump follows? Finally, I bring you the answer to this important question man

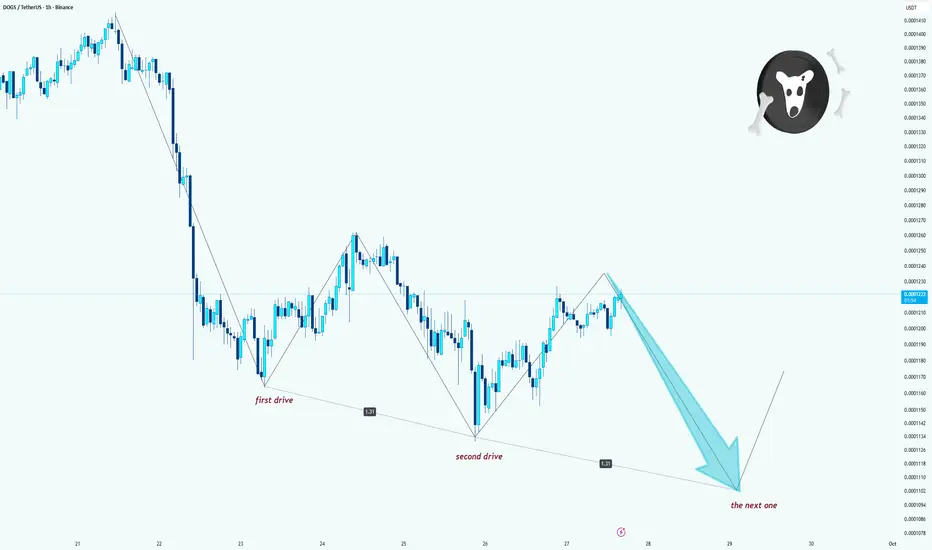
DOGS/USDT – Three Drives PatternHello guys!
The chart is shaping into a classic three-drives pattern.
We already saw the first drive and the second drive, complete with similar extensions.
Now, the market seems to be setting up for the third drive lower, which could push the price into the 0.000110 – 0.000115 area.
If this str
BTCUSDTHello Traders! 👋
What are your thoughts on BITCOIN?
Bitcoin is still moving inside an upward channel.
After its strong rally, the price has entered a corrective phase and is now positioned around the midline of the channel.
We expect the correction to extend toward the support zone and the lower

BTCUSD Short: Fading the Rally in a Bear ChannelHello, traders! The price auction for BTCUSD has been in a clear bearish phase since its rejection from the SUPPLY ZONE 2 near 115200. This has established a well-defined descending channel that has been guiding the price lower through a series of impulsive declines and corrective rallies, confirmin

Bitcoin - It is either $50.000 or $1.000.000!🪅Bitcoin ( CRYPTO:BTCUSD ) remains undecided:
🔎Analysis summary:
For the past couple of months, Bitcoin has been consolidating. With the two recent all time highs, we could see a similar pattern to what we saw back in 2021, followed by a bear market. But so far, Bitcoin remains bullish with t

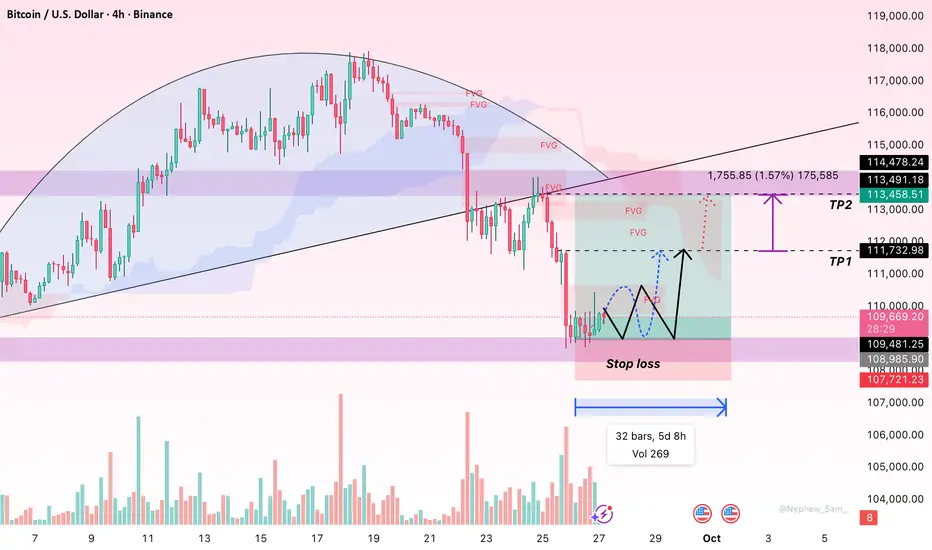
Bitcoin to Surge? Price Forecast and Key News You Can't Miss!Hello everyone, let's go through some important information regarding Bitcoin recently.
Technical Analysis:
The 109,000 USD support level is a key point as FVG zones have appeared, and there has been a clear recovery response. If Bitcoin holds above this level, there is potential for it to conti
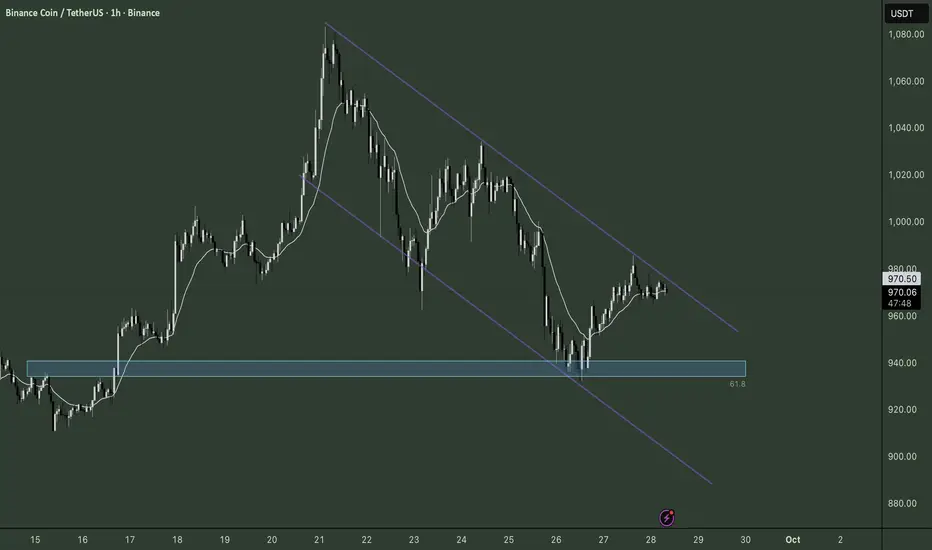
BNB – Loading Up Energy Inside the Wedge📊 Current Setup
BNB’s been surfin’ inside a falling wedge ⬇️, testing the waters 🌊. Last dip tagged the 61.8 fib zone (~$940) 🎯 and bounced, showing bulls 🐂 still flexin’. But right now the bullish push is runnin’ low on juice ⚡ — momentum looks weak, and lower TFs ⏱️ are flashin’ bearish reversal v
BTCUSD ShortAs you see in the chart, I see many reasons that we can see BTC to the level of 85,000$ by end of the year. So the reasons are:
Head&Shoulder pattern
Started the downtrend channel
The bold blue trendline is what the price is expected to touch.

ASTER/USDT Perspective Intra DayAster Bounce at 0.50 Fibb area, if it breakouts, then Intra Long
If doesn't Breakout, i will wait for it to Breakdown the 0.50fibb area to short. targeting the 0.6 Golden Fibb.
Who doesn't love Fibonacci right? :)

BTCUSDT Bullish or Bearish ?Bitcoin has been consolidating around this level for about three days, forming a potential converging triangle. We won’t predict the direction — if it breaks upward, we’ll go long; if it breaks downward, we’ll go short.
No prediction, just follow.

See all crypto ideas
Gold weekly setup for new athThis chart shows a 1-hour analysis of XAU/USD (Gold vs. US Dollar).
Price is currently around $3,759, slightly above the key support trend line.
Important support levels are marked near $3,755, $3,735, and $3,723, where buyers may step in.
The short-term bullish scenario points to a possible rebo

XAUUSD: Bullish Momentum Fueled by Latest PCE Data👋Hello traders! What do you think about the current trend of OANDA:XAUUSD ?
Gold continued its rise on Friday, surpassing the recent target of $3,750 , as the U.S. Dollar (USD) weakened following the latest Personal Consumption Expenditures (PCE) inflation report, which showed no surprises in in

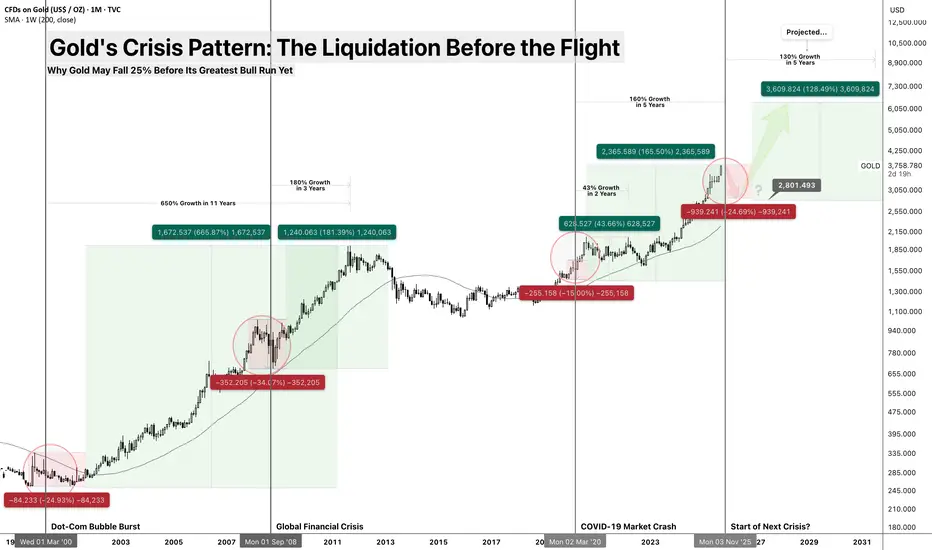
Gold's Crisis Pattern: The Liquidation Before the Flight TVC:GOLD Crisis Pattern: The Liquidation Before the Flight
Why Gold May Fall 25% Before Its Greatest Bull Run Yet
While everyone expects gold to rally during the next crisis, history suggests something different: gold gets sold first, bought later. At $3,790, FX:XAUUSD may be setting up fo
September 2025 Market Summary Gold and ForexProjectSyndicate Market Summary September 2025
📊 MTD performance
🟡 GOLD (XAUUSD): 3,759.65 | +286.65 (+8.31%)
💶 EURUSD: 1.1702 | +16 pips (+0.14%)
💷 GBPUSD: 1.3392 | −112 pips (−0.83%)
💴 USDJPY: 149.19 | +211 pips (+1.43%)
📈 SPX: 6,637.97 | +236.46 (+3.69%)
📈 NDX: 24,503.57 | +1,483.10 (+6.44

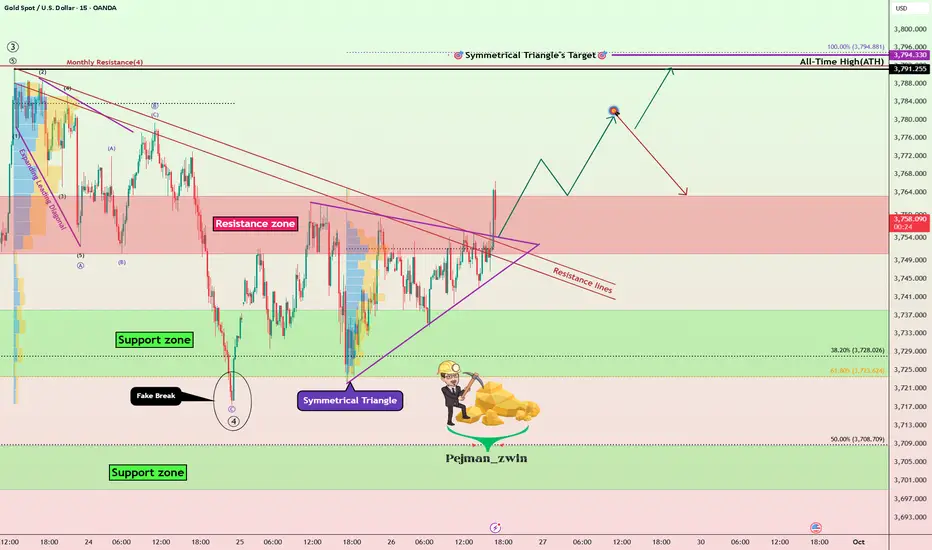
Gold Roadmap: Breakout Confirmed –New ATH or Another Correction?Gold ( OANDA:XAUUSD ) as I expected in the previous idea (Short and Long positions hit the target).
First of all, I should say that this analysis is for the short term and on a 15-minute time frame.
Gold seems to have managed to break the Resistance lines, Resistance zone($3,763-$3,750), and the
XTIUSD Weekly CLS range Manipulation - ShortXTIUSD shows clear manipulation candle on daily time frame closing within a CLS candle. Can short on pullback . Price likely will go down .

Gold can Resume its Uptrend After This CorrectionHello traders, I want share with you my opinion about Gold. The market context for Gold has been firmly bullish since the price action reversed from the deep 3335 - 3355 buyer zone, a move which established the current, well-defined upward channel. This bullish structure has since been guiding the p

'' Could We See 3800 This Week? ''As we can see we have an uptrend forming on gold, breaking 3750-3755 resistance level.
I think Monday will go on a retest for this support level and fly all the way up targeting (770-780-790-800)
This is just an idea for a trade, taking confirmation on lower time frame before entering it will be t

Day 39 — Trading Only S&P Futures | -$2,465 DrawdownDay 39 of Trading Only S&P Futures ends with a tough -$2,465 loss.
The morning started strong — I was green on my first three trades with bullish signals at the open. But by 10am, unexpected news about a government shutdown and rate cut doubts shook the market. I got shaken out, lost my morning gai

XAU/USD: Gold Pauses Ahead of Inflation ReportHello everyone, let’s take a look at gold (XAU/USD) price action during the 25th of September session!
Following a surprise drop in US jobless claims, gold has stalled around $3,740 per ounce while investors await the PCE inflation report – a key release that could shape the Fed’s next move on int

See all futures ideas
AUDNZD at Historical Levels - Layer ShortsAUDNZD at Historical Levels - Layer Shorts
Every once in a while, markets reach extreme levels that can be taken advantage of. This is one of those times.
📊 Technical Analysis:
AUD/NZD D1 RSI is currently trading at its highest daily levels ever. We have only seen this once before, in August 20

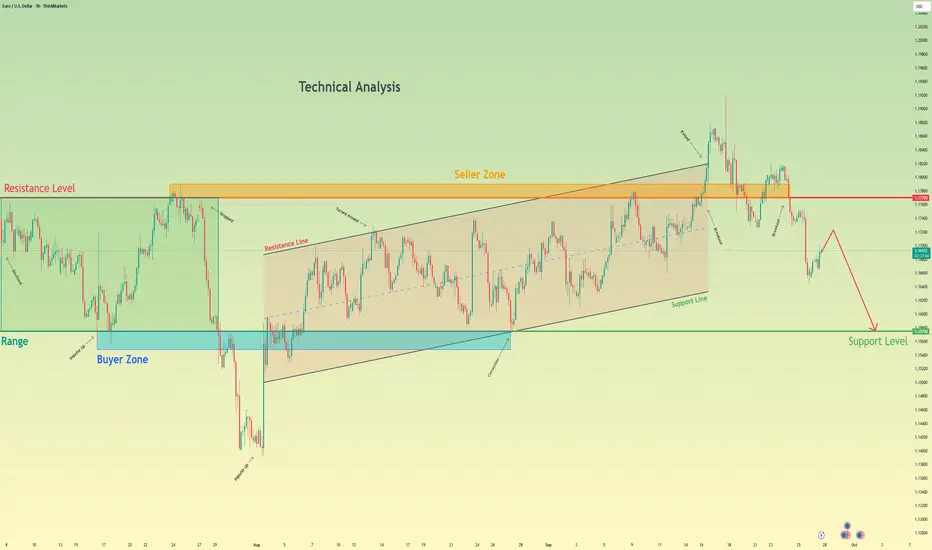
Euro will Fall Towards the 1.1575 Support LevelHello traders, I want share with you my opinion about Euro. The market for the Euro has recently shown a significant sign of weakness, with a failed breakout above the key 1.1770 Resistance Level. After a sustained rally within an upward channel, the price of EURUSD pushed into the 1.1770 - 1.1790 s
EURUSD SWING TRADE IDEAMarket Structure
I’ve been tracking the EUR/USD rally, but price is now pressing into the 1.17–1.18 zone, which is a major supply and resistance area where it has sold off hard before. This level also lines up with the 75 percent Fibonacci retracement at 1.176, which adds weight to the setup. Unles

USDJPY FREE SIGNAL FOR MONDAY|SHORT|
✅USDJPY Price forms a double-top and breaks neckline, signaling bearish order flow. ICT framework suggests liquidity draw into the 149.00 demand area.
—————————
Entry: 149.60
Stop Loss: 150.05
Take Profit: 149.00
Time Frame: 3H
—————————
SHORT🔥
✅Like and subscribe to never miss a new idea!✅

USD/JPY 1-Hour Candlestick Chart
Entry Point: ≈149.394
This is set just below the current price and near the lower boundary of the recent consolidation/support zone. The anticipation is that the price will dip slightly to this level before reversing up.
Stop Loss (SL): ≈149.068
The stop loss is placed below a recent swing low o

GBPUSD - Unexpected Reversal👋Hello everyone, what do you think about FX:GBPUSD ?
The GBP/USD pair ended Thursday's trading session with a decline of over 0.78%, seemingly preparing to test even lower levels due to the lack of economic data in the UK, which will likely draw traders into the momentum of the U.S. Dollar.
Loo

EUR/USD: Holding 1.16500 to Sustain the UptrendHello everyone,
The EUR/USD pair is currently trading around 1.16788, showing a slight rebound after a pullback from recent highs. Following a strong rally, the Euro is now testing a crucial zone, but the broader outlook remains supported by both technical and fundamental factors.
On the chart, t

GBPUSD Short/Sell SignalThoughts and Analysis: Sterling’s running out of gas, plain and simple. My chart analysis is screaming weakness due for a short and we’ve got a classic rejection at the 1.346–1.350 zone, the kind of level that turns dreamers into bag-holders. Price lost the short-term moving average and can’t recla

USDCAD*USDCAD*
Primary Setup (Bullish)
Entry: 1.3910 – 1.3930
Stop-Loss: 1.3860
Take-Profit Targets:
TP1: 1.4000
TP2: 1.4075
*Alternative Setup*
Entry: Sell below 1.3860
Stop-Loss: 1.3910
Take-Profit Targets:
TP1: 1.3800
TP2: 1.3740

USD/JPY: Important Bearish SignalFollowing a strong bullish rally, 📉USDJPY shows a brief period of consolidation on an hourly chart
Subsequent to the release of today's US economic data, the price experienced a decline, resulting in the formation of a high-momentum bearish candle.
The hourly candle closed below the range's suppo

See all forex ideas
| - | - | - | - | - | - | - | ||
| - | - | - | - | - | - | - | ||
| - | - | - | - | - | - | - | ||
| - | - | - | - | - | - | - | ||
| - | - | - | - | - | - | - | ||
| - | - | - | - | - | - | - | ||
| - | - | - | - | - | - | - | ||
| - | - | - | - | - | - | - |
Trade directly on the supercharts through our supported, fully-verified and user-reviewed brokers.


