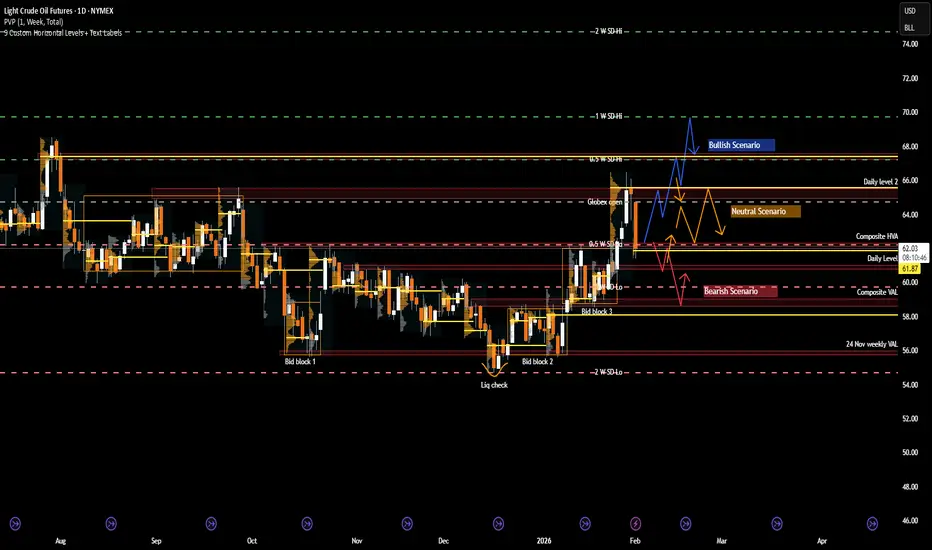
CL: Crude Oil at a Crossroads as Geopolitics Meet Key LevelsRecent Sentiment and Key Headlines Driving Crude
Crude oil sentiment over recent weeks has been shaped by a renewed mix of geopolitical risk and shifting expectations around global supply discipline. Headlines tied to Venezuela and Iran have been particularly influential, adding a layer of risk pr

The best trades require research, then commitment.
Get started for free$0 forever, no credit card needed

Scott "Kidd" PoteetPolaris Dawn astronaut

Where the world does markets
Join 100 million traders and investors taking the future into their own hands.
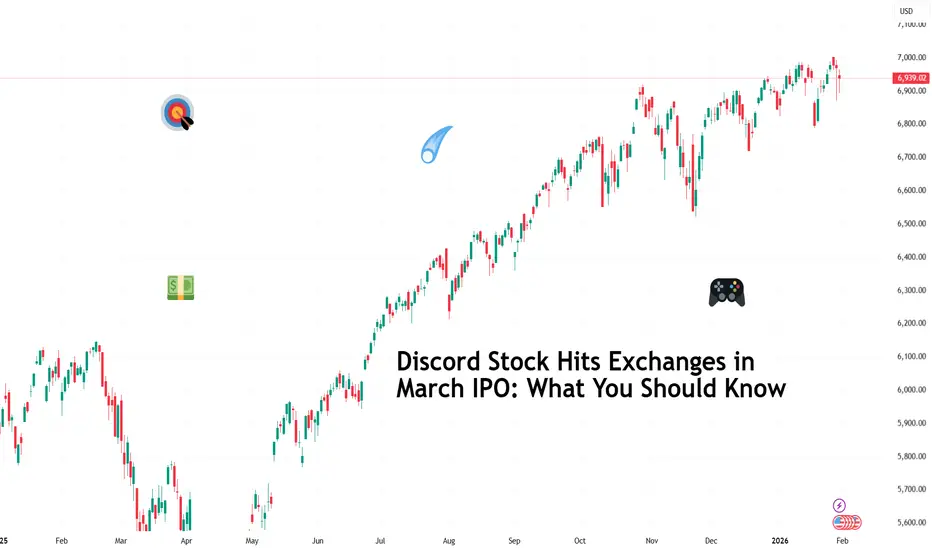
Discord Stock Hits Exchanges in March IPO: What You Should KnowDiscord NASDAQ:DISCORD has filed confidential IPO paperwork with the SEC and is aiming for a March debut (ref: the IPO calendar ), reigniting speculation around one of Silicon Valley’s most closely watched private companies.
The late-stage startup has lined up heavyweight underwriters Goldman Sa
AUD/USD – H1 - Head & Shoulders BreakdownAUD/USD has printed a clean Head & Shoulders pattern on the H1 timeframe , signaling a potential trend reversal after a strong bullish run. Price has now broken below the neckline, confirming bearish momentum and opening the door for a deeper correction. OANDA:AUDUSD
🔍 Technical Analysis
🧠 Cla

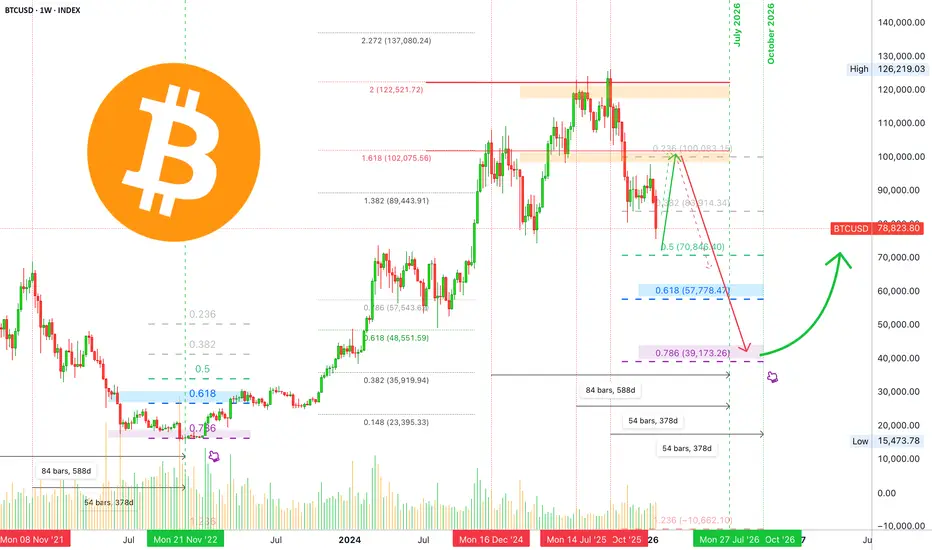
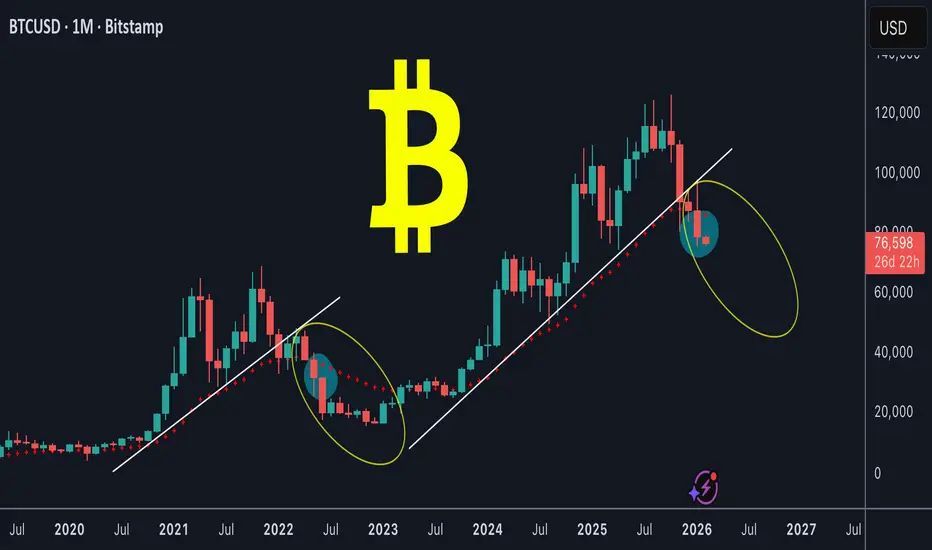
Bitcoin long-term: Full analysis year 2026 including 2027 & 2029My dear reader... It is my pleasure to write again for you today. I would like to show you the chart for Bitcoin long-term; what it looks like, what to expect.
Recently, we had a nice surprise with a bearish move that lasted just a few days longer than expected. A supposed retrace that went from $9
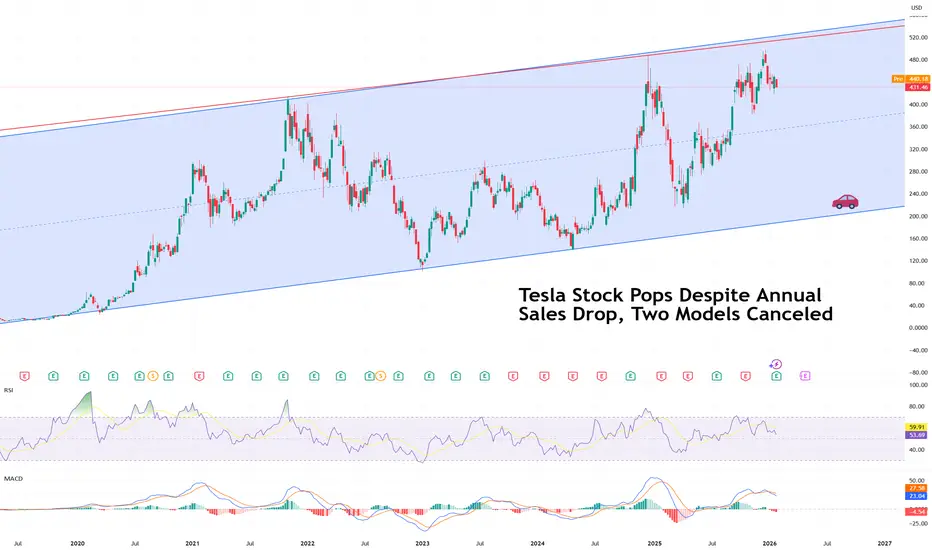
Tesla Stock Pops Despite Annual Sales Drop, Two Models CanceledTesla stock NASDAQ:TSLA managed a modest pop pre-market Thursday, rising about 3%, even as the company delivered a quarter that, on the surface, looked anything but celebratory.
Profits slid. Revenue dipped. Vehicle sales declined. Two iconic models were sent quietly into retirement. And yet, the
EURUSDHello Traders! 👋
What are your thoughts on EURUSD?
EUR/USD has successfully broken above the descending trendline as well as a key resistance zone, confirming a bullish breakout on the daily timeframe.
At current levels, price is approaching a resistance area. Therefore, a short-term correction

Hellena | GOLD (4H): LONG to resistance 5200.Since the movement continues and clearly shows no signs of reversing, I had to slightly revise the wave count, and it looks as if the impulse has been extended.
This means that the higher-order wave “3” has just ended or will end soon.
This means that wave “5” is not over yet and we should expect a

Silver’s Generational Super Cycle: 31 Years of Waiting, 15 YearsWelcome to a special macro edition of the Mubite market analysis.
Today, we are zooming out to the 12-Month (Yearly) timeframe on Silver (XAG/USD).
In trading, patience is not just a virtue; it is a requirement for generational wealth. The chart we are looking at today tells a story of massive cyc

Silver at $110 in Fierce Rally, Gold Tops $5,100. What’s Behind?(What a chart.)
Silver OANDA:XAGUSD is on a tear. Actually, scratch that — silver is on a mission. Prices have surged more than 250% over the past year, including a blistering 50% jump in January alone, lifting the metal to around $109 an ounce and placing the $110 level firmly in sight .
That

XAUUSD Bullish Structure Intact - $5,040 AheadHello traders! Here’s my technical outlook on XAUUSD (2H) based on the current chart structure. Gold continues to trade within a broader bullish context, maintaining a sequence of higher highs and higher lows. Earlier in the move, price spent a significant amount of time consolidating inside multipl
See all editors' picks ideas
Hyperfork Matrix🔱 Hyperfork Matrix 🔱 A manual Andrews Pitchfork tool with action/reaction propagation lines and lattice matrix functionality. This indicator extends Dr. Alan Andrews' and Patrick Mikula's median line methodology by automating the projection of reaction and action lines at equidistant intervals, cr

Arbitrage Matrix [LuxAlgo]The Arbitrage Matrix is a follow-up to our Arbitrage Detector that compares the spreads in price and volume between all the major crypto exchanges and forex brokers for any given asset.
It provides traders with a comprehensive view of the entire marketplace, revealing hidden relationships among d

Wyckoff Schematic by Kingshuk GhoshThe "Wyckoff Schematic" is a Pine Script indicator that automatically detects and visualizes Wyckoff Method accumulation and distribution patterns in real-time. This professional tool helps traders identify smart money movements, phase transitions, and critical market structure points.
Key Features

Volume Cluster Profile [VCP] (Zeiierman)█ Overview
Volume Cluster Profile (Zeiierman) is a volume profile tool that builds cluster-enhanced volume-by-price maps for both the current market window and prior swing segments.
Instead of treating the profile as a raw histogram only, VCP detects the dominant volume peaks (clusters) insid

DeeptestDeeptest: Quantitative Backtesting Library for Pine Script
━━━━━━━━━━━━━━━━━━━━━━━━━━━━━━━━━━
█ OVERVIEW
Deeptest is a Pine Script library that provides quantitative analysis tools for strategy backtesting. It calculates over 100 statistical metrics including risk-adjusted return ratios (Sharpe

Arbitrage Detector [LuxAlgo]The Arbitrage Detector unveils hidden spreads in the crypto and forex markets. It compares the same asset on the main crypto exchanges and forex brokers and displays both prices and volumes on a dashboard, as well as the maximum spread detected on a histogram divided by four user-selected percenti

Multi-Distribution Volume Profile (Zeiierman)█ Overview
Multi-Distribution Volume Profile (Zeiierman) is a flexible, structure-first volume profile tool that lets you reshape how volume is distributed across price, from classic uniform profiles to advanced statistical curves like Gaussian, Lognormal, Student-t, and more.
Instead of forcin

Multi-Ticker Anchored CandlesMulti-Ticker Anchored Candles (MTAC) is a simple tool for overlaying up to 3 tickers onto the same chart. This is achieved by interpreting each symbol's OHLC data as percentages, then plotting their candle points relative to the main chart's open. This allows for a simple comparison of tickers to tr

Vdubus Divergence Wave Pattern Generator V1The Vdubus Divergence Wave Theory
10 years in the making & now finally thanks to AI I have attempted to put my Trading strategy & logic into a visual representation of how I analyse and project market using Core price action & MacD. Enjoy :)
A Proprietary Structural & Momentum Confluence System

Per Bak Self-Organized CriticalityTL;DR: This indicator measures market fragility. It measures the system's vulnerability to cascade failures and phase transitions. I've added four independent stress vectors: tail risk, volatility regime, credit stress, and positioning extremes. This allows us to quantify how susceptible markets are

See all indicators and strategies
Community trends
MU — Time for a CorrectionFollowing our previous idea:
We have been rising for a long time, and it appears that it is time for a correction.
Let’s define the initial targets for the first corrective move.
Key targets:
376 — local correction
346
327
The potential move from the current level is 16–20%.

MSFT Near a Decision Area — How I’m Approaching Feb 21-Hour View — Setting the Context
On the 1-hour timeframe, MSFT is still in a bearish structure. Price has been making lower highs, and the recent bounce doesn’t change that yet. It looks more like a pause after selling rather than a confirmed reversal.
As long as price stays below the downward chan

AMD Will this Double Top start the new Bear Cycle?Advanced Micro Devices (AMD) has been practically consolidating since its October 27 2025 High between the Resistance it created and the 1D MA100 (black trend-line) that served as Support in November - January, holding firmly.
Two weeks ago the resulting 1D MA100 rebound got rejected on that Resist

Breakdown in Shopify?Shopify failed to hold a record high in late October, and now some traders may think a breakdown is starting.
The first pattern on today’s chart is the drop on November 4 after quarterly results. The e-commerce company subsequently remained below that session’s range, making lower highs in December

Nvidia - What a consolidation!🥽Nvidia ( NASDAQ:NVDA ) is just moving sideways:
🔎Analysis summary:
For more than the past six months, Nvidia has overall been moving sideways. But looking at the higher timeframe, it is still pretty likely that Nvidia will create a shorter term correction. This will then lead to a major bull

Coinbase, weekly hidden bullish divergence NASDAQ:COIN has been getting rekt alongside Bitcoin.
It has now closed below its weekly 200EMA and below the weekly pivot, a very bearish sign and it must recover to feel bullish again. Wave 2 of 5 now sits at he 0.786 fibonacci, a deep retracement for this stock.
If price falls below $141, hidde

AMD Is Up 100%+ Over 12 Months. What Its Chart Says NowHigh-end chip designer Advanced Micro Devices NASDAQ:AMD has risen more than 100% over the past year, outpacing the S&P 500 and setting an all-time high in October. Let's see what its chart and fundamental analysis say heading into this week's Q4 earnings report.
AMD's Fundamental Analysis
AMD

ACHR primed for breakoutArcher Aviation is balancing on a strong weekly support. My average is around $7.50 on this stock so I will be adding if we can touch the $6 range this week. High r/r setup if it will hold this $7 level on the weekly chart. Expecting bullish catalysts in the coming months to send this up 100%+ and c

HIMS Earnings prediction(HIMS) looks positioned for a strong earnings reaction as the company continues showing rapid revenue growth, expanding margins, and increasing subscriber counts in its direct-to-consumer telehealth platform. Investors have been rewarding scalable healthcare tech models, and HIMS has been executing

Alphabet Stock: Ascending Triangle Signals Next Move • Strong bullish trend (Higher Highs & Higher Lows)
• After a sharp rally, price is consolidating
• Current pattern: Ascending Triangle (Bullish Continuation)
• Moving Average is acting as dynamic support
Key Levels
• Major Resistance: 345 – 350
• Next Resistance: 365 – 375
• Near Support:

See all stocks ideas
Feb 2
RVTYRevvity, Inc.
Actual
1.70
USD
Estimate
1.57
USD
Feb 2
IDXXIDEXX Laboratories, Inc.
Actual
3.08
USD
Estimate
2.93
USD
Feb 2
DISWalt Disney Company (The)
Actual
1.63
USD
Estimate
1.57
USD
Feb 2
APTVAptiv PLC
Actual
1.86
USD
Estimate
1.85
USD
Feb 2
NSSCNAPCO Security Technologies, Inc.
Actual
0.38
USD
Estimate
0.32
USD
Feb 2
TSNTyson Foods, Inc.
Actual
0.97
USD
Estimate
0.95
USD
Feb 2
ARLPAlliance Resource Partners, L.P.
Actual
0.64
USD
Estimate
0.60
USD
Feb 2
TWSTTwist Bioscience Corporation
Actual
−0.50
USD
Estimate
−0.42
USD
See more events
Today
J
JAGUJaguar Uranium Corp.
Exchange
AMEX
Offer price
4.00 - 6.00
USD
Tomorrow
M
MANEVeradermics Inc.
Exchange
NYSE
Offer price
14.00 - 16.00
USD
Feb 5
B
BOBSBob’s Discount Furniture Inc.
Exchange
NYSE
Offer price
17.00 - 19.00
USD
Feb 5
F
FPSForgent Power Solutions Inc.
Exchange
NYSE
Offer price
25.00 - 29.00
USD
Feb 6
OFRMOnce Upon A Farm PBC
Exchange
NYSE
Offer price
17.00 - 19.00
USD
Feb 6
A
AGMBAgomAb Therapeutics NV
Exchange
NASDAQ
Offer price
15.00 - 17.00
USD
Feb 6
L
LFTOLiftoff Mobile Inc.
Exchange
NASDAQ
Offer price
26.00 - 30.00
USD
See more events
Community trends
February Alts Market RequestFebruary Altcoin Analysis Request – Limited Slots ⚠️
February will be treated with a potential bear market mindset. Expect selective, risk-aware analysis only, focused on structure, downside protection, and realistic scenarios, not hype.
🔹 Only 20 altcoins will be analyzed for February
🔹 First com

BTCUSDT: Reacts to Key Support - Corrective Bounce To $82,200Hello everyone, here is my breakdown of the current BTCUSDT setup.
Market Analysis
BTCUSDT was previously trading within a well-defined upward channel, where price respected both the rising support and resistance boundaries, printing higher highs and higher lows. This structure clearly confirmed

Elise | BTCUSD – 30M – Bearish ContinuationBITSTAMP:BTCUSD
After the sharp sell-off, BTC attempted a corrective consolidation but failed to regain bullish momentum. The price respected the supply zone and showed rejection, indicating this move is a distribution phase rather than a reversal. As long as price remains capped below supply, dow

Bitcoin at High-Probability Reversal Zone – Long Setup in PlayAs I expected in the previous idea , Bitcoin( BINANCE:BTCUSDT ) started declining and reached its full target.
Right now, Bitcoin has entered the heavy support zone($78,260-$70,080). Generally, strong support and resistance zones don’t break with just one attempt. On a daily timeframe, this is the

Bitcoin - Last drop, then a huge pump! (watch this wedge)Bitcoin is currently trading at around 78,000 at the time of writing this article, and I expect the price to go down to 71k - 72k in the short term. Why? As we can see on the chart, there are many reasons why Bitcoin should go down. The first reason is that whales (banks, institutions) still didn't

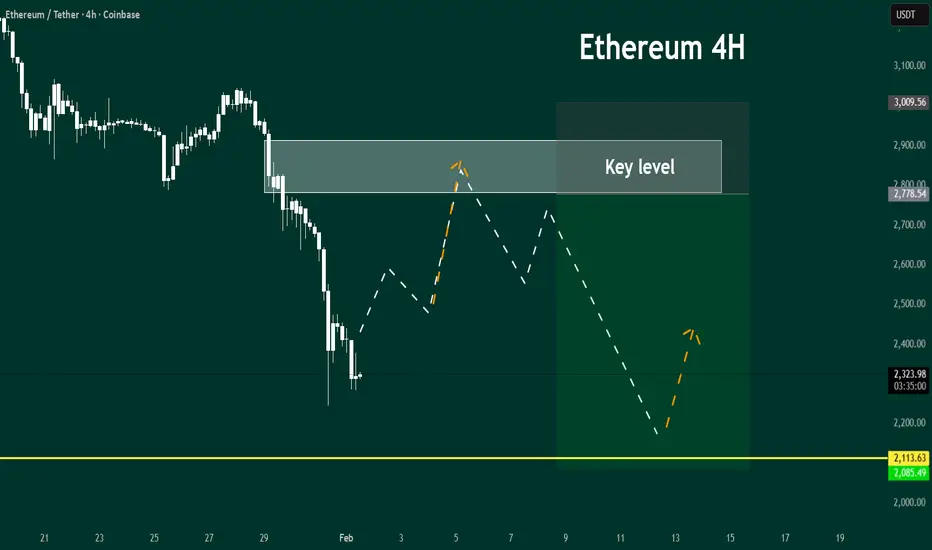
ETHEREUM: Two Setups On The Horizon.Switching it up to Ethereum today. There are two trade setups potentially setting up over the next two weeks. One is a short and one is a long and both depend on how price structure unfolds in light of the major catalysts on the horizon. The Clarity Act, NFP, unexpected tweets, geopolitical events,
BTC: Short-Term Invalidation, High TF Structure IntactHi guys, here is my market overview of what happened on Saturday and how I’m thinking about the market from here.
Short-term update:
The bullish scenario on lower timeframes is invalidated. Structure failed, local support broke, and downside followed. Any upside from here should be treated as cou

BTC monthly chart is bearishBTC / USD
I've been bearish on Bitcoin for the past 4 months (previous posts are attached below), and today we're seeing the price of Bitcoin continue to decline.
What is the current situation for Bitcoin (monthly chart)?
In short, Bitcoin has broken its upward trendline (white), as well as a
BTCUSDT Long: Breakdown, Fakeout & Potential Rebound To $79,300Hello traders! Here’s a clear technical breakdown of BTCUSDT (3H) based on the current chart structure. BTCUSDT was previously trading within a well-defined ascending channel, where price consistently respected rising support and resistance, printing higher highs and higher lows. This structure conf

SOL Breakdown in Bearish ChannelThis 2-hour SOL/USD chart with Ichimoku Cloud shows a sustained downtrend inside a descending channel. After topping near the upper resistance, price rolled over, lost cloud support, and formed a bearish consolidation before breaking lower. SOL continues to trade below key resistance around 128–130,

See all crypto ideas
XAUUSDHello Traders! 👋
What are your thoughts on Gold?
After a strong and uninterrupted rally, Gold reached the upper boundary of the ascending channel and faced a sharp rejection, triggering a deep corrective move. Considering the extended bullish move over recent weeks without any meaningful pullback,

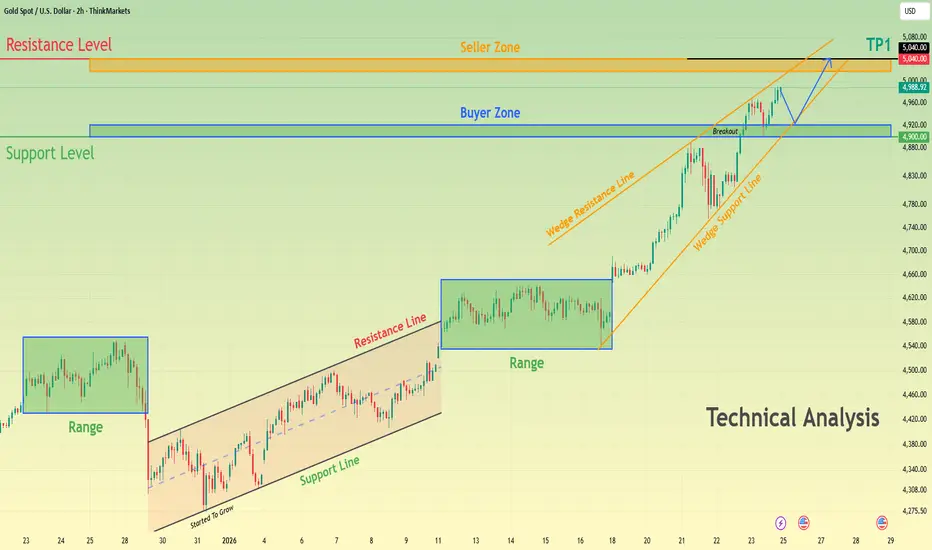
Gold Reclaims Support After Sharp Drop - 5,100 Resistance as TP1Hello traders! Here’s my technical outlook on XAUUSD (4H) based on the current chart structure. Gold initially traded within a clearly defined range, where price moved sideways, signaling a period of consolidation and market balance before the next impulsive move. From this range, XAUUSD broke to th

Gold and Silver Crash: A Coordinated Sell-Off, Not “Profit TakinGold and Silver Crash: A Coordinated Sell-Off, Not “Profit Taking”
On Friday we had a huge sell-off in gold and silver.
I have shared my opinion many times that these instruments are highly manipulated and it became obvious now because we had nothing to explain why they went down.
Obviously this

GOLD - Correction within the local downtrend FX:XAUUSD stabilizes after correction, returning above $4750 after testing the $4400 area earlier in the week. However, the overall trend remains under pressure.
Key factors: DXY remains strong, limiting gold's growth. Tensions between the US and Iran have eased slightly, reducing demand for g

Gold 30-Min — Volume Buy & Sell Reversal Triggered⚡Base : Hanzo Trading Alpha Algorithm
The algorithm calculates volatility displacement vs liquidity recovery, identifying where probability meets imbalance.
It trades only where precision, volume, and manipulation intersect —only logic.
✈️ Technical Reasons
/ Direction — LONG / Reversal 4355 Area

Gold Price Analysis – Key Resistance, Support Levels, and PotentThis chart provides an in-depth analysis of gold prices, highlighting critical resistance and support zones. The Sell Zone at 5,438.172 represents a key resistance level where price may face rejection, offering a potential sell opportunity if the level holds. The Support Zone at 4,933.394 is expecte

GOLD 1H CHART ROUTE MAP UPDATE & TRADING PLAN FOR THE WEEKHey Everyone,
Please see our 1h chart levels and targets for the coming week.
We are seeing price play between two weighted levels with a gap above at 4955 and a gap below at 4868, as support. We will need to see ema5 cross and lock on either weighted level to determine the next range.
We will se

Gold Technical Outlook (XAUUSD)Hi!
Gold is still holding above its ascending trendline, and this structure has not been broken yet. After a sharp decline from the $5600 area, price rebounded strongly from the trendline and the key flip zone highlighted in blue.
The first supply/demand area around $4807 has now been fully engulf

Gold Under Pressure | Fed Chair Warsh Fuels Sell Zone at 4,800Hey Traders,
In today’s trading session, we are closely monitoring XAUUSD (Gold) for a potential selling opportunity around the 4,800 zone. Gold was previously trading in a strong uptrend and is now undergoing a corrective phase, approaching a key retracement level and the 4,800 support-turned-resi

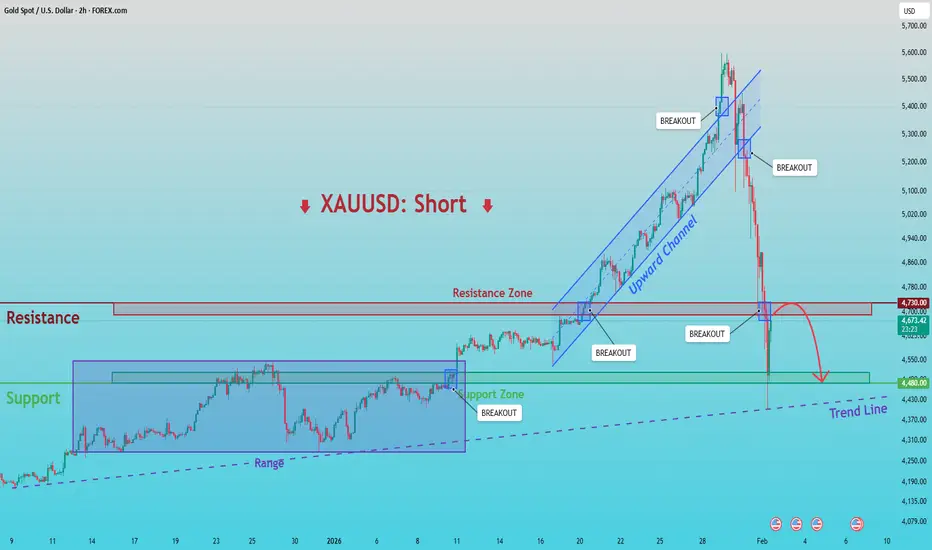
XAUUSD: Below 4,730 Resistance - Targeting 4,480 SupportHello everyone, here is my breakdown of the current XAUUSD setup.
Market Analysis
XAUUSD was previously trading within a clearly defined upward channel, where price respected both the rising support and resistance boundaries, forming a sequence of higher highs and higher lows. This structure conf
See all futures ideas
EURUSD Short: Rally Stalls at Supply - Key Reaction Near 1.1800Hello traders! Here’s a clear technical breakdown of EURUSD (1H) based on the current chart structure. EURUSD has recently completed a notable structural shift after trading within a well-defined descending channel. During this phase, price consistently respected the falling resistance and printed l

EURUSD Bulls Take Control - 1.1940 as Next TestHello traders! Here’s my technical outlook on EURUSD (3H) based on the current chart structure. EURUSD previously traded within a well-defined ascending channel, where price consistently respected both the rising support line and the channel resistance, confirming steady bullish control and healthy

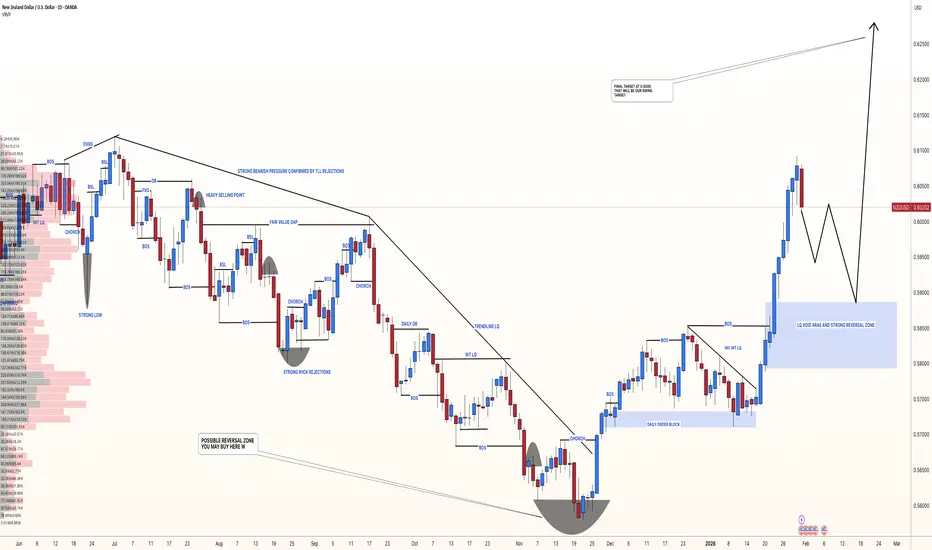
NZDUSD: First Drop Around 150+ Pips Then 800+ Pips BuyDear traders,
I hope you’re all doing well. We have a great opportunity where we expect the price to drop around our target area. This area looks promising and safer than selling at the current price. We recommend waiting for the price to touch our target before considering a buy. Remember the mar
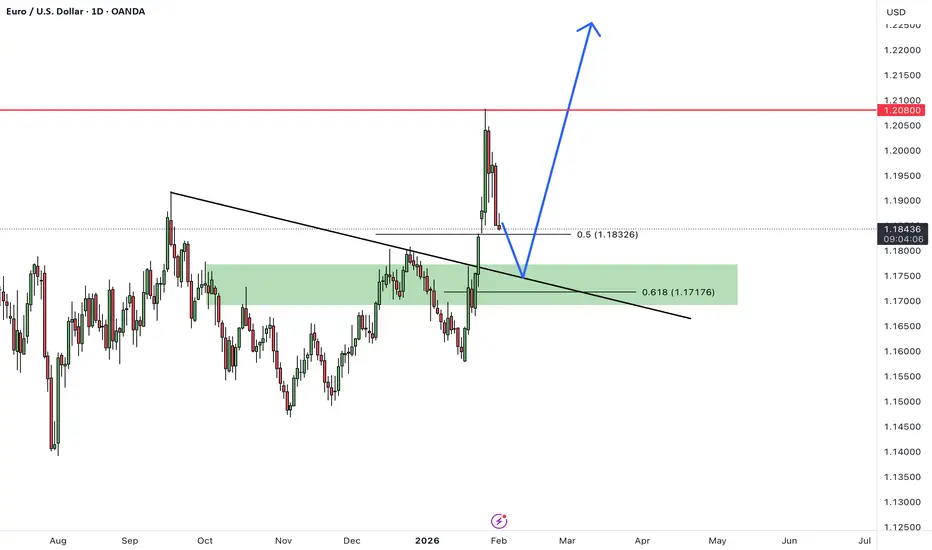
EURUSDHello Traders! 👋
What are your thoughts on EURUSD?
EUR/USD successfully broke above the key resistance zone and the descending trendline, extending its bullish move toward the 1.1200 area. From this level, the pair entered a corrective phase.
This pullback is considered a healthy correction and a
After a strong rally, the market is cooling off to retest equiliHello everyone,
EURUSD is currently displaying a very familiar forex market behavior: a sharp advance → profit-taking → a return toward balance.
Earlier, EURUSD rebounded clearly from the 1.16 area, forming a sequence of higher highs and higher lows, with EMA 34 and EMA 89 stacked cleanly and s

Lingrid | EURUSD will continue to riseThis EURUSD daily chart is a clean “market-regime” story:
📉 THEN (2018–2020)
A falling channel dominated — slow grind lower.
📈 THEN (2020–2021)
A regime flip into a rising channel — strong recovery trend.
⏸ THEN (2021)
Compression (triangle) — uncertainty before the next leg.
📉 THEN (2021–2022)

EUR/USD – H1 - Fundamental Pressure Takes Control 📝 Description🔍 Setup (Fundamental + Technical) FX:EURUSD
EUR/USD has lost bullish structure after breaking below the rising trendline and confirming a bearish retest. Price is also trading below the Ichimoku cloud, with a bearish cloud crossover, signaling trend weakness.
📉 Fundamental catalys

02.02.26 Daily ForecastPairs on Watch -
FX:EURUSD
FX:GBPUSD
FX:GBPCAD
FX:USDCAD
A short overview of the instruments I am looking at for today, multi-timeframe analysis down to what I will be looking at for an entry. Enjoy!

EURUSD Bearish Continuation ConfirmationQuick Summary
EURUSD is expected to continue its bearish move and The downside target is 1.16672, Price is aiming to fill the H4 liquidity void
A confirmed break below 1.18329 will validate further selling
Sell entries should only be taken after this level is clearly broken
Full Analysis
After th

AUDCAD:Major Weekly Resistance Tested – Rejection Risk IncreasesAUDCAD: Major Weekly Resistance Tested – Rejection Risk Increases
AUDCAD is trading at a strong weekly resistance zone that has capped price multiple times in the past May 2021, April 2022, January 2023, and September 2024.
This area has repeatedly acted as a major supply zone, and price is now t

See all forex ideas
| - | - | - | - | - | - | - | ||
| - | - | - | - | - | - | - | ||
| - | - | - | - | - | - | - | ||
| - | - | - | - | - | - | - | ||
| - | - | - | - | - | - | - | ||
| - | - | - | - | - | - | - | ||
| - | - | - | - | - | - | - | ||
| - | - | - | - | - | - | - |
Trade directly on Supercharts through our supported, fully-verified, and user-reviewed brokers.


