How One Bad Trade Can Ruin A MonthWelcome everybody.
Make sure to follow more trading articles! I hope you enjoy this one.
Today we will talk about something that can annihilate more accounts than terrible strategies ever do.
One undisciplined trade. Not ten. Not twenty! Just one. In trading, damage happens fast, very fast and recovery can take.. what feels like.. “ Forever ”
The Good , the Bad , the Ugly Trades
A good trade is based on precision and timed execution, not outcome.
It is you, following your system, respecting your set risk and accepting the result, whether it is a win or a loss.
Good trades build long term consistency because they are repeatable.
A bad trade is emotionally driven. It ignores structure and focuses on impulse over discipline.
The ugly trade is not just oversized... It is when the trader disconnects from logic.
When the trader takes it personal.
A Good Trade:
- Follows your system
- Has predefined risk
- Respects SL’s
- Is repeatable
A Bad Trade:
- Breaks risk rules
- Increases size impulsively
- Moves stoploss emotionally
- Is driven by revenge or overconfidence
An Ugly Trade: (Where traders have no control over themselves)
- Urge to smash a desk or keyboard
- Wanting to punch or through something
- Aggressive body tension
- Clenched fists and jaw
- Sudden explosive movements
- Pacing restless agitation
- Acting on impulse without thinking
What Does “ Ruin ” Mean?
Ruin does not always mean blowing the account completely.
It can mean:
- Erasing weeks of steady gains
- Destroying confidence
- Creating emotional instability
- Forcing you into recovery mode
You can spend 3–4 weeks building +6% to +8% slowly…
Then lose it in one oversized trade.
Consistency builds slowly.
Damage happens instantly.
The Mathematical & Psychological Impact
Let’s say you risk 1% per trade and increase your account by +8% over a month.
Then one day:
- You risk 10% on a “perfect” setup
- The trade loses
Now most or all your monthly progress is gone.
But the bigger issue is psychological:
You hesitate on the next setup
You try to “ win it back ”
You start forcing trades
One bad trade becomes three
This is how a strong month turns into a negative one.
Large losses do not just affect your balance they affect your decision-making.
Conclusion
Small, controlled losses are part of the game.
Oversized, emotional losses are optional.
A profitable month is built on:
- Controlled risk
- Repetition
- Discipline
- Emotional stability
One trade should never be large enough to undo weeks of structured progress.
Protect your risk.
Protect your mindset.
Because in trading, survival is everything.
Harmonic Patterns

is your trading strategy ignoring the power of basis?You ever look at a chart, see spot grinding up slowly, while futures are flying like they just drank 5 energy drinks, and think: “Yeah… this smells like overheating”?
That smell has a name: basis.
Let’s break it down in human language.
Spot price is the “right now” price. You buy, you own. Simple.
Futures price is the “later” price. You agree today on a price for tomorrow. Leverage, margin, all that spicy stuff lives there.
Basis is just the gap between futures and spot.
Futures price - spot price = basis
If BTC spot is 60 000 and the futures contract is trading at 63 000, the basis is +3 000. That +3 000 is not just a random number. It’s the market screaming:
“People are so hyped about the future that they’re willing to pay extra for it.”
Now, how does that gap help “overheat” spot?
Here’s the trick: when that gap gets big enough, big players smell free money.
Example:
Spot BTC: 60k
Futures BTC (3 months): 63k
A pro looks at that and goes:
“Cool. I’ll buy spot at 60k and short futures at 63k. I lock in the 3k spread. I don’t care where price goes, I just farm the gap.”
That’s called a cash-and-carry type play. For you as a beginner, the name doesn’t matter. What matters is what this trade does to the market:
- They buy spot → that’s real demand on the spot market
- They short futures → that adds sell pressure on futures
Result: spot gets pushed up, not because everyone suddenly loves BTC more, but because arbitrage guys want to harvest the premium.
So the futures premium (the basis) literally forces extra buying on spot.
That’s how a fat basis can “help” overheat spot.
From the outside, it looks like:
“Wow, spot is so strong, bulls are in control!”
But under the hood it might be:
“No, my dude, this is just carry traders farming yield.”
And when does it get dangerous?
When three things line up:
1) Futures are trading way above spot
2) Funding is high, everyone is happily leveraged long
3) Spot is pumping mostly on that arbitrage demand
Then what?
If basis collapses (for example, futures fall or spot catches up), that juicy spread disappears. The carry trade becomes less attractive. New arbitrage demand slows, sometimes reverses.
Spot loses that invisible support. That’s where tops are often born: not when the last buyer buys, but when the last forced buyer stops needing to buy.
Maybe I’m wrong, but if you’re buying spot into a massive futures premium thinking “this is just the beginning”, you’re not investing, you’re donating.
Flip side: when futures trade below spot (negative basis), it often means fear, hedging, or panic. That’s when nobody wants to pay extra for future exposure. Quite often, the best spot entries happen when the crowd is scared and basis is dead or negative, not when futures are screaming to the upside.
So how I treat basis?
I use it like a market thermometer:
- Small, calm gap: market is chilled
- Big, juicy gap: FOMO, leverage, carry trades, possible overheating
- Gap suddenly shrinking while price is still high: I start respecting gravity
Candles show you what price did.
Basis often shows you how crazy people are while they do it.
In a leveraged world, that extra bit of “how crazy” can save you from buying the exact top.

9 Crucial Tips to Avoid Major Losses in Trading9 Crucial Tips to Avoid Major Losses in Trading
Most new traders don’t fail because they lack intelligence.
They fail because they don’t understand risk.
Here are 9 practical, non-theoretical rules that can protect your capital and dramatically reduce the chance of major losses.
1️⃣ Risk Only a Small Percentage Per Trade
Never risk more than 1–2% of your account on a single position.
If one trade can seriously damage your account, your position size is too large.
Small risk = long survival.
Long survival = real opportunity.
2️⃣ Always Use a Stop Loss
A Stop Loss is not optional — it is protection.
Without a predefined exit, a small mistake can turn into a catastrophic loss.
Professional traders accept small losses quickly instead of defending bad positions.
3️⃣ Don’t Trade Without a Clear Setup
Before entering, you should have:
- Clear market structure (trend or range)
- Logical entry zone
- Confirmation signal
If you can’t explain your trade in one sentence, don’t take it.
4️⃣ Avoid Overleveraging
Leverage magnifies both profit and loss.
High leverage feels attractive, but it increases emotional pressure and reduces decision quality.
Many blown accounts are caused by excessive leverage — not bad analysis.
5️⃣ Don’t Revenge Trade
After a loss, emotions spike.
Trying to “win it back” usually leads to larger losses.
Step away. Reset your mindset. The market will still be there tomorrow.
6️⃣ Don’t Average Down on Losing Trades
Adding to a losing position without structural confirmation increases risk exponentially.
Hope is not a strategy.
If your analysis is invalid, exit don’t defend.
7️⃣ Follow Risk-to-Reward Discipline
Aim for trades where potential reward is at least 2x the risk (1:2 R:R or better).
Even with a 50% win rate, strong R:R keeps you profitable long term.
Win rate alone means nothing without proper R:R.
8️⃣ Journal Every Trade
Track:
-Entry reason
-Exit reason
- Emotional state
- Result
Data exposes patterns. Patterns reveal weaknesses.
Improvement starts with measurement.
9️⃣ Protect Your Psychology
Major losses often come from emotional decisions:
- Fear of missing out (FOMO)
- Overconfidence after wins
- Desperation after losses
Discipline is not about being perfect.
It’s about staying stable.
Final Thought
In trading, the goal is not to make money quickly.
The goal is to avoid losing big.
Because once your capital is protected, profits become a mathematical outcome of consistent execution.
Survive first.
Grow second.

Gold Surges on War Fears — Safe-Haven Shift Begins?Gold Is Not Just Rising — It’s Reacting to a Major Geopolitical Shift
Gold isn’t simply “going up.” What we’re witnessing now reflects structural global capital behavior, not random speculation. Over recent weeks, gold has surged into price territory not seen in nearly 50 years breaking key levels rapidly and forming a new elevated range around 5,500–5,600 USD/oz. The speed, breadth, and consistency of this move marks it as something deeper than a typical bullish cycle And importantly, the reason behind this move goes beyond traditional drivers.
This rally is happening alongside one of the most serious geopolitical conflicts in the modern era. The United States and Israel have launched significant military strikes on Iran, and tensions in the Middle East have escalated sharply. This isn’t an isolated incident markets are responding to the real possibility of expanded conflict and long-term regional instability. Safe-haven assets like gold and silver are surging as investors seek protection amid rising geopolitical risk.
When military conflict escalates especially involving the U.S., Israel, and Iran, it impacts energy markets, currency markets, and risk sentiment globally. Oil prices have spiked sharply due to fears of disruption around the Strait of Hormuz, one of the world’s most critical energy bottlenecks. Higher energy prices feed into inflation expectations, complicate central bank policy, and reduce confidence in traditional risk assets. All of this pushes capital toward gold.
The U.S. dollar remains under pressure even as Treasury yields rise due to expanding debt issuance and persistent fiscal deficits, forcing markets to question the long-term stability of paper assets. As the U.S. refinances record-high debt, confidence gradually shifts toward tangible stores of value this is balance sheet mathematics, not emotion. Central banks have been steadily increasing gold reserves to diversify away from concentrated dollar exposure, reinforcing this structural shift. At the same time, war risks in the Middle East, geopolitical fragmentation, fragile crypto markets, stretched equity valuations, and uncertainty surrounding Federal Reserve policy and political leadership all amplify systemic risk. In such an environment where sovereign debt expands, currencies weaken, and institutional trust is tested capital naturally rotates toward gold. While short-term pullbacks are normal, the forces driving this move are structural, not temporary.
This is why gold is rallying alongside other precious metals:
• It’s not just inflation fear — it’s geopolitical insecurity.
• It’s not just market noise — it’s capital repositioning.
• And it’s not just temporary — it’s macro-driven de-risking and hedging behavior seen in major conflict cycles.
This doesn’t mean gold won’t pull back or correct from time to time. After such a sharp move, healthy technical retracements are expected. However, the primary forces driving this rally war risk, energy market stress, sovereign debt issues, and weakening confidence in traditional assets remain structural, not temporary.
Final Thought:
Gold isn’t rallying because traders are optimistic. it’s rallying because capital is seeking safety in a world facing expanding geopolitical conflict and uncertainty.

how to spot market reversals using funding extremesI love those moments when funding goes totally crazy.
That’s where the market quietly whispers: “Hey, someone’s about to get wrecked.”
Let’s talk about how to catch reversal spots when funding is skewed – in plain English.
Perpetual futures have this thing called funding. Simple version:
If funding is positive, longs are paying shorts.
If funding is negative, shorts are paying longs.
So when funding is very positive, it means people are so desperate to stay long they’re literally paying a fee every 8 hours just to keep their position. Same with huge negative funding – everyone is leaning short and paying to bet on doom.
Now, here’s the trick: funding extremes often show where the crowd is trapped. And trapped money is where reversals are born.
Imagine BTC has been pumping for days. Your feed is full of “to the moon,” funding is insanely positive, open interest is climbing, and every small dip gets aggressively bought. But price suddenly stops making higher highs, starts chopping, throwing long wicks, and yet funding is still overloaded positive.
What does that tell me?
Longs are crowded. Late buyers are FOMOing in. Everyone is already on one side of the boat. If price drops even a bit, those overleveraged longs start getting squeezed, forced to close, which adds more selling, which triggers more liquidations. Bam – reversal or at least a nasty pullback.
Same thing flipped on the downside.
Market nukes, funding becomes massively negative, shorts are comfy and talking about “zero soon.” Price stops making lower lows, starts grinding sideways, wicks down get bought, but funding is still super negative. That’s my radar ping: shorts overcrowded, any squeeze up can trigger panic covering and drive a sharp reversal.
How I use it in practice:
First, I look at trend and key levels on the chart. No magic, just basic support, resistance, highs, lows.
Then I check funding. Is it extreme in the same direction as the move? Are traders paying a stupidly high fee to stay in an already crowded trend?
If yes, I don’t jump in blindly. I wait for price to show me weakness: failed breakout, fakeout above highs, long wick rejection, or a sharp move back into the range. That’s where I start hunting for entries against the crowd, with tight risk.
Maybe I’m wrong, but most big emotional moves I’ve traded had the same pattern: price extreme + funding extreme + herd confidence at 100%.
One warning: skewed funding is a signal, not a green light to yolo countertrend. Strong trends can stay overfunded longer than your account can stay alive. Always pair funding with structure and a clear invalidation level.
But if you learn to read when the crowd is overpaying to be on the “obvious” side, you’ll stop being exit liquidity… and occasionally become the one flipping the trend on their heads.

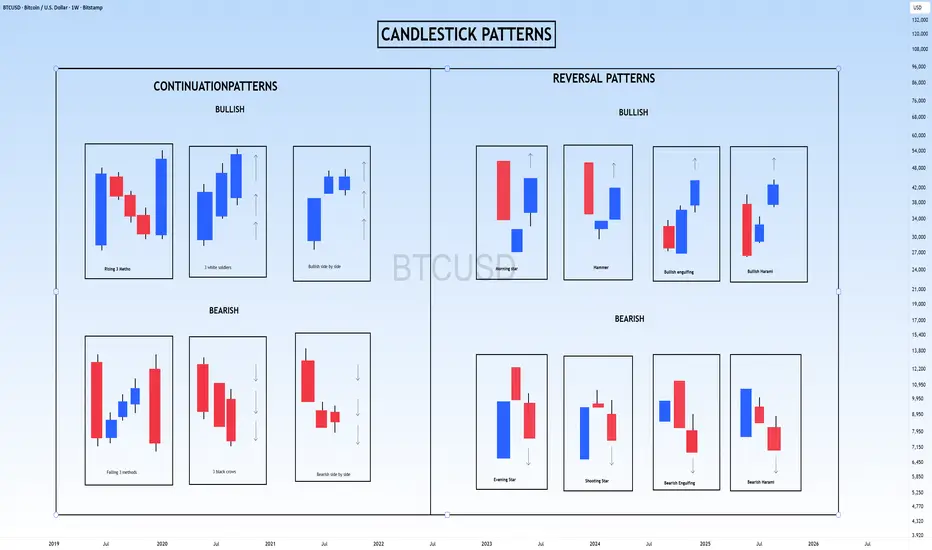
CANDLESTICK PATTERNS – COMPLETE BREAKDOWN & EXPLANATION 📊 CANDLESTICK PATTERNS – COMPLETE BREAKDOWN & EXPLANATION
The chart you shared is a comprehensive visual guide to candlestick patterns, divided into two major categories:
Continuation Patterns
Reversal Patterns
These patterns help traders understand market psychology, momentum, and potential future price direction.
Let’s break down everything shown in the chart in detail 👇
🔵 CONTINUATION PATTERNS
Continuation patterns suggest that the current trend is likely to continue after a brief pause or consolidation.
🟢 BULLISH CONTINUATION PATTERNS
These appear during an uptrend and suggest the uptrend will resume.
1️⃣ Rising Three Methods
Structure:
1 strong bullish candle
Followed by 3 small bearish candles (consolidation)
Ends with another strong bullish candle breaking higher
Psychology:
Buyers remain in control. Sellers try to push price down but lack strength.
Signal:
Continuation of the uptrend.
2️⃣ Three White Soldiers
Structure:
Three strong bullish candles in a row
Each closes higher than the previous
Small or no lower wicks
Psychology:
Aggressive buying pressure. Strong trend confirmation.
Signal:
Strong bullish continuation.
3️⃣ Bullish Side-by-Side
Structure:
Strong bullish candle
Followed by small candles moving sideways
Breakout upward
Psychology:
Market pauses but buyers are still dominant.
Signal:
Uptrend continuation.
🔴 BEARISH CONTINUATION PATTERNS
These appear during a downtrend and suggest the downtrend will continue.
4️⃣ Falling Three Methods
Structure:
1 strong bearish candle
3 small bullish candles (weak pullback)
1 strong bearish candle breaking lower
Psychology:
Temporary relief rally, but sellers remain dominant.
Signal:
Continuation of the downtrend.
5️⃣ Three Black Crows
Structure:
Three strong bearish candles
Each closes lower than the previous
Small upper wicks
Psychology:
Strong selling pressure.
Signal:
Bearish continuation.
6️⃣ Bearish Side-by-Side
Structure:
Strong bearish candle
Small sideways candles
Breakdown downward
Psychology:
Sellers pausing before pushing price lower.
Signal:
Downtrend continuation.
🔁 REVERSAL PATTERNS
Reversal patterns suggest the trend may change direction.
🟢 BULLISH REVERSAL PATTERNS
These appear at the bottom of a downtrend and suggest price may rise.
7️⃣ Morning Star
Structure:
Large bearish candle
Small indecision candle (gap or small body)
Strong bullish candle closing deep into first candle
Psychology:
Sellers lose strength. Buyers step in aggressively.
Signal:
Downtrend reversing into uptrend.
8️⃣ Hammer
Structure:
Small body at top
Long lower wick
Appears after a decline
Psychology:
Sellers pushed price down, but buyers rejected lower prices.
Signal:
Potential bullish reversal.
9️⃣ Bullish Engulfing
Structure:
Small bearish candle
Large bullish candle fully engulfs previous candle
Psychology:
Buyers completely overpower sellers.
Signal:
Strong reversal to upside.
🔟 Bullish Harami
Structure:
Large bearish candle
Small bullish candle inside previous candle body
Psychology:
Selling pressure is weakening.
Signal:
Possible trend reversal upward.
🔴 BEARISH REVERSAL PATTERNS
These appear at the top of an uptrend and suggest price may fall.
1️⃣1️⃣ Evening Star
Structure:
Large bullish candle
Small indecision candle
Large bearish candle closing deep into first candle
Psychology:
Buyers lose momentum. Sellers take control.
Signal:
Uptrend reversing into downtrend.
1️⃣2️⃣ Shooting Star
Structure:
Small body at bottom
Long upper wick
Appears after an uptrend
Psychology:
Buyers pushed higher but were rejected.
Signal:
Potential bearish reversal.
1️⃣3️⃣ Bearish Engulfing
Structure:
Small bullish candle
Large bearish candle fully engulfs previous candle
Psychology:
Sellers overwhelm buyers.
Signal:
Strong bearish reversal.
1️⃣4️⃣ Bearish Harami
Structure:
Large bullish candle
Small bearish candle inside previous body
Psychology:
Buying pressure weakens.
Signal:
Possible reversal downward.
🧠 What This Chart Is Teaching
The chart is essentially teaching:
✔ Market Psychology
Candlesticks represent a battle between buyers and sellers.
✔ Trend Continuation vs Trend Reversal
Continuation = trend pauses, then continues
Reversal = trend direction changes
✔ Pattern Confirmation
Patterns work best:
At support/resistance
With volume confirmation
With trend context
On higher timeframes (like weekly)
⚠ Important Notes
No pattern is 100% accurate.
Always wait for confirmation.
Combine with:
Support & resistance
Trendlines
Moving averages
Volume
RSI / MACD
📈 Why This Matters (Especially for Crypto & BTC)
On volatile markets like BTC:
Continuation patterns help you ride trends.
Reversal patterns help you catch bottoms/tops early.
Weekly timeframe patterns are especially powerful.
🔥 Final Summary
This chart is a complete visual cheat sheet of:
• 6 Continuation patterns
• 8 Reversal patterns
• Bullish and Bearish versions
• Market psychology behind each formation
Mastering these patterns allows you to:
Understand price action deeply
Trade without relying only on indicators
Improve entry & exit timing
Candlestick patterns need to be one of your trading arsenal's most effective weapons. We can determine the direction of the market using several candlestick patterns. All timeframes exhibit these patterns, but the daily candlestick patterns seem to be the most reliable.
Once you recognize these patterns, you may be ready for your next move and use other tools to join the market, including the previously discussed MA approach and flag patterns (see attached charts). This chart is just for information
Never stop learning
I would also love to know your charts and views in the comment section.
Thank you
unlock the secret of impulse candles: your guide to decision zonYou know that moment when price suddenly wakes up, slaps everyone in the face with one huge candle, and runs off without you?
Yeah, that one candle can give you a full trading plan for the next few hours or even days – if you know how to pull “impulse levels” from it.
Let me break down how I mark those “decision levels” after a strong candle and use them like magnets on the chart.
First, what’s an impulse candle for me?
Not just “big”. I want:
1. Candle clearly bigger than the last 10–20 candles
2. Strong body, small wicks (market wasn’t hesitating, it was attacking)
3. Often breaking some local range, high/low, or structure
In simple words: that candle shows where big money stopped thinking and started acting.
Now, where’s the “decision level” inside that candle?
For a bullish impulse:
- The open is usually where sellers got trapped or gave up
- The close is where buyers pushed it to before the pause
So the body of that candle is my “decision zone” – that’s where the market chose direction.
What I do on the chart:
1. I mark a zone from the open to the close of the impulse candle
2. If the candle is insanely huge, I narrow it to the middle 50% of the body
3. High/low of the wick for me are secondary – more like extremes for stop placement, not the main level
Then I just wait. No FOMO, no chasing. Let price come back to that decision zone.
Scenario for a bullish impulse:
- Price shoots up with a big green candle
- I mark the body as a demand zone
- On the pullback, I watch how price behaves inside that area:
- Sharp rejection? Long lower wicks? Smaller timeframe bounce? Good.
- Clean break through like butter? I’m not a hero, I step aside.
Entries:
- Conservative style: wait for a clear reaction from the zone, then enter with stop behind the wick
- Aggressive style: limit order at the zone, stop beyond the impulse low, accept that sometimes it just fails and move on
Higher timeframe trick:
Impulse on H1 or H4 is gold. Mark that body zone, then drop to M5–M15 to hunt entries when price comes back. Same “decision level”, just zoomed-in execution.
A few filters I personally use:
- I only respect impulses that break something meaningful (range, high/low, trendline)
- I don’t mark every big candle in a choppy mess
- The best ones start from some base or consolidation, not from the middle of nowhere
Maybe I’m wrong, but most traders obsess over patterns and ignore the obvious: where the market actually made a decision. That one candle is like a footprint of the big players. Why not trace it?
Final thought:
The market always remembers its decision levels.
It might ignore them once, twice, but when you see price come back and react sharply from your impulse zone – that’s where the “random” market suddenly starts looking very logical.

Candlestick Patterns: Ancient Wisdom Meets Modern AI
Candlesticks Have Been Reading Market Psychology for 300 Years. Here's Why They Still Work.
In the 1700s, Japanese rice traders developed a visual language to read market emotion.
Three centuries later, with AI, algorithms, and high-frequency trading, those same patterns still work.
Why? Because candlesticks don't predict the future — they reveal human psychology. And that hasn't changed.
What Candlesticks Really Tell You
Each candlestick is a story:
The Body:
Open to close
Shows who won the battle (bulls or bears)
Size shows conviction
The Wicks (Shadows):
High and low of the period
Shows rejection
Long wicks = failed attempts
The Color:
Green/White = Bulls won (close > open)
Red/Black = Bears won (close < open)
Single Candlestick Patterns
1. Doji
Appearance:
Open and close nearly equal. Small or no body.
Psychology:
Indecision. Bulls and bears fought to a draw.
Trading Implication:
In uptrend: Potential reversal
In downtrend: Potential reversal
In range: Continuation of indecision
Confirmation Needed:
Doji alone isn't enough. Wait for next candle.
2. Hammer
Appearance:
Small body at top, long lower wick (2-3x body size), little to no upper wick.
Psychology:
Bears pushed price down, bulls rejected and pushed back up.
Trading Implication:
Appears at bottom of downtrend
Bullish reversal signal
Stronger if green
3. Shooting Star
Appearance:
Small body at bottom, long upper wick, little to no lower wick.
Psychology:
Bulls pushed price up, bears rejected and pushed back down.
Trading Implication:
Appears at top of uptrend
Bearish reversal signal
Stronger if red
4. Marubozu
Appearance:
Large body, no wicks (or very small).
Psychology:
Complete domination by one side. No rejection.
Trading Implication:
Bullish Marubozu: Strong continuation up
Bearish Marubozu: Strong continuation down
Shows conviction
Two-Candlestick Patterns
1. Engulfing Pattern
Bullish Engulfing:
First candle: Small red
Second candle: Large green that completely engulfs first
Appears at bottom of downtrend
Strong reversal signal
Bearish Engulfing:
First candle: Small green
Second candle: Large red that completely engulfs first
Appears at top of uptrend
Strong reversal signal
Why It Works:
Complete rejection of previous sentiment. Power shift.
2. Tweezer Tops/Bottoms
Tweezer Top:
Two candles with same high
At top of uptrend
Shows resistance
Bearish reversal
Tweezer Bottom:
Two candles with same low
At bottom of downtrend
Shows support
Bullish reversal
3. Piercing Pattern / Dark Cloud Cover
Piercing Pattern (Bullish):
First candle: Large red
Second candle: Green that opens below close, closes above 50% of first
At bottom of downtrend
Bullish reversal
Dark Cloud Cover (Bearish):
First candle: Large green
Second candle: Red that opens above close, closes below 50% of first
At top of uptrend
Bearish reversal
Three-Candlestick Patterns
1. Morning Star (Bullish)
Structure:
First candle: Large red (downtrend continues)
Second candle: Small body (indecision)
Third candle: Large green (reversal confirmed)
Psychology:
Downtrend → Pause → Reversal
Trading:
Enter on close of third candle, stop below low.
2. Evening Star (Bearish)
Structure:
First candle: Large green (uptrend continues)
Second candle: Small body (indecision)
Third candle: Large red (reversal confirmed)
Psychology:
Uptrend → Pause → Reversal
Trading:
Enter on close of third candle, stop above high.
3. Three White Soldiers (Bullish)
Structure:
Three consecutive large green candles
Each opens within previous body
Each closes near high
Strong upward momentum
Trading:
Continuation pattern. Trend is strong.
4. Three Black Crows (Bearish)
Structure:
Three consecutive large red candles
Each opens within previous body
Each closes near low
Strong downward momentum
Trading:
Continuation pattern. Downtrend is strong.
Candlestick Patterns + Context
Critical Rule:
Candlestick patterns don't work in isolation. Context is everything.
Context Checklist:
Trend — Is this with or against the trend?
Support/Resistance — Is pattern at key level?
Volume — Is there volume confirmation?
Timeframe — Higher timeframe = more reliable
Market Conditions — Trending or ranging?
Example:
Hammer at support in uptrend with volume = High probability
Hammer in middle of range with no volume = Low probability
AI-Enhanced Candlestick Analysis
What AI Adds:
1. Pattern Recognition at Scale
Scan thousands of charts instantly
Identify patterns you'd miss
Rank by probability
2. Historical Success Rate
"This pattern worked 68% of the time in similar conditions"
Data-driven confidence
Removes guesswork
3. Context Analysis
AI checks trend, volume, support/resistance automatically
Filters low-probability setups
Shows only high-quality patterns
4. Multi-Timeframe Confirmation
Checks if pattern aligns across timeframes
Higher probability when multiple timeframes agree
Candlestick Trading Rules
Rule 1: Confirmation is Key
Never trade a pattern alone. Wait for:
Next candle confirmation
Volume confirmation
Support/resistance alignment
Rule 2: Bigger Timeframe = More Reliable
Daily patterns > 1H patterns
Weekly patterns > Daily patterns
Use lower timeframes for entry, higher for direction
Rule 3: Trend is Your Friend
Reversal patterns against strong trend = risky
Continuation patterns with trend = higher probability
Wait for trend confirmation before reversals
Rule 4: Volume Validates
Bullish pattern with high volume = strong
Bearish pattern with low volume = weak
Volume confirms conviction
Rule 5: Location Matters
Patterns at support/resistance = powerful
Patterns in middle of nowhere = ignore
Context determines significance
Common Candlestick Mistakes
Trading Every Pattern — Not all patterns are equal. Be selective.
Ignoring Trend — Fighting the trend with reversal patterns. Respect the trend.
No Confirmation — Entering on pattern alone. Wait for confirmation.
Wrong Timeframe — Trading 5-minute patterns. Use higher timeframes.
Forgetting Volume — Ignoring volume. Volume validates patterns.
Candlestick Pattern Cheat Sheet
Bullish Reversal:
Hammer
Bullish Engulfing
Morning Star
Piercing Pattern
Tweezer Bottom
Bearish Reversal:
Shooting Star
Bearish Engulfing
Evening Star
Dark Cloud Cover
Tweezer Top
Continuation:
Three White Soldiers (bullish)
Three Black Crows (bearish)
Marubozu (direction of candle)
Indecision:
Doji
Spinning Top
High Wave
Key Takeaways
Candlesticks reveal market psychology and battle between bulls and bears
Context (trend, S/R, volume) determines pattern significance
Always wait for confirmation before trading patterns
Higher timeframes produce more reliable patterns
AI can enhance pattern recognition but doesn't replace understanding
Your Turn
What's your favorite candlestick pattern?
Do you wait for confirmation or trade patterns immediately?
Have you noticed certain patterns working better in specific markets?
Share your candlestick experience below 👇

Patterns that shocks EVERYONEPatterns that shocks EVERYONE
I mean it a clear DOWNTREND target EYEING 24,800
Technicals used Harmonic Patterns, Chart Patterns & Price Action with Fibonacci Analysis
Lets see a good Week AHEAD

Unlock The Secret to Trading Breakouts Like a Pro!You can spend hours flipping charts like channels on late‑night TV… and still miss the one coin that actually moved.
So I stopped doing that and built myself a “setup screener”: a simple way to catch coins that are either compressing or already breaking out, from a defined list. Let me walk you through how I do it, step by step, in normal human language.
What I’m hunting
I only care about 2 states of the market:
1) Compression
Price is moving in a tight little box, candles are small, volatility dries up. Energy is loading. Think of a spring being pressed down.
2) Breakout
That spring finally snaps. Big candle, movement out of the box, volume wakes up.
My whole screener idea is: first, find springs being loaded. Second, find springs that are just starting to fire.
Step 1 – Start with a clean list
If your list is full of dead coins with no volume, every filter after that is useless.
So for your watchlist / screener, I usually:
- Keep only coins with decent volume (for example: today’s volume higher than average, or just visually pick the more traded pairs)
- Remove absolute garbage with no liquidity
You want things that can actually move without 5% slippage.
Step 2 – Catch compression (the “coils”)
Now I set up conditions that basically say: “Show me coins that are unusually quiet.”
You can approximate this with very simple stuff:
- Low volatility:
Range over the last day or few days is small in percent. For example, 24h range% is low compared to others.
- Small candles:
Average True Range (ATR) relative to price is small. In many screeners there’s a “Volatility” or ATR% filter, so I sort by the lowest.
- Flat structure:
Price is hanging around a moving average (like the 20 EMA), not trending far above or below it. When price hugs an MA, it’s often in “decision mode”.
What I do in practice:
I make one screener view called “Compression”.
There I sort by lowest volatility / ATR% and quickly scan the charts that show:
- Tight range
- Series of small candles
- Volume drying up a bit
That’s my watchlist of loaded springs.
Step 3 – Define the box
Once I see a compression on the chart, I manually mark the range:
- Recent high of the range
- Recent low of the range
It can be a small sideways channel or a triangle, doesn’t matter. I just need clear borders: above here = breakout up, below here = breakdown.
Step 4 – Catch the breakout
Now, from that same universe of coins, I want to see when something starts moving out of that box.
For that I use a second screener view called “Breakout”:
I look for:
- Daily / 4h change% suddenly above some threshold (for example, more than 3–5%)
- Volume waking up (today’s volume > previous day / previous average)
- Price trading near or above recent highs, not stuck in the middle of the range
You can:
- Sort by biggest % change among the coins that were quiet yesterday
- Or set alerts on your marked levels so you don’t even have to watch them all the time
The idea is simple: yesterday this coin was dead, today it’s the loudest kid in class.
How I use both together
Routine looks like this:
1) End of day / session
I run the “Compression” view, pick a few nicest coils, mark their levels.
2) Next sessions
I check the “Breakout” view or wait for alerts. When one of my quiet coins suddenly hits my level with increased move and volume – now I’m interested.
Maybe I’m wrong, but most beginners lose money not because they “don’t know analysis” but because they’re hunting random moves instead of repeating one clear setup over and over.
A setup screener is just a way to turn your favorite pattern into a radar.
Stop chasing everything. Decide: I trade compressions and breakouts. Then build your tools around that decision.
Let the tourists flip through all the charts. You’ll be sitting there, waiting for the spring to snap – and you’ll know exactly which coin to trade when it does.

Stop Trading Just The LinesPrice action reveals the intent of buyers and sellers. A pattern is only valid if it aligns with the market structure. You must look beyond the visual shape and understand why the price is moving that way.
A Wedge indicates that the market is coiling up. The highs and lows converge as volatility drops. This usually precedes a significant expansion in one direction.
Follow these rules for execution:
• Wait for the candle to close outside the range.
• Do not predict the direction early.
• Use the breakout as the trigger.
The Diamond structure represents a chaotic environment. It usually appears when a trend is exhausted. The price expands rapidly and then contracts again. This shows that neither side has control.
This is primarily a defensive signal. It is wise to close profitable trades here. Initiating new positions inside this zone is dangerous due to the lack of clear direction.
The Cup and Handle shows a period of accumulation. Large entities are buying assets without pushing the price up too fast. The handle forms as a final test of remaining supply.
Entering at the bottom is risky. The safest entry point occurs when the price clears the top of the handle. This proves that sellers are finished and the path is clear.
Harmonic trading relies on exact measurements rather than visual similarity. Patterns like the Gartley use Fibonacci ratios to define reversal zones.
This method requires strict discipline:
• Measure the legs with exact Fibonacci tools.
• Define the entry zone before the price arrives.
• Discard any setup that misses the specific ratio.
A breakout needs effort to be real. Volume represents the effort behind the move. If the price breaks a pattern on low activity, it is likely a false move.
Always zoom out to the higher timeframe. A pattern that aligns with the major trend has a much higher probability of success.
Which patterns do you rely on for your daily setups? Share your charts and experiences in the comments below.

JPY BASKET. HOW IT WORKSGoing through the video and having an understanding of how corelated pairs works. JPY BASKET helps to define the pair in the opposite like manner.

How to Spot Altseason: The Capital Rotation Relay ExplainedEvery bull run I get the same DM:
“When altseason bro?”
There is no magic altseason button. There is capital rotation. BTC → ETH → top alts. And the switch is visible right in the structure, if you know what to watch.
Forget indicators for a second. Just imagine the market as a relay race.
First runner: BTC
Second runner: ETH
Third runner: top alts (SOL, BNB, majors)
Then maybe the meme trash at the very end.
The trick is to see exactly when the baton changes hands.
How BTC structure looks when it’s “dominant”
- Clear higher highs and higher lows on daily
- Strong impulsive candles, shallow pullbacks
- BTC dominance making higher highs
- ETH and alts going up less or just chopping
In this phase, chasing alts is like trying to overtake a Ferrari on a bicycle. Funny, but painful.
Then the first switch: BTC → ETH
Here’s what usually happens in structure:
- BTC stops trending cleanly. You start seeing:
- Ranging at the top
- Fake breakouts
- First lower high on 4H or daily
At the same time ETH starts acting different:
- ETHUSD holds a higher low while BTC is retesting deeper
- ETH breaks its range high while BTC is still stuck
- ETHBTC (very important) breaks a downtrend or range to the upside
That ETHBTC chart is like the “who is boss now” chart.
If BTC is flat and ETHBTC is climbing - money is literally rotating into ETH.
Then the second switch: ETH → top alts
Replay the same logic:
- ETH has already had a good move, starts to range
- Wicks both sides, no clean follow through up
- ETHBTC cools off or starts forming lower highs
And suddenly top alts start showing life:
- After months of downtrend, you see first clear higher low on daily
- Break of structure: coin stops making lower lows and finally closes above the last lower high
- While BTC and ETH are moving sideways, some majors are quietly doing +10-20% days
That’s not “random pump”. That’s rotation.
My simple rule of thumb:
- BTC vertical - focus on BTC
- BTC ranging, ETHBTC strong - focus on ETH
- ETH ranging, majors breaking downtrends - scan top alts
Maybe I’m wrong, but I think “altseason” is just a lazy name for a very readable sequence: BTC runs, cools, ETH takes over, cools, majors take over.
Next time market is moving, don’t just stare at one chart. Put BTCUSD, ETHUSD, ETHBTC and 2-3 top alts side by side and literally ask:
“Who is making higher highs while others are sleeping?”
That’s usually where the baton is - and where the fresh money is flowing.

Conquer Market Psychology: Beat FOMO, Fear & Greed to Market psychology is the study of human emotions driving price movements – fear , greed , hope , and regret . Traders aren't battling the market; they're battling themselves. Mastering this turns losing streaks into consistent wins in Forex, Crypto, and Stocks.
Common Psychological Traps :
1- FOMO (Fear of Missing Out):
Jumping into trades because "everyone's winning" – leads to buying tops.
2- Fear & Panic Selling :
Dumping positions at lows due to short-term dips, missing recoveries.
3- Greed & Overstaying :
Holding winners too long, turning profits into losses.
4- Revenge Trading :
Chasing losses with bigger, riskier bets – recipe for account blowups.
Winning Strategies :
1- Build Discipline :
Stick to a trading plan: Pre-defined entries/exits, no exceptions.
2- Keep a Journal :
Log every trade: Why entered? Emotions? Lessons? Review weekly.
3- Use Mental Tools :
Set daily loss limits, take breaks, meditate to stay calm.
4- Focus on Process Over Profits :
Trade the setup, not the outcome – consistency beats one big win.
Real Examples Right Now (Feb 15, 2026)
Bitcoin BINANCE:BTCUSDT : Hovering around $70,000 – Recent rally sparked FOMO buys at peaks, but pullbacks test fear; smart traders waited for dips.
Pro Tips:
Visualize success daily to build confidence.
In volatile Crypto, shorten timeframes to avoid emotional swings.
Combine with tech analysis (e.g., RSI) to override gut feelings.
Remember : 90% of trading is mental – train your brain like a muscle!
Master your mind today and watch your trades transform!
What's your biggest psych challenge in trading? Share below! 👇
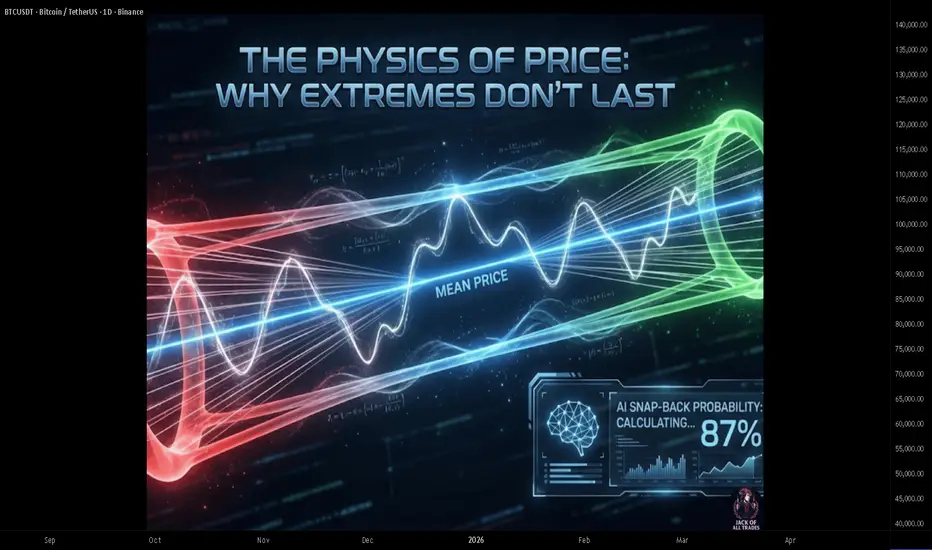
"The Physics of Price: Why Extremes Don't Last
Everything That Stretches Too Far Eventually Snaps Back
While trend followers chase momentum, mean reversion traders wait for the rubber band to stretch — then bet on the snap back.
This isn't about fighting trends. It's about understanding that extremes are temporary, and AI can identify exactly when the snap is most likely.
---
What Is Mean Reversion?
Definition:
Mean reversion is the theory that prices tend to return to their average over time.
The Core Idea:
Prices oscillate around a "fair value" or mean
Extreme deviations from the mean are temporary
The further price stretches, the stronger the pull back
The Physics Analogy:
Think of price as attached to a rubber band anchored at the mean. The further it stretches, the more tension builds, and the more likely it snaps back.
---
Why Mean Reversion Works
1. Market Overreaction
Humans overreact to news and events
Fear and greed push prices to extremes
Rational pricing eventually returns
2. Liquidity Dynamics
At extremes, one side is exhausted
Buyers depleted at tops, sellers at bottoms
Counter-pressure builds naturally
3. Arbitrage Forces
Extreme prices attract contrarian capital
Value buyers step in at lows
Profit-takers emerge at highs
4. Statistical Reality
Extreme readings are by definition rare
Probability favors return to normal
Standard deviation math supports this
---
Mean Reversion vs Trend Following
Trend Following:
"The trend is your friend"
Buy strength, sell weakness
Works in trending markets
Suffers in choppy markets
Mean Reversion:
"Extremes don't last"
Buy weakness, sell strength
Works in ranging markets
Suffers in strong trends
The Key Insight:
Neither is always right. The market alternates between trending and mean-reverting regimes. AI can help identify which regime you're in.
---
Measuring "The Mean"
Method 1: Simple Moving Average (SMA)
Average price over N periods.
Use: General trend center
Limitation: Lags price, equal weight to all periods
Method 2: Exponential Moving Average (EMA)
Weighted average favoring recent prices.
Use: More responsive mean
Limitation: Can be noisy
Method 3: VWAP (Volume-Weighted Average Price)
Average price weighted by volume.
Use: Institutional fair value reference
Limitation: Resets daily, intraday focus
Method 4: Regression Line
Statistical best-fit line through price.
Use: Trend-adjusted mean
Limitation: Requires more calculation
Method 5: Bollinger Band Middle
20-period SMA (typically).
Use: Standard mean reversion reference
Limitation: Fixed lookback period
---
Measuring "The Stretch"
Indicator 1: Bollinger Bands
Price distance from mean in standard deviations.
Signal:
Price at upper band = stretched high
Price at lower band = stretched low
2+ standard deviations = extreme
Indicator 2: RSI (Relative Strength Index)
Momentum oscillator measuring overbought/oversold.
Signal:
RSI > 70 = overbought (stretched high)
RSI < 30 = oversold (stretched low)
Extreme readings suggest reversion
Indicator 3: Z-Score
Statistical measure of deviation from mean.
Formula:
Z-Score = (Price - Mean) / Standard Deviation
Signal:
Z > 2 = significantly above mean
Z < -2 = significantly below mean
Indicator 4: Percent from Moving Average
Simple percentage distance from MA.
Signal:
Price 10%+ above MA = stretched
Price 10%+ below MA = stretched
Threshold varies by asset volatility
---
Mean Reversion Trading Strategies
Strategy 1: Bollinger Band Bounce
Setup:
Price touches or exceeds outer Bollinger Band
RSI confirms overbought/oversold
Volume shows exhaustion
Entry:
Enter counter-trend when price reverses from band
Confirmation candle required
Target:
Middle band (20 SMA)
Or opposite band for aggressive targets
Stop:
Beyond the extreme
ATR-based for volatility adjustment
---
Strategy 2: RSI Extreme Reversal
Setup:
RSI reaches extreme (below 20 or above 80)
Price at support/resistance
Divergence present (price makes new extreme, RSI doesn't)
Entry:
RSI crosses back above 30 (for longs)
RSI crosses back below 70 (for shorts)
Target:
RSI returns to 50 (neutral)
Or previous swing high/low
---
Strategy 3: VWAP Reversion (Intraday)
Setup:
Price significantly deviates from VWAP
Extended move without pullback
Volume declining on extension
Entry:
Fade the move back toward VWAP
Use lower timeframe for entry timing
Target:
VWAP touch
Or VWAP + small overshoot
---
Strategy 4: Z-Score Mean Reversion
Setup:
Calculate rolling Z-score (20-50 periods)
Z-score exceeds +2 or -2
Historical analysis shows reversion at this level
Entry:
Z-score begins declining from extreme
Confirmation of reversal
Target:
Z-score returns to 0 (mean)
Or Z-score reaches opposite threshold
---
How AI Enhances Mean Reversion
1. Regime Detection
AI identifies whether market is trending or mean-reverting:
Trending regime: Avoid mean reversion trades
Ranging regime: Mean reversion strategies activated
Transition detection: Adjust exposure
2. Dynamic Threshold Optimization
AI calculates optimal entry thresholds:
What Z-score level has best risk/reward?
How does this vary by asset and timeframe?
Adaptive thresholds based on recent volatility
3. Multi-Factor Confirmation
AI combines multiple mean reversion signals:
Bollinger Band + RSI + Volume
Weighted scoring system
Higher confidence when multiple factors align
4. Exit Optimization
AI determines optimal exit points:
Full reversion to mean vs partial
Time-based exits for failed reversions
Trailing stops for extended moves
5. Risk-Adjusted Sizing
AI adjusts position size based on:
Confidence level of signal
Current volatility
Correlation with existing positions
---
Mean Reversion Risks
Catching Falling Knives — "It's oversold" doesn't mean it can't go lower. Extreme can become more extreme. Wait for reversal confirmation, don't anticipate.
Fighting Strong Trends — Mean reversion fails in trending markets. What looks "stretched" in a trend is just the new normal. Identify regime before applying strategy.
The Mean Moves — The mean itself isn't static. In a downtrend, the mean is falling. Reverting to a falling mean still means lower prices.
Timing Difficulty — Being right about direction but wrong about timing. Position sizing and stop placement are critical.
Correlation Spikes — During market stress, everything becomes correlated. Multiple mean reversion positions can all fail together.
---
Mean Reversion Checklist
Before any mean reversion trade:
Is the market in a ranging/mean-reverting regime?
How extreme is the current deviation? (Z-score, BB, RSI)
Is there confirmation of reversal starting?
Where is the mean I'm targeting?
What's my stop if the extreme continues?
Is position size appropriate for the risk?
---
Combining Mean Reversion with Trend
The Hybrid Approach:
Identify the higher timeframe trend
Only take mean reversion trades in the trend direction
Use mean reversion for entry timing within the trend
Example:
Daily chart: Uptrend
4H chart: Price pulls back to oversold
Entry: Buy the oversold pullback in the uptrend
This combines trend following with mean reversion timing
---
Key Takeaways
Mean reversion exploits the tendency of prices to return to average
Works best in ranging markets, fails in strong trends
Measure deviation using Bollinger Bands, RSI, Z-score, or distance from MA
AI can identify regimes and optimize entry/exit thresholds
Always wait for reversal confirmation — don't catch falling knives
---
Your Turn
Do you use mean reversion strategies in your trading?
How do you determine when the market is ranging vs trending?
Share your approach below 👇
5-0 Harmonic Pattern:🚫 Stop entering trades without understanding technical analysis.
Before you risk your money, learn how the market actually speaks.
✨ We’re here to teach you the knowledge that turns randomness into strategy.
Unmasking the5-0 Harmonic Pattern:The Trend Reversal You Didn't See Coming**
Discovered by the visionary Scott Carney and unveiled in _Harmonic Trading, Volume Two_, the **5-0 pattern** isn't just another blip on a trader’s radar—it’s a siren of market reversal.
📈 **Why It Stands Out**
- Unlike the familiar Bat or Gartley structures, the 5-0 pattern is fueled by **precise Fibonacci ratios**, making its reversal zone deadly accurate.
- Centered around the pivotal **Point B**, this model doesn’t just hint at change—it defines it.
🌀 **The Anatomy of a Flip**
- Often marking the **first true pullback in a major trend reversal**, the 5-0 isn’t a lagging indicator—it’s your early warning system.
- The **AB leg?** That’s no ordinary wave—it’s usually the final gasp of a fading trend, setting the stage for powerful new momentum.
💥 **Bottom Line**
This isn’t just technical analysis—it’s strategic foresight. The 5-0 pattern reveals where the market **hesitates... and where you strike**.
---
_"To truly learn, we must see it in action.
So let’s pull back the curtain and share a powerful example from our **past insurance market trades**—a deal that blended precision, timing, and strategy.
In comments

Clear Portfolio Structure Matters More Than Market PredictionsOne of the most common mistakes investors make is believing that better predictions automatically lead to better results. In reality, markets remain uncertain regardless of how much data we consume. What often separates consistent investors from reactive ones is not forecasting ability, but portfolio structure and decision clarity.
Markets Don’t Reward Certainty - They Test Discipline
No matter how advanced analytics become, uncertainty remains a constant feature of financial markets. Prices move for reasons that are often only clear in hindsight. In this environment, relying too heavily on predictions can lead to overtrading, emotional positioning, and inconsistent risk exposure.
Experienced investors tend to shift their focus away from trying to predict every move and toward building portfolios that can function across different market regimes. Structure becomes the anchor when conviction is tested.
TradingView is full of signals, indicators, and short-term ideas. While these tools can be useful, they rarely replace a coherent framework. Without structure, even accurate signals can lead to poor outcomes if position sizing, timing, or risk alignment are unclear.
A structured portfolio approach helps transform insights into controlled action. It creates boundaries that limit emotional responses and supports consistency over time.
At its core, portfolio management is a decision system rather than a collection of trades. Allocation, diversification, and risk controls work together to reduce dependence on single outcomes.
This philosophy aligns with the approach taken by FinanceStPierre, where portfolio strategy is built around clarity, transparency, and long-term alignment rather than short-term speculation. By focusing on disciplined processes and adaptive strategy, the goal is to help clients move from insight to action without being overwhelmed by market noise.
Emotional risk is often underestimated. When portfolios lack structure, investors tend to react more strongly to volatility, news cycles, and short-term drawdowns. Clear allocation logic and predefined risk parameters reduce the need for constant intervention.
Clarity does not eliminate losses, but it helps investors understand why they occur and how they fit into the broader strategy. This perspective is essential for maintaining confidence during periods of uncertainty.
Modern markets reward speed, but long-term performance is built on patience and preparation. Investors who prioritize structure over prediction are better positioned to adapt without abandoning their strategy at the first sign of stress.
Portfolio clarity supports sustainable growth by keeping decisions grounded in process rather than impulse. It allows investors to evolve while remaining aligned with their objectives.
Predictions come and go, but structure remains. In an environment defined by volatility and constant information flow, the ability to maintain a clear and disciplined portfolio framework is a powerful advantage.
Markets will always be uncertain. The real question is whether your decision-making process is built to handle that uncertainty consistently.

The Secret Trading Strategy Smart Traders (CTR)📘 Candle Range Theory (CRT): How Smart Traders Use the Candle Itself to Control Risk and Profits
Most retail traders obsess over indicators, but smart money starts with the candle itself.
Candle Range Theory (CRT) is a price-action framework that treats a single impulsive candle as a complete trading map defining risk, targets, and profit management in one structure.
🔹 What Is Candle Range Theory?
CRT defines the full range of a strong expansion candle as a decision zone:
- CRT High: the high of the expansion candle
- CRT Low: the low of the expansion candle
This range represents where liquidity was taken and where commitment entered the market.
Once this candle prints, price reaction inside that range tells you whether continuation or distribution is more likely.
🔹 The Fifty Percent Rule: Where Smart Traders Reduce Risk
The midpoint (fifty percent) of the candle range is not random, it is a mean value zone.
Professional traders:
- Take partial profits at fifty percent
- Reduce exposure after the first reaction
- Let the remaining position run risk-free
Why?
Because markets often pause, react, or rotate around the midpoint before deciding the next leg. Locking partial profit here protects capital against false continuations.
🔹 The One Hundred Percent Rule: Where the Trade Is Complete
The full candle range (one hundred percent) is the logical final objective of the setup.
If price reaches:
- CRT High in a bullish scenario
- CRT Low in a bearish scenario
This is where:
- Liquidity objectives are fulfilled
- Expansion often stalls
- Full profit should be realized
Holding beyond this level without new structure is no longer trading, it becomes hoping.
🧠 Market Psychology Behind CRT
CRT works because it aligns with how liquidity moves:
- Expansion candles represent aggressive participation
- The midpoint attracts reaction and defense
- The full range completes order-flow objectives
Instead of predicting, CRT reacts to what price has already revealed.
✅ Why CRT Is Powerful
- No indicators
- No lag
- Built-in risk management
- Clear, objective profit rules
If you can read one candle correctly, you already have an edge.
🧩 Final Thought
CRT is not about finding more trades — it’s about managing the trade you already have like a professional.
Trade the range.
Respect the midpoint.
Exit at completion.
That’s how smart traders survive and grow.

Trading Gold Without a Stop Loss: A Slow Suicide1️⃣ No Stop Loss Is Not Courage
Many traders believe that trading gold without a Stop Loss shows confidence, toughness, or the ability to withstand volatility.
In reality, it often means the opposite.
Not using a Stop Loss usually comes from one simple reason: an unwillingness to admit being wrong. When price moves against the position, instead of accepting a controlled loss, traders choose to hold and convince themselves that gold will eventually come back.
The problem is that the market does not operate on personal belief.
Not having a Stop Loss does not make you stronger.
It only makes your mistakes harder to fix.
2️⃣ In Gold Trading, No Stop Loss Means No Brakes
XAUUSD is a high-volatility market that reacts aggressively to news and capital flows.
Price can move far and fast — sometimes within minutes.
Trading gold without a Stop Loss is like driving downhill without brakes.
At first, it may feel manageable.
But once momentum accelerates, you no longer have a choice.
Gold does not care where you entered.
And it will not stop just because your account is in pain.
3️⃣ A Trade Without a Stop Loss Rarely Kills You Instantly
The real danger is that it kills you slowly.
It starts with a small drawdown.
Then a deeper one.
Until you no longer have the emotional clarity to exit.
What began as a trade becomes:
- A holding position
- A hope trade
- A prayer trade
At that point, it is not just your account at risk — your discipline and mental control are already gone.
And once emotions take over decision-making, the outcome is usually inevitable.
4️⃣ Long-Term Traders Are Not the Ones Who Win the Most
They are the ones who lose with limits.
A Stop Loss is not there to be hit.
It exists so you always know:
- Where you are wrong
- How much you are willing to lose
- And whether you can come back tomorrow
In gold trading, a Stop Loss is not a personal preference.
It is the price of staying in the game.
Without it, sooner or later, the market will teach you this lesson — with real money.

Going over losing Trades!GBPUSD
RSI extrem to normal;
Failed to recognize shift in market strucutre;
No valid fib entry.
Distorted candles.
GBPAUD
Tricky fib - counter trend.
Cognitive biases,
mixing scalping with day trading and swing trading.

The Turtle Traders: Origins, Principles, and Key Lessons The Turtle Traders: Origins, Principles, and Key Lessons
In the history of financial markets, the Turtle Traders experiment stands as one of the most influential demonstrations that successful trading can be taught through discipline and a well-defined system, rather than relying solely on innate talent.
1. The Origin of the Turtle Traders
In the early 1980s, two legendary traders—Richard Dennis and William Eckhardt held opposing views on trading success:
- Richard Dennis believed that anyone could be trained to become a successful trader.
- William Eckhardt argued that trading ability was largely innate.
To settle the debate, they designed an experiment. They selected 23 individuals from diverse professional backgrounds, trained them using a single trading system, and allocated real capital for them to trade. These participants became known as the Turtle Traders.
Over approximately four years, the Turtles generated more than $100 million in profits, providing strong evidence that trading success is driven by systems and discipline rather than natural talent.
2. Core Principles of the Turtle Trading Strategy
The Turtle system is a trend-following strategy, primarily applied to commodities and currencies. It is built on several key principles:
2.1 Trend Following
The Turtles used Donchian Channels to identify breakout opportunities:
- Buy signal: Price breaks above the 20-day high
- Sell signal: Price breaks below the 20-day low
A longer-term 55-day breakout system was also used to capture major trends.
➡️ Core idea: Do not predict the market—react only when a trend is confirmed.
2.2 Strict Risk Management (The 2% Rule)
Each trade risked no more than 2% of total account equity.
- Market volatility was measured using N, defined as the 20-day Average True Range (ATR).
- Position size was calculated as: (2% of account equity) ÷ N
➡️ This ensured position sizing automatically adjusted to market volatility.
2.3 Clearly Defined Stop Losses
- Every trade used a stop loss equal to 2N
- Positions were exited immediately if price moved against the trade by 2N
➡️ The objective was to cut losses quickly and keep them small.
2.4 Position Pyramiding
When a trade moved in their favor:
- The Turtles added to winning positions incrementally
- A maximum number of additions was strictly enforced
➡️ The philosophy: cut losses short and let profits run.
2.5 Market Diversification
Rather than focusing on a single instrument, the Turtles traded across a wide range of markets, including:
- Commodities
- Currencies
- Bonds
- Interest rate products
➡️ Diversification helped reduce risk and smooth long-term returns.
2.6 Exit Strategy and Scaling Out
The system employed multi-stage exits:
- Partial exit when price broke the 10-day high/low
- Full exit when price broke the 20-day high/low
➡️ This approach balanced profit protection with trend participation.
3. Results and Significance of the Experiment
The Turtle Traders experiment demonstrated that:
- A simple but consistent system can outperform in the long run
- Psychology, discipline, and risk control matter more than perfect entries
- Trading is not intuition-based it is a repeatable process that can be learned
4. Key Lessons for Modern Traders
From the Turtle strategy, traders can extract several enduring lessons:
- Always trade in the direction of the trend
- Define risk before entering every trade
- Accept small losses as a cost of doing business
- Allow winning trades to run
- Discipline outweighs strategy complexity
Conclusion
The Turtle Trading strategy is more than a trading system, it is a trading philosophy built on
simplicity, discipline, risk management, and consistency. In trading, a good strategy is only a prerequisite. Long-term success depends on the ability to execute that strategy consistently over time.
Master that, and you follow the same path as the legendary Turtle Traders. 🐢📈

Dow Theory — The Foundation of Trend Reading Every Trader Must MDow Theory — The Foundation of Trend Reading Every Trader Must Master
Most traders fail not because the market is random, but because they never truly understand how trends work. Dow Theory is not outdated theory. it is the core logic behind price structure that still governs every market today. If you can read structure, you don’t need predictions.
1. The Market Moves in Trends — Not Randomly
Price does not move randomly. What looks like chaos is actually organized behavior driven by collective psychology.
A trend exists when price consistently creates structure:
- Uptrend → Higher Highs (HH) + Higher Lows (HL)
- Downtrend → Lower Highs (LH) + Lower Lows (LL)
- Sideways → Price oscillates without expanding structure
As long as this structure remains intact, the trend is valid regardless of news, opinions, or emotions.
Structure > Narrative.
2. Every Trend Has Multiple Levels
One of the biggest mistakes traders make is confusing timeframe noise with trend reversal.
Dow Theory explains that markets move in three layers at the same time:
- Primary Trend – the dominant direction (weeks to months)
- Secondary Move – corrective phases against the main trend
- Minor Swings – short-term fluctuations and noise
Most losses happen when traders fight the primary trend while reacting emotionally to minor swings.
3. The Three Psychological Phases of a Trend
Trends don’t start or end suddenly. They evolve through three distinct phases:
1️⃣ Accumulation
- Smart money builds positions quietly
- Price moves sideways
- Volatility is low
- Public interest is minimal
2️⃣ Participation
- Structure becomes clear
- Breakouts occur
- Momentum expands
- This is where most trend-following profits are made
3️⃣ Distribution
- Late buyers enter emotionally
- Volatility increases
- Smart money exits into strength
- Understanding these phases helps traders avoid buying tops and selling bottoms.
4. Structure Is the Only Valid Trend Confirmation
Indicators do not define trends, structure does.
A trend is confirmed when:
- Price breaks structure in the trend direction
- Pullbacks respect prior swing levels
- Momentum resumes after corrections
If structure is not broken, there is no reversal only a correction.
This is why predicting tops and bottoms is one of the fastest ways to lose money.
5. Volume Confirms Direction, Not Timing
Volume does not tell you when to enter.
It tells you whether the move is real.
- Rising volume with the trend → confirmation
- Weak volume during pullbacks → healthy correction
- High volume against structure → warning signal
Price leads.
Volume confirms.
6. A Trend Continues Until Structure Breaks
This is the most ignored and most important rule of Dow Theory.
A trend does NOT end because:
- Price “already went too far”
- Indicators are overbought or oversold
- Social media says “the top is in”
A trend ends only when structure breaks and fails to recover.
How to Apply This in Real Trading
A simple, repeatable framework:
- Identify the dominant structure (HH/HL or LH/LL)
- Wait for a correction, not a reversal
- Enter only when structure resumes in trend direction
- Place stop-loss where structure becomes invalid
- Hold until the market changes structure
No prediction. No guessing.
Just reading what price is already telling you.
Final Thought
Most traders don’t lose because they lack indicators.
They lose because they don’t understand trend behavior.
When you stop predicting and start reading structure, the market becomes clear, calm, and repeatable.

Double Top Pattern – A Classic Bearish Reversal Structure📚 Double Top Pattern – A Classic Bearish Reversal Structure
The Double Top is one of the most widely recognized and reliable bearish reversal patterns in technical analysis. It typically forms after a well-established uptrend and reflects a gradual loss of bullish momentum as market control transitions from buyers to sellers. Understanding the structure, confirmation rules, and market logic behind the Double Top helps traders avoid false signals and improve overall trade accuracy.
🔍 Structural Components of the Double Top
The Double Top consists of three primary phases:
Phase One – First Top
- Price rallies strongly in line with the prevailing uptrend and forms the first peak, indicating dominant bullish momentum.
- A subsequent pullback creates a temporary low, which later serves as the neckline of the pattern.
Phase Two – Second Top
- Price attempts another upward push but fails to break above the first top.
- This failure signals weakening buying pressure and early signs of distribution by larger market participants.
Phase Three – Neckline Breakdow n
- The pattern is confirmed only when price breaks below the neckline.
- This breakdown marks a shift in market control from buyers to sellers and confirms the potential trend reversal.
⚠️ Important note:
Without a clear neckline break, a Double Top is not considered valid.
📉 Market Meaning Behind the Pattern
From a price behavior perspective, the Double Top indicates:
- Diminishing bullish momentum after the second top
- Buyers losing the ability to push price higher
- Sellers gradually stepping in
- A confirmed neckline break signaling a trend reversal
When formed after a clear uptrend, the Double Top is considered a high-probability bearish reversal pattern.
✅ Conditions for a High-Quality Double Top
To improve reliability, the following conditions should ideally be present:
✔️ A clearly defined prior uptrend
✔️ Both tops are approximately equal in height
✔️ Volume is higher on the first top and lower on the second
✔️ Strong bearish candles or volume expansion during the neckline break
🛠️ How to Trade the Double Top
🔴 Sell Entry
The safest approach is to:
Wait for a confirmed neckline break
Enter a SELL on the retest of the neckline
This method reduces the risk of false breakdowns and improves the risk-to-reward profile.
❌ Stop Loss
Place the stop loss above the second top (or above both tops)
The stop should remain outside the structure to avoid liquidity sweeps
🎯 Take Profit
To estimate the target:
Measure the distance from the top to the neckline
Project that same distance downward from the neckline break
⚠️ Common Mistakes to Avoid
❌ Selling simply because a second top forms
❌ Ignoring neckline confirmation
❌ Trading without volume or candle validation
❌ Using the pattern in isolation without confluence
📌 Pro Tip for Higher Accuracy
For higher-probability setups, combine the Double Top with:
- RSI divergence
- Fair Value Gaps (FVG)
- Trendlines
- Liquidity zones
A multi-confirmation approach significantly improves trade quality and consistency.
