"Tag, You're It: Understanding Forex Correlations in Simple TermForex correlation is like a game of tag. You know how when you're playing tag with your friends, you all run in different directions and some of you end up running together while others run in opposite directions? Well, in forex trading, currency pairs are like friends running around in different directions.
Sometimes, two currency pairs move in the same direction, like when you and your friend are both running towards the same goal. This is called a positive correlation. Other times, two currency pairs move in opposite directions, like when you and your friend are running in opposite directions. This is called a negative correlation.
Just like how you can tag your friend to switch positions, forex traders can use correlations to help them trade better. If two currency pairs have a positive correlation, a trader might buy one currency pair and sell the other, hoping to make a profit when both pairs go up. If two currency pairs have a negative correlation, a trader might buy one and sell the other to manage their risk.
Remember, just like in tag, the way currency pairs move around can change depending on what's going on. So traders need to keep an eye on the news and be ready to change their strategies if needed.
Harmonic Patterns

Learn the nicknames of common currency pairs
Sometimes when talking to other Forex traders you might hear a reference to a nickname that you don’t understand.
“I’m looking to long 10 lots in Cable, what are you thinking?”
“Hmm, have you taken a look at Fiber? Support looks like it might be breaking across the board.”
Wait, what? I thought we were talking Forex trading over here? Although It may seem strange at first, these are actually nicknames for different Forex currency pairs!
Let’s take a look at the two Forex currency pair nicknames that get used the most, Cable and Fiber.
GBP/USD – Cable:
Back in the mid-19th century, before the invention of satellites and fiber optics, the exchange rate between the British Pound Sterling (GBP) and the US Dollar (USD) was actually transmitted across the Atlantic Ocean via submarine CABLE.
EUR/USD – Fiber:
What about the brand spanking new Euro that was first introduced in only 1999? EUR/USD of course doesn’t quite have the same romantic history to draw upon that Cable does. So what do traders do? Well, being the funny bunch that they are, they’ve gone and simply ‘upgraded’ the old Cable to a state of the art Fibre Optic line. Hence the nickname Fibre!
Of course, there are many more Forex currency pair nicknames going around which we’ve listed for you here:
AUD/USD – Aussie
NZD/USD – Kiwi
USD/CHF – Swissy
USD/CAD – Loonie
GBP/JPY – Guppy
EUR/JPY – Yuppy
EUR/GBP – Chunnel
Was that article insightful? Let us know in a comment section!
Hey traders, let me know what subject do you want to dive in in the next post?

TommyXAU Educational - What i mean by clean rangeGood afternoon gold gang, hope you're having a good weekend.
I thought id hop on to share with you a piece of information of what i mean by clean range. Ok ..
Say you have 2 key levels in price .. we have had a big news event causing a big red candle to the left hand side. This has left what is called an imbalance. An imbalance is where the wicks of the previous and after candle don't meet. Backtest that one yourself and see how many times these imbalances get filled.
Price is coming back up and closes above the key level .. it is now a high probability that price will come up and fill that imbalance and the clean range.
I call it clean as there is no traffic or hurdles that should stop price on its way up. Again, adding to the probability.
Simple as that really guys ..
Please leave a like if it was of any help to you and ill see you this evening for market open!
TommyXAU

Wealth Unleashed: Wedge Pattern Power - Hidden Gem Revealed!Introduction : Are you looking to skyrocket your trading profits? Look no further! Today, we will uncover the hidden gem of trading patterns: the Wedge Pattern. This powerful tool has the potential to transform your trading strategy and help you achieve financial success. Let's dive into the world of wedge patterns and explore how you can capitalize on their power.
What are Wedge Patterns?
Wedge patterns are popular among traders due to their high probability of forecasting trend reversals. These patterns appear when the price of an asset consolidates between converging support and resistance lines. There are two primary types of wedge patterns: the rising wedge and the falling wedge.
Rising Wedge:
In an upward trend, the rising wedge is considered a bearish pattern. It forms when the price consolidates between an upward-sloping support line and an upward-sloping resistance line that are converging. As the price approaches the apex of the wedge, the upward momentum weakens, signaling a potential trend reversal to the downside.
Falling Wedge:
Contrary to the rising wedge, the falling wedge is a bullish pattern. It appears in a downward trend when the price consolidates between a downward-sloping support line and a downward-sloping resistance line that are converging. As the price nears the apex of the wedge, the downward momentum loses strength, indicating a possible trend reversal to the upside.
Trading Strategies:
To capitalize on the power of wedge patterns, follow these steps:
✅Identify the pattern: Observe the chart for converging support and resistance lines to spot a rising or falling wedge pattern.
✅Confirmation: Wait for a breakout from the wedge pattern, either above the resistance line (for falling wedges) or below the support line (for rising wedges).
✅Entry point: Open a long position after a breakout above the resistance line in a falling wedge, or a short position after a breakout below the support line in a rising wedge.
✅Stop-loss and take-profit: Set your stop-loss order below the breakout level (for falling wedges) or above the breakout level (for rising wedges). Establish your take-profit target at a level that aligns with your risk-reward ratio and trading plan.
Conclusion:
The wedge pattern is a hidden gem that can potentially boost your trading profits when used correctly. By mastering the art of identifying and trading wedge patterns, you can strengthen your technical analysis skills and increase your chances of success in the market. Remember, no single tool guarantees success, so always use additional technical indicators and maintain a disciplined approach to risk management. Happy trading!

Strategy 5: The Fib extension method
• When price breaks a trendline and begins to move to 0.5 fib level,
• The inability of price to go beyond the 0.5 level is an opportunity to take a trade
• Enter a trade at 0.5 and close at extension of -0.27

Boycott? Or the end of a hegemony?-We are seeing in the news the movements of some important countries in relation to the “boycott” of the dollar in their commercial transactions. Countries like Brazil, China and India can start doing business with each other in their respective currencies.
-Here are some questions that need to be answered:
a) Who is this type of arrangement good for? For the strongest or the weakest?
b) Will the country that adopts this attitude of trading in its own currency actually benefit? And if the answer is yes, for how long? Short, medium or long term?
-Perhaps the answer is in the text below, in the brief summary where I explore the birth and rise of the dollar!
THE BIRTH OF THE DOLLAR, A BRIEF SUMMARY
-The US dollar was created as a monetary unit in 1792 after the United States Congress used the “Act of Currency” as a reference.
-Before the creation of the dollar, commercial transactions were mostly made through the “Real de a Ocho”, a currency minted by the Spanish Empire and which “dominated” the region.
-With the dominance of the Real de a Ocho currency in local commerce, the Currency Act was created by the British Empire in 1764 to prohibit the American colonies from minting money, or, from trading with the “Spanish” currency, in order to protect the English creditors and merchants from being paid in depreciated coins.
HOW DOLLAR EMERGED AMONG OTHER CURRENCIES?
-The role of the dollar today began after the end of the Second World War, which took place between 1939 and 1945, where the USA, accompanied by its allies, achieved victory. This marked the US as the main power at the time, as Europe was completely devastated.
-As the main economy of the post-War, the “assistance” of the USA in the “reconstruction” of the destroyed countries made the nation gain worldwide notoriety through its products and services. Therefore, the American currency began to be demanded in commercial transactions and gained more space on the world stage.
-Before the end of the war and with the aim of transforming the dollar into the only global trade currency, the US convened the Bretton Woods Conference in 1944. This conference brought together 45 nations to define the monetary bases of the international financial system and establish the currency Americana as a reference for other currencies and for international trade, linking the value of the dollar to gold. The World Bank and the IMF were also created at this conference.
-The “restoration” of Europe took place through US loans and aid programs, known as the “Marshal Plan”. However, with this “little help”, an important currency that dominated the commercial scenes before the dollar, the pound sterling, was replaced so quickly that England, as the largest creditor of the USA, became the largest debtor.
-A few decades after the end of the war and with the US “usurp” the other countries (offering products, “aid” and loans, which today China does with the poorest countries, “usurp”), maintaining this pattern was almost unsustainable and, soon, the Bretton Woods system came to an end, in 1971, when Richard Nixon unlinked the value of the dollar with that of gold, putting an end to the well-known “gold-dollar standard”.
-With the end of the gold-dollar standard in 1971, today we live under the “printers” standard. As the printers are almost limitless, if you're short of money just print a little more!
-Like what happened with the Bretton Woods system, becoming unsustainable to maintain it over time, will the dollar lose its hegemony due to the end of the gold-dollar standard?
-We know that with the gold standard the printing of money was regulated by the amount of gold in reserve, however, with the current standard we do not have a regulation on the amount of money that a country can print!
-Today, the ballast of a fiduciary currency is the people, who pay their taxes. I will use an extremely simplistic logic to try to explain in a “dumb” way how a country manages to generate more money.
-I will cite two examples of ways for a country to have more money available (print): 1) Increase its production of value-added products, increasing its exports, which increases its reserve of value; 2) Resorting to raising taxes, sacrificing your people to keep printing money!
-Do your analysis and good business.
-Be Aware, If You Buy, Use Stop Loss!
-See below for other graphic reviews!

3 driver pattern
• This is a reversal pattern and you can use it for a short or long position as long as you can identify it on either an inverted or normal chart
• The pattern is characterised by Higher low followed by a lower low and a deep dive that can be traded.
* You can allow the deep dive to play out completely before taking the reversal position
* Research more on the 3 driver pattern and the fib. levels.
twitter.com

Quasimodo Reversal Pattern 👨🏫EducationalHello guys, an educational post about Quasimodo or QM pattern.
Good luck.
If its useful please like it as a support and follow me for next analysis :)
.
salam be doostan ye post amoozeshi dar morede olgo QM, edame video be farsi ham toozih dadam.
moafagh bashid
like va follow faramoosh nashe :)

About patience in speculating and working on Leverage.Yesterday when I spoke about speculating a sell around $2026,00, that's what you're seeing happen.
A good profit, small exposure of my capital, and even with a leverage of 1:30, I am currently making a 27% TP ( my S/L position ) at the moment in 12 hours.
Have patience and discipline. Ask yourself: How long would that money take to grow that amount? We are talking about a single trade. in April three trades like this one were already possible (good profitability, low exposure. efficiency).
A nice weekend.
Bento

Easy-to-Spot Bullish Forex PatternsHi Traders, Investors and Speculators 📈📉
Ev here. Been trading crypto since 2017 and later got into stocks. I have 3 board exams on financial markets and studied economics from a top tier university for a year. Daytime job - Math Teacher. 👩🏫
For the biggest part, I prefer to trade reactive rather than predictive. Chart patterns really come in handy with this strategy. Here are my top easy to spot chart patterns, specifically focused on bullish chart patterns today. The green highlight dots are to help identify the margins of the pattern and the purple highlighted dot is where a long entry can be taken.
While you're here 👀 See this related idea on EURUSD from the monthly timeframe:
_______________________
📢Follow us here on TradingView for daily updates and trade ideas on crypto , stocks and commodities 💎Hit like & Follow 👍
We thank you for your support !
CryptoCheck

Top Pullback Trading StrategiesTop Pullback Trading Strategies
In this article, we will be discussing some of the most effective pullback trading strategies that can assist forex traders in identifying ideal entry points that align with the current trend. These strategies enable traders to take advantage of short-term price retracements, allowing them to navigate the volatile currency market with greater ease and profitability.
What is pullback trading?
Pullback trading refers to the practice of capitalizing on temporary price retracements or surges within an existing uptrend or downtrend in the forex market. These fluctuations in price typically occur over a brief period and do not interrupt the prevailing trend. Traders can leverage pullbacks by entering positions when the currency pair's price approaches its support or resistance level, enabling them to profit from upward or downward market movements.
Discover the Top Pullback Trading Strategies for Forex Traders
Moving Average Strategy
The Moving Average (MA) strategy is among the most widely used techniques for identifying pullbacks in an ongoing uptrend. This technical indicator calculates the average price of a currency pair over a specified timeframe and compares it with the present price to ascertain market behaviour.
In an uptrend, when the current price of the currency pair is significantly below its average price, it suggests that a short-term dip is likely to occur and provides a signal to enter long positions. Conversely, in a downtrend, if the current price of the currency pair is significantly above its average price, it implies that a short-term hike is probable, indicating the need to enter short positions to profit from a subsequent market downturn.
Trendline Strategy
Trendlines play a crucial role in identifying the direction of a trend in forex. Connecting three or more high or low price levels creates an uptrend or downtrend trendline, respectively. When trading pullbacks with trendlines, traders look for higher high price levels followed by higher low price levels, indicating a temporary dip in an ongoing uptrend. Alternatively, traders can enter short positions with trendlines showing lower low price levels followed by higher low price levels, signaling a temporary hike in an ongoing downtrend.
Traders can enter long or short positions with trendlines at the third, fourth, or fifth high or low price level, as these levels confirm the prevailing trend and signal the optimal entry point in the forex market.
Breakout Strategy
The Breakout strategy enables traders to enter the market immediately after currency pair prices reach their support or resistance level and subsequently move above or below it, respectively. Breakouts represent opposing movements to the prevailing trend, providing opportunities to enter the market during temporary reversals.
In an uptrend, when the currency pair price briefly touches its support level and contracts, a breakout signals a pullback in the trend, providing a signal to enter long positions and benefit from rising prices. Conversely, in a downtrend, when the currency pair price briefly touches its resistance level and expands, a breakout signals a pullback in the trend, providing a signal to enter short positions and benefit from falling prices.
Fibonacci Retracement Strategy
The Fibonacci Retracement strategy determines the optimal levels for entering the market during an uptrend or downtrend. Using Fibonacci levels, traders can identify the ideal support and resistance levels, based on which they can decide to long or short the market. This strategy utilizes Fibonacci retracement levels, which indicate how much currency pair prices are retracing before continuing in the prevailing trend direction.
During a downtrend, lower Fibonacci levels, such as 23.6% and 38.2%, suggest that the markets have not retraced significantly, enabling traders to identify the ideal resistance level (representing a temporary pullback hike) and signal short trades due to the expected continuation of the downtrend. Conversely, during an uptrend, higher Fibonacci levels, such as 61.8% or 78.6%, indicate that the markets have retraced extensively, helping to identify the ideal support level (representing a temporary pullback dip) and signal short trades due to the anticipated continuation of the uptrend.
Additionally, during an uptrend, lower Fibonacci levels like 23.6% and 38.2% suggest that prices are approaching the resistance level, which may break above this level, signaling traders to place long orders and benefit from the ongoing rising markets. On the other hand, during a downtrend, higher Fibonacci levels like 61.8% or 78.6% indicate that prices are approaching the support level, which may fall below the support level, signaling traders to place short orders and benefit from the ongoing falling markets.
Trade forex pullbacks and identify ideal entry prices
In forex trading, pullbacks can help traders pinpoint the optimal entry points for both long and short trades. By identifying temporary dips or hikes in currency pair prices during an existing uptrend or downtrend, traders can take advantage of short-term trading opportunities without missing out on potential profits.

reversal technical patterns overview part oneReversal Technical Patterns overview: Part One
Reversal patterns are frequently spotted at the end of the bear/bull market cycles. Here are some of the key patterns with higher probabilities. Can be applied to any market, including forex, crypto, stocks, indices and metals.
Double Bottom (Bulls)
Double Top (Bears)
🔸A double bottom pattern is a classic technical analysis charting formation showing a major change in trend from a prior down move. The double bottom pattern looks like the letter W.
🔸The double top is a type of chart pattern that is an indication that the prevailing trend may reverse, in the short or long term.
🔸The double top is a common occurrence towards the end of a bullish market. The price formation looks like two peaks that occur after one another.
🔸The double bottom formation typically occurs at the end of a downward trending or declining market.
🔸 The double bottom is similar to the double top, but the key difference between the two can be seen in the inverse or negative relationship in price.
Inverse Head and Shoulders (Bulls)
Head and Shoulders (Bears)
🔸The inverse head and shoulders pattern begins with a downtrend. This is the extended move down that eventually leads to exhaustion and a reversal higher as sellers exit and buyers step up. That downtrend is met by minor support, which forms the first shoulder. As the market begins to move higher, it bounces off strong resistance and the downtrend resumes. This resistance level forms the neckline.
🔸Pattern is defined by the head / left shoulder / right shoulder and neckline.
🔸The H*S pattern is a bearish market pattern will appear near market tops. The first shoulder forms after a significant bullish period in the market when the price rises and then declines into a trough. The head is then formed when the price increases again, creating a high peak above the level of the first shoulder formation. From this point, the price falls and creates the second shoulder, which is usually similar in appearance to the first shoulder.
🔸The pattern is completed, giving a market reversal signal, when the price declines again, breaking below the neckline. The neckline, as depicted above, is the horizontal line that connects the first two troughs to one another.
Three Drives (Bulls)
Three Drives (Bears)
🔸The three-drive is a rare price pattern formed by three consecutive symmetrical drives up or down. In its bullish form, the market is making three final drives to a bottom before an uptrend forms. In a bearish three-drive, it is peaking before the bears take over. A three-drive contains two overlapping ABCD patterns.
🔸There are multiple ways of trading a Three drives pattern:
You can trade the drive 3. Enter the market when you are sure that the market has formed the point B (buy in a bearish Three-Drive and sell in a bullish Three Drive).
You can trade when the entire pattern is complete.
🔸Extensions are always based on fibs, most of the time 1.27 and 1.62.
Falling Wedge (Bulls)
Rising Wedge (Bears)
🔸The falling wedge pattern is interpreted as both a bullish continuation and bullish reversal pattern which gives rise to some confusion in the identification of the pattern. Both scenarios contain different market conditions which must be taken into consideration.
🔸The Falling Wedge in the downtrend indicates a reversal to an uptrend. It is formed when the prices are making Lower Highs and Lower Lows compared to the previous price movements. It gives traders opportunities to take buy positions in the market.
🔸The rising wedge in an uptrend indicates reversal to the downtrend. It is formed when the prices are making Higher Highs and Higher Lows compared to the previous price movements. It gives traders opportunities to take short positions in the market
🔸Generally, traders will wait for a breakout before executing a trade on buy/sell side. Also traders may chose to wait for a re-test of the breakout area before executing a trade.

Importance of Price structure In summary, understanding and analyzing price structures is essential for successful trading. It allows traders to identify trends, manage risk, time their trades effectively, and develop winning strategies that align with market conditions.
Thanks for watching, make sure to leave your comment below, my next video will showcase how I plan to buy back Bitcoin.

Circle of Marketmarket movement not random. it was created. most of us as a retail unaware about that. and this is the circle of market. hope it can help you
you can see the circle on High Time Frame

FTX Discloses Significant Asset Shortfall in Company's PresentatAfter extensive efforts, the leader of FTX and FTX US has reported the discovery of billions of dollars in debt on both exchanges.
FTX US, a leading digital asset platform, has announced a total of $374 million in assets, with the majority of the sum held in associated accounts. This marks a significant increase in the platform's financial stability since its establishment. Additionally, FTX has reported positive results for its less liquid "Category B Assets", including its own FTX Token (FTT).
However, FTX wallets have a net borrowing of $9.3 billion from its sister trading firm, Alameda Research, with FTX US owing Alameda $107 million. This suggests an increasing financial connection between the two firms and may have important implications for the cryptocurrency industry.
Meanwhile, FTX Japan users have welcomed the news of the platform's ability to withdraw funds as an "escape" from the platform.
In terms of corporate leadership, John J. Ray III, the chief restructuring officer and CEO of FTX, has emphasized the company's commitment to transparency and public disclosure.
It has taken a huge effort to get this far. The exchanges' assets were highly commingled, and their books and records are incomplete and , in many Cases, totally absent.
In contrast, Nishad Singh, a former engineering director at FTX, has pleaded guilty to multiple counts of fraud in a US district court and now faces potential prison time and fines.
Finally, the US Justice Department is facing increased pressure as billionaire trader Sam Singh has filed a plea to halt the investigation into the cryptocurrency industry led by rival billionaire Mike Bankman-Fried, following news of several close associates agreeing to cooperate with prosecutors.
Note: This article was written by an independent author and does not represent the publisher's views.
If you find my content useful, please consider liking and sharing it.
Additionally, I encourage you to follow me for future real-time updates on the cryptocurrency market.
Thank you for your support.

The Essence of Trading Games1.The essence of trading games is constantly seeking the optimal strategy in a dynamic and changing environment.
2.The essence of trading is a group game. To trace it back, it is about constantly evaluating the amount and inclination of potential buyers outside the market, against the amount and inclination of chips held inside the market. Buy when the former is greater than the latter, and sell when the latter is greater than the former. The reasoning for buying inclination mostly comes from the effect of making profits, while the reasoning for selling inclination mostly comes from the effect of losing money. Then, combined with the overall market trend and the current hot spots, instant operational judgments are made. Operations are instantaneous while judgments are dynamic.
3.The essence of stock price movement is a game between holders and fund raisers. One should understand the motivations of both parties and position themselves on the active side. As the market sentiment shifts from limited downside to disappointment and exiting, the emotional part of the chips held inside the market gradually dissipates. At the same time, outside funds gradually accumulate. When the moment of market sentiment reversal arrives, funds will flock in, and this process will continue to repeat. If there are any regularities in the stock market, this process of emotional transformation is one of them and will not change greatly within the next thousand years.
4.During a strong market, the logic of buying stocks is that capital under the effect of making profits continuously enters the market, so the probability of selecting strong targets by later funds is high. Therefore, strong targets are chosen. During a weak market, the logic of buying stocks is that the spreading effect of losing money in the market leads to the continuous outflow of panic-selling. Thus, only a small amount of buying can push prices up. Therefore, buying at a low price is advisable.
5.Studying history provides insights into the rise and fall of things. This is also true for the stock market. Once the regularity of the rotation of past hotspots is grasped, the accuracy of natural expectations will improve.
6.If one understands the heart of the market, success will follow closely. If one's heart is controlled by the market, failure will persist.
7.Not all phenomena can be explained, but some have universal regularities. For example, the good timing for left-trading is after a continuous decline followed by a collective sharp decline. One should be particularly careful when there is a collective limit up after a continuous increase.

How to Understand Short-term TradingTo begin with, let's dampen the spirits of short-term enthusiasts who are new to the market. The success rate of purely candlestick chart technical analysis or chasing the leading stocks based on a simple "follow the trend" strategy is around 45%. This is akin to gambling at a casino in Macau and is likely to erode your capital.
Short-term trading is a comprehensive skill. Many people have spent a lot of time studying technical analysis, policy aspects, and fundamentals, but have failed to achieve success. Success comes with diligence, but it is also essential to know how to use a combination of approaches.
Those who are skilled at short-term trading should understand their own characteristics and find methods that suit them best.
When the timing is not ripe or the market is unfavorable, it is essential to face the risk rationally. When opportunities arise, go all out to seize them. Although this sentence is easy to understand, it is not easy to achieve. Many people tend to be eager to recover their losses when they lose money, repeatedly resisting risks and becoming numb to the stocks they are deeply trapped in when opportunities arise.
When the market's development and one's own judgment are inconsistent, it is necessary to re-examine the situation. The more critical the moment, the more crucial it is to handle it calmly. A stable mentality is the basis of short-term trading.
Short-term trading requires strong comprehensive qualities, including a calm and rational mentality, a good overall perspective, a sound trading system, and belief.
The position size of a skilled short-term trader is usually positively correlated with the overall trading volume of the market. When opportunities abound, trade frequently, and when opportunities are scarce, trade less.
Technical chart patterns are relatively secondary. The key is to grasp market sentiment, which is difficult to quantify without charts but can be deduced by intuition.
Apart from transaction volume, almost no other indicators are considered. Transaction volume is mainly used to observe changes in trading volume and combine them with price changes to deduce the changes in the sentiments of insiders and outsiders.
Specific technical details are not particularly important to individuals. Once you understand the general direction, there is no need to belabor the point. To put it in my own words, although short-term trading is being done, we are looking at a bigger picture.

Harmonic Patterns Crab And Deep Crab my point of viewA proper Crab pattern needs to fulfill the following three Fibonacci rules: AB= retrace between 0.382 – 0.618 Fibonacci Retracement of XA leg; BC= minimum 38.2% and maximum 88.6% Fibonacci retracement of AB leg; CD= Poses a target between 2.24 – 3.618 Fibonacci extension of AB leg or an ideal target of 1.618 of XA leg.
Crab Pattern
The XA retracement levels are checked to validate the retracement (here, pivot B forms just near 61.8%, barely making it to qualify for the Crab pattern
At point C, we notice the retracement falling within AB’s 88.2% – 38.2% zone
Eventually, price surges higher to reach to 161.8% Fibonacci extension of XA and fits within the 222.4% – 361.8% extension of the CD leg
Following the high, a short position could be taken, with stops at the high of CD, which marks the price reversal zone
The Deep Crab pattern
The Deep Crab pattern on the price chart differs from the Crab pattern on one main aspect, which is the swing point B.
While in a regular Crab pattern, the B retracement fits within 38.2% – 61.8%% retracement of XA, with the Deep Crab pattern the swing point B sits at the 88.6% retracement level of XA.

HOW TO PROPERLY USE FIBONACCI /fibonacci
retracements, extensions and projections
FIBONACCI PRICE RELATIONSHIPS
We start by running three different types of Fibonacci price relationships to find our trade Pattern.
These are retracements, extensions, and price projections or price objectives.
Each of these price relationships will be setting up potential support or potential resistance in the chart you are analyzing.
The definition of support is a price area below the current market where you will look for the possible termination of a decline and where you would consider being a buyer of whatever market you are
analyzing. You might be looking to buy at or around support either to initiate a new trade on the long side or to exit a short position if you think the support may hold and the market won’t decline any further.
The definition of resistance is a price area above the current market where you would look for the possible termination of a rally and consider being a seller.
You might be looking to sell at or around Resistance to initiate a new trade on the short side or to exit a long position if you think the resistance may hold and the market won’t go any higher.
Primary and derivative retracements ratios:
Fibonacci price retracements are run from a prior low-to high swing using the ratios 0.382, 0.50, 0.618, 0.786, 88.6 to identify possible support levels as the market pulls back from a high.
Retracements are also run from a prior high-to-low swing using these same ratios, looking for possible resistance as the market bounces from a low.
Most basic technical analysis packages will run the retracement levels for you when you choose the swing you want to run them from and select the proper Fibonacci price tool within the program you are using.
Tradingview provide such amazing tool.
Primary retracemets are 0.382, to 61.8 following by derivatives 786 and the 886.

When I take my trades Good evening gold gang, I hope you’re having a good weekend.
I thought I’d hop on to share with you the times of day i like to be at the charts. I like to make sure I’m sat down around the most volume, which is normally an hour before opens and the actual opens.
I use the sessions indicator to help identify the sessions for backtesting .. just search its name.
I’m back Monday for some more gold action .. hope to see you then.
Hit the like and follow along!
Tommy

Harmonic Bat Pattern for traders can apply on any time frameThe Bat is defined by the .886 retracement of move XA as Potential Reversal Zone. The Bat pattern has the following qualities:
Move AB should be the .382 or .500 retracement of move XA.
Move BC can be either .382 or .886 retracement of move AB.
If the retracement of move BC is .382 of move AB, then CD should be 1.618 extension of move BC. Consequently, if move BC is .886 of move AB, then CD should be 2.618 extension of move BC.
CD should be .886 retracement of move XA.

Harmonic Gartlay Pattern for traders can apply on any time frameThe “perfect” Gartley pattern has the following characteristics:
Move AB should be the .618 retracement of move XA.
Move BC should be either .382 or .886 retracement of move AB.
If the retracement of move BC is .382 of move AB, then CD should be 1.272 of move BC. Consequently, if move BC is .886 of move AB, then CD should extend 1.618 of move BC.
Move CD should be .786 retracement of move XA

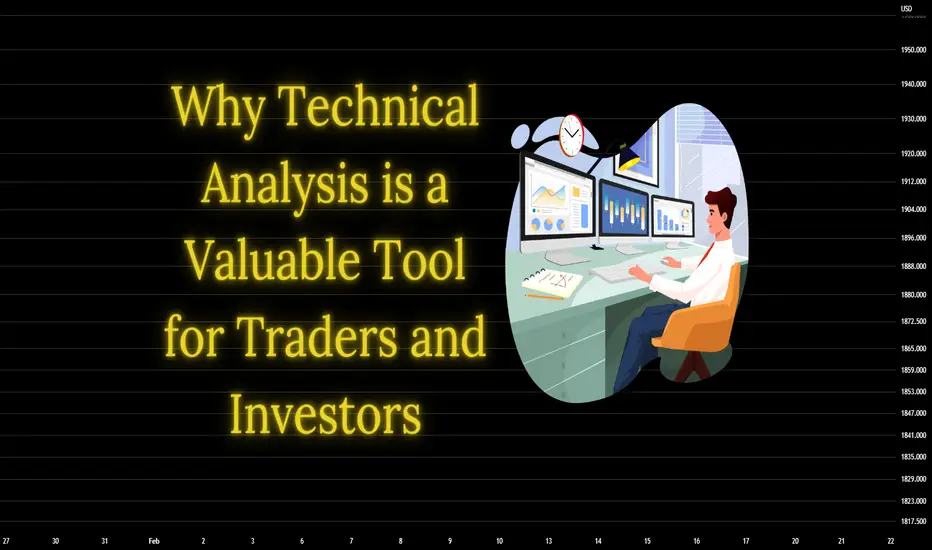
Why Technical Analysis is a Valuable Tool for TradersTechnical analysis is a popular method used by traders and investors to value securities and make informed decisions based on historical price and volume data. The approach involves using charts, graphs and other technical tools to analyze price movement and identify potential trends and patterns.
While there are different schools of thought on the effectiveness of technical analysis, there are several reasons to consider using this methodology as a tool for investing in financial markets.
1. It provides insight into market sentiment and trends.
Technical analysis provides investors with insight into market sentiment and trends. By analyzing historical prices and volumes, technical analysts can identify patterns and trends that can signal whether a security is overbought or oversold. This information can be useful for making informed decisions about market entry or exit.
For example, technical analysts can use moving averages, trend lines or other technical indicators to determine the overall trend of a security. If a security is in an uptrend, technical analysts may look for buying opportunities on dips or declines. Conversely, if a security is in a downtrend, they may look for opportunities to sell or short sell the security.
2. Helps identify key support and resistance levels.
Technical analysis helps investors identify key support and resistance levels in the market. Support and resistance levels are price points where the price of a security may experience buying or selling pressure. Identifying these levels can help investors make informed buying or selling decisions.
For example, if the price of a security is approaching a key resistance level, technical analysts can look for signs of an outbreak, where the price breaks through the resistance level and continues its upward movement. Conversely, if the price of a security is approaching a key support level, technical analysts may look for signs of a breakout as the price breaks through the support level and continues its downward movement.
3. It can be used in conjunction with other forms of analysis.
Technical analysis can be used in conjunction with other forms of analysis, such as fundamental analysis. Fundamental analysis involves analyzing a company's financial statements, industry trends and other economic indicators to determine its intrinsic value. Technical analysis can complement this approach by providing insight into securities' price movements and potential trends.
For example, if a fundamental analyst determines that a company's earnings are expected to increase significantly over the next year, a technical analyst can use charts and other technical tools to identify potential support and resistance levels, as well as key trend lines that can indicate whether the securities are in an upward or downward trend.
4. It helps manage risk.
Technical analysis can also help investors manage risk. By identifying key support and resistance levels, investors can set stop-loss orders to limit their potential losses if the price of a security moves against them. Technical analysis can also be used to identify potential trends and patterns that may indicate a change in market sentiment, allowing investors to adjust their positions accordingly.
For example, if a technical analyst identifies a potential double peak formation, where the price of a security reaches a high level twice and fails to break through it, he or she may look to sell, as this indicates a change in market sentiment from bullish to bearish.
5. Provides a common language for traders and investors.
Technical analysis provides a common language for traders and investors. By using charts, graphs and other technical tools, traders can communicate their ideas and strategies more effectively. This can be particularly useful in a fast-paced trading environment, where quick decision-making is crucial.
For example, if a trader identifies a potential breakout on a chart, he can communicate this to other traders using technical terms such as resistance, support and trendline. This allows traders to quickly understand the trader's strategy and potentially act on it if they agree with the analysis.
6. It offers a flexible approach to investing.
Technical analysis offers a flexible approach to investing. While fundamental analysis requires a deep understanding of a company's finances and industry trends, technical analysis can be used to analyze any security, including stocks, bonds, commodities and currencies. This makes it a valuable tool for traders and investors who want to diversify their portfolios and take advantage of market opportunities across asset classes.
Technical analysis also allows traders to adjust their strategies based on changing market conditions. For example, if the price of a security is volatile, technical analysts can adjust their stop-loss orders to limit potential losses if the price of the security moves against them. They can also adjust position sizes to take advantage of potential price fluctuations while managing their risk.
7. It can be used to trade short-term or long-term trends.
Technical analysis can be used to trade short-term or long-term trends. Short-term traders can use technical analysis to identify intraday trends and patterns, while long-term traders can use it to identify potential trends over several months or even years. This versatility allows investors to tailor their strategies to their investment goals and risk tolerance.
For example, a short-term trader may use technical analysis to identify potential investment opportunities within a day or a few hours. He or she may use indicators such as moving averages, oscillators and trendlines to identify potential entry and exit points based on the movement of securities prices.
On the other hand, a long-term trader may use technical analysis to identify potential trends over several months or years. He or she can use charts and other technical tools to identify key support and resistance levels and potential trend lines that can indicate whether a security is in an uptrend or downtrend. This information can prove useful in making informed decisions about market entry or exit.
In conclusion, technical analysis is a valuable tool for traders and investors who want to make informed decisions based on historical price and volume data. By providing insights into market sentiment and trends, identifying key support and resistance levels, and taking a flexible approach to investing, technical analysis can help traders manage risk, diversify their portfolios and take advantage of market opportunities across asset classes.
🚀 If you appreciate my work and effort put into this post, I encourage you to leave a like and follow on my profile. 🚀