5 Key Trading Tips for BeginnersWelcome back everyone to another post! In this article we will be explaining 5 key pointers (tips) for new individuals entering the trading space.
When it comes to trading first there is “ understanding ” before we begin the 5 keys steps. Let me assist you in understanding what will happen when you take on trading.
Trading is a challenge. Not a video game challenge, not a math test challenge – a * Challenge * One that will break you. Trading will break you mentally, physically, spiritually and financially. It is an eye-opening journey.
Trading will teach you a lot about yourself, and it will teach you a lot about discipline, patience and how you can analyze markets.
I saw a quote somewhere, it said trading: “ Trading is the hardest way, to make easy money ” and they are right.
You will be learning how to manage risk, control your emotions, understand your own decision-making patterns. These are all invaluable lessons for life, as well as trading.
Sounds great! But then there are the losses, what you lose to gain all this. Trading isn’t something that you can learn overnight – all those posts you see about a young 17-year-old “ cracking the code ” is rubbish. Why? Because they haven’t learnt life lessons.
You can make money fast, but you will lose it faster if you don’t know how to manage it.
Trading will drain every bit of energy out of you. You will feel like you’re falling behind, you will eventually collapse at every loss and become frustrated. The market will test you; the market doesn’t give a damn about you – you accept the risk when you take on trading and since you’re the one making the trades, it’s you VS you.
You’re testing yourself. You agree to test your patience, your confidence, your mindset. Doing so will make progress feel nonexistent or slow.
Every day, and every trade you will question yourself, wondering if “trading” is even for you. Sometimes it will feel like you’re going in circles. You will continue to make mistakes repeatedly. It will become exhausting but remember – only experience and your own strengths will allow you to succeed. Only those who can endure the grind without giving up will make it.
So, let’s start off the 5 key pointers that will prepare you.
1) Prioritize Risk Management Over Profits:
Most newbies focus first on “ making money ” rather than safeguarding capital. The reality is that surviving in the market is way more important than winning every trade you see or come across.
Key Points:
Determine risk per trade: A common rule is risking no more than 1-2% of your trading account on a single trade. This way even a string of losses will not wipe you out.
Always use stoploss: A defined maximum loss per trade enforces discipline and emotions to stay in check.
Position sizing: Your sizing should be proportional to what you’re willing to lose on each trade. Bigger trades amplify the losses, but they also amplify the profits.
Why it matters:
Without strong risk management, even a high win-rate strategy can fail. Protecting capital ensures you’re still in the game when opportunities arise.
2) Develop a trading plan and stick to it .
Random reactive trading is the best way to lose money. Build your plan overtime.
Key points:
Define your strategy: Building your strategy is the longest part, constant back testing and forward testing, refining and rebuilding. You’re not “switching” your strategy if you’re adding something small to it, you’re changing it if you eliminate the whole thing.
Identify your form of trades, short, mid, long term or swing trades.
Set clear rules: Don’t leave anything to chance, for example “I only enter trades if price closes above the 50ema and RSI is above 50”
Journalling trades: Ensure to journal all your trades, “How do I journal” Easy. Record the time, date, symbol, pair, what model/system you used, images, your entry, tp and exit, why and for how long you’ll have it open.
Why it matters:
Consistency is a key, it pairs with discipline, psychology and lingers with risk management. Traders who follow a disciplined system perform better than those to trade off an impulsive feeling. Other words “Gamble”
3) Master one market and one system first:
Beginners usually spread themselves too thin, trying forex, crypto, stocks and commodities all at once – Unfortunately for me I made this mistake at the start which made it very difficult! – Don’t do this. Stick to one market.
Key points:
Pick one market: Each market has its own rhythm, volatility, and liquidity. Teaching one thoroughly allows you to understand everything about it.
Focus on one system: Instead of trying every new system from you tubes or forums, master one approach and refine it onwards e.g. – you trade FVGs, Win rate is 50% once you add Fibonacci it might be e.g. 65%
Avoid information overload: Social media and trading forums are filled with conflicting advice, stick to your chosen approach and refine it. People say you need to have 12-hour trading days. If you do this, you will FAIL. You will grind yourself into the ground and face burnout making it very difficult to get back up again. Limit yourself to how much trading and trading study you do a day. Eg 10 back test trades, 3 real trades, 3 journaled trades, 1 hour of studying and researching the market.
Without strong risk management, even a high win-rate strategy can fail. Protecting capital ensures you’re still in the game when opportunities arise.
Why it matters
Depth beats breadth early on. Mastering a single market and system will allow you to build confidence and improve your edge.
4) Understand the Psychology of trading.
Trading isn’t just numbers: as mentioned in “understanding” it’s a test of emotional control, fear, greed and impatience.
Key points:
Emotions vs logic: ensure you recognize emotional reactions like FOMO (Fear of missing out) or revenge trading. Pause before reacting to a trade that will go against you.
Set realistic expectations : Markets move slowly. Sometimes for months, don’t expect huge gains overnight. Just like DCA focus on compounding. Compound your knowledge and skill set.
Mindset training: Techniques like medication and journaling as well as visualization can help reduce stress and maintain discipline.
Why it matters:
Even a diamond system can still fail if emotions drive your actions. Psychology often determines long term success, more than technical skill.
5) Prioritize learning. Then earning.
Beginners fall into the trap of trading being a “get rich quick” scheme. But the real investment is learning how the market works.
Key points:
Paper and demo trade first: Practice on demo accounts before you use real money – you will be surprised how many times you will fail. It’s better to fail with simulation money than your McDonalds weekly wage.
Review every trade: Analyze your losing trades, but also your winning trades. Find patterns and areas to improve.
Continuously educate yourself: Read books about the mind, about habits, watch market analysis but critically, apply what you learn and don’t just collect information and not use it.
Why it matters:
Earnings are just the byproduct trading. The faster you learn and adapt, the sooner your profits will appear. Treat early losses as tuition. Not failure.
Thank you all so much for reading.
I hope this benefits all those who are starting off their trading journey. If you have any questions, let me know in the comments below!
Harmonic Patterns

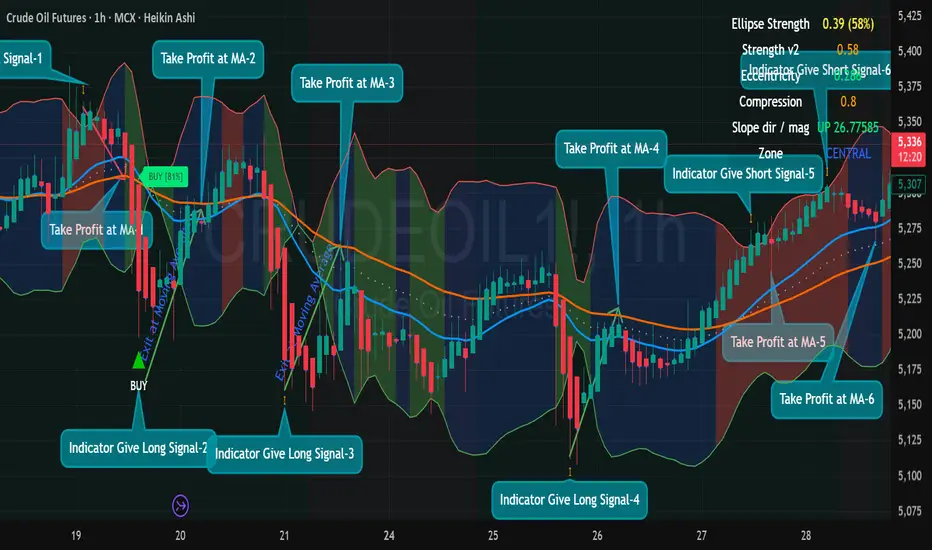
6 Back-to-Back Winning Trades Using Ellipse Price Action.6 Back-to-Back Winning Trades Using Ellipse Price Action Indicator (Crude Oil · 1H)
Ellipse Price Action Indicator captured 6 clean winning entries on MCX Crude Oil (1-Hour).
The system is simple:
✔ Indicator gives Buy/Sell Signal (Green/Red Triangle or Orange Arrow)
✔ Take entry only when price is outside the Ellipse boundary
✔ Exit strictly at the Moving Average (MA)
✔ Never trade in the middle zone or when price is sitting on the MA
✔ Follow stop loss at opposite side of the ellipse
Trade-by-Trade Breakdown
1.🔻 Signal-1 → Short Entry → WIN
Indicator gave Short Signal-1 at ellipse top
Price dropped smoothly
Take Profit at MA for Trade-1
✔ Clean reversal trade
2.🟢 Signal-2 → Long Entry → WIN
Oversold conditions + indicator gave Long Signal-2
Strong bounce from lower ellipse
Exit at Moving Average for trade-2
✔ System worked beautifully — TP hit immediately
3.🟢 Signal-3 → Long Entry → WIN
Price again touched lower ellipse
Indicator gave Long Signal-3
Clean breakout candle
Take Profit at MA for trade-3
✔ Another textbook reversal
4.🟢 Signal-4 → Long Entry → WIN
Third buying zone from ellipse bottom
Long Signal-4 triggered
Strong continuation move
Take Profit at MA for trade-4
✔ Perfect bounce-to-MA setup
5. 🔻 Signal-5 → Short Entry → WIN
Price rejected exactly at upper ellipse boundary
Indicator gave Short Signal-5
Trend followed down toward MA
Take Profit at MA for trade -5
✔ High-probability entry in sell zone
6. 🔻 Signal-6 → Short Entry → WIN
Compression high + overbought zone
Short Signal-6 activated
Smooth drop
Take Profit at MA for trade-6
✔ Final clean short as per system rules
4️⃣ BEST ENTRY ZONES
Long at Lower Ellipse Boundary
Short at Upper Ellipse Boundary
Avoid central zone completely
2️⃣ EXIT RULE (VERY IMPORTANT)
✔ Exit 100% of the trade at the Moving Average
This rule alone protects profits and avoids reversals.
5️⃣ RISK MANAGEMENT
0.5–1% risk per trade
Never add positions in the middle zone
Trade only clear signals with confirmed direction
🔥 Why This Indicator Works So Well
Your screenshot demonstrates:
✔ Automatic reversal detection
✔ Early trend shifts
✔ Compression + expansion zones
✔ Perfect MA exits
✔ No repainting structure
✔ High-probability entries at ellipse extremes
📌 FINAL POST CAPTION (Copy–Paste for TradingView)
"6 Winning Trades in a Row — Ellipse Price Action Indicator (Crude Oil 1H).
Buy/Sell Signals only at boundaries. Strict exit at MA.
Zero trades in middle zone → Zero noise → Maximum accuracy."
(Follow and Boost Script and Idea) MCX:CRUDEOILM1!
Global Trade Supply and Demand1. The Foundation of Global Supply and Demand
Supply in Global Trade
Global supply refers to how much of a particular good or service producers around the world can provide. Supply depends on:
Natural resources (oil, metals, agricultural land, minerals)
Industrial capacity (manufacturing plants, energy availability, labor force)
Technology and productivity (automation, robotics, digital infrastructure)
Cost efficiency (labor cost, taxation, energy cost)
Trade policies (tariffs, quotas, subsidies)
Geopolitical stability (war, sanctions, alliances)
For example:
Saudi Arabia influences global oil supply.
China dominates manufactured goods supply.
Brazil contributes heavily to agricultural supply.
Any disruption in these regions, such as war or drought, instantly affects global supply chains.
Demand in Global Trade
Global demand represents how much consumers, businesses, and governments worldwide want to purchase. Demand depends on:
Population growth
Income levels and economic growth
Consumer preferences
Technological adoption
Interest rates and inflation
Government spending
For instance:
Rising incomes in India increase global demand for electronics, oil, and automobiles.
The U.S. has high demand for consumer goods, creating massive trade flows from Asia.
Europe’s shift to green energy increases demand for lithium, cobalt, and rare earth metals.
2. How Global Trade Supply Meets Demand
The world is connected through supply chains, transportation networks, and financial systems. These create a structure where goods move efficiently from areas of high supply to areas of high demand.
Trade Routes and Logistics
Key supply–demand connections rely on:
Shipping lanes (Suez Canal, Panama Canal)
Rail networks (China–Europe rail corridors)
Air freight (high-value goods)
Digital trade platforms
Port infrastructure
When a major route is disrupted (e.g., Suez Canal blockade), supply delays cause global price spikes.
Global Value Chains (GVCs)
Most products today are not made in one country; they involve multiple supply chains:
iPhones: designed in the U.S., assembled in China, components from Japan, Korea, and Taiwan.
Automobiles: global sourcing of steel, electronics, engines, and software.
These interconnected systems allow nations to specialize in what they do best, optimizing global supply.
3. Imbalances Between Supply and Demand
Global trade often experiences gaps where supply does not match demand. These imbalances lead to price volatility and economic consequences.
Excess Supply
Occurs when production exceeds consumption:
Oil surpluses cause price crashes.
Overproduction of steel in China creates global price suppression.
Oversupply in agriculture reduces farmers’ income.
Excess Demand
Occurs when demand outstrips supply:
Semiconductor shortages (2020–2022) stopped automobile production.
High demand for housing materials during economic booms increases lumber and steel prices.
Increased energy consumption leads to shortages and higher fuel prices.
These imbalances often spark inflation, currency fluctuations, and government interventions.
4. Factors Influencing Global Supply and Demand
A. Economic Growth Cycles
During economic expansions, demand for commodities, raw materials, and manufactured goods increases. During recessions, global demand falls, pushing down prices.
B. Technological Changes
Automation, artificial intelligence, and digital tools reduce production cost, increasing supply capacity. Meanwhile, technology creates new demand sectors—electric vehicles, smartphones, green energy infrastructure.
C. Geopolitics
Wars, sanctions, and diplomatic tensions directly affect supply:
Russia–Ukraine war disrupted global grain and energy supply.
U.S.–China trade tensions impacted electronics and chip manufacturing.
Middle East conflicts threaten global oil supply routes.
D. Climate Change
Extreme weather disrupts agricultural supply, energy networks, and shipping infrastructure. Rising temperatures reduce crop yields, creating demand pressure for food imports.
E. Demographics and Urbanization
Countries with young populations (India, Africa) generate massive future demand. Aging societies (Japan, Europe) shift demand to healthcare and services rather than manufacturing goods.
5. Pricing Mechanism in Global Trade
Prices act as a bridge between supply and demand. When demand rises faster than supply, prices increase. When supply rises faster than demand, prices fall.
Commodity Prices
Oil, gold, natural gas, and metals are highly sensitive to global events. They are traded on international exchanges where prices adjust instantly.
Currency Influence
Exchange rates impact trade flows:
A weaker currency boosts exports (cheaper for foreign buyers).
A stronger currency increases imports (cheaper to buy from abroad).
Central banks indirectly shape global supply and demand through monetary policy.
Transportation and Freight Costs
Global freight rates significantly influence trade economics. For example, during the pandemic, container shipping prices rose nearly tenfold, affecting supply and causing inflation worldwide.
6. Global Supply Chain Disruptions
Modern trade depends on smooth logistics and political stability. Disruptions include:
Pandemics (COVID-19 halted production and shipping)
Natural disasters (Earthquakes in Japan disrupted electronics supply)
Strikes (Port strikes slow imports and exports)
Energy crises
Cyberattacks on infrastructure
Such disruptions create domino effects across industries and borders.
7. The Future of Global Supply and Demand
The global trade landscape is currently undergoing transformation. Several trends will shape the future:
A. Nearshoring and Friend-shoring
Companies are moving supply chains closer to home or to politically aligned countries to reduce risk.
B. Automation and Digital Trade
Robotics, 3D printing, and e-commerce reduce dependence on global labor and physical supply chains.
C. Renewable Energy Demand
The shift from fossil fuels to solar, wind, and electric mobility is increasing demand for lithium, nickel, copper, and rare earth metals.
D. Evolving Consumer Preferences
Sustainability, ethical sourcing, and climate-friendly production are becoming decisive factors.
E. Multipolar World Economy
Trade is shifting from U.S.–China dominance to a more diversified pattern involving India, ASEAN, Africa, and Latin America.
Conclusion
Global trade supply and demand form the backbone of the world economy. They determine how goods flow across nations, influence prices, shape geopolitical strategies, and affect the daily lives of billions. The interaction between how much countries can produce and how much the world wants to consume drives growth, development, technology, and innovation.
As globalization evolves, understanding global supply–demand dynamics becomes crucial for governments, businesses, traders, and consumers alike. The countries that manage supply efficiently and meet shifting global demand will remain dominant players in the world market.
The Role of the Bond Market in the Global Market1. Foundation for Government Financing
One of the primary roles of the bond market is enabling governments to finance their operations, budget deficits, infrastructure development, and long-term national projects. Every country—whether a developed economy like the United States or an emerging market like India—issues bonds to fund expenditures beyond tax revenues.
Government bonds, often considered “risk-free” in stable countries, act as the backbone of global capital markets. Investors such as pension funds, mutual funds, and central banks rely on government securities to preserve capital and earn predictable income.
The yield on government bonds also reflects investor confidence in a country’s fiscal health. Lower yields indicate strong trust and stability, while higher yields signal economic stress or higher default risk. Thus, government bond markets are constantly monitored to understand a country’s financial condition and borrowing costs.
2. Benchmark for Global Interest Rates
Bond markets serve as the benchmark for interest rates worldwide. The yield on government securities, especially U.S. Treasury bonds, influences borrowing costs for corporations, banks, and even consumers.
Central banks use bond yields as a key indicator when designing monetary policy. For example:
Falling yields usually signal a slowdown, prompting rate cuts or stimulus.
Rising yields indicate inflationary pressure, leading to tighter policy.
Interest rates on mortgages, car loans, business loans, and credit lines are often priced relative to government bond yields. This makes the bond market essential for determining the cost of money in the global economy.
3. Safe Haven During Uncertainty
During economic crises, geopolitical tensions, or stock-market volatility, investors often shift funds from riskier assets to safer ones—primarily government bonds of stable nations. This phenomenon, known as the “flight to safety,” underscores the role of bonds as a secure investment.
For example, U.S. Treasuries, German Bunds, and Japanese Government Bonds are considered safe-haven assets. When global uncertainty rises, prices of these bonds increase, and yields fall. This behaviour stabilizes global capital flows and reduces panic across markets.
4. Financing Corporate Expansion
The corporate bond market allows companies to raise large amounts of money without relying solely on bank loans. Corporations issue bonds to:
Expand manufacturing capacity
Finance mergers and acquisitions
Invest in technology
Refinance old debt
Support working capital
Compared to banks, the bond market offers companies access to a broader pool of capital at potentially lower interest rates. This helps drive global growth, innovation, and job creation.
Corporate bonds also come in different categories such as investment-grade and high-yield (junk bonds). Investment-grade bonds are safer and purchased mainly by institutional investors, while high-yield bonds offer higher returns in exchange for greater risk. The diversity of the bond market supports businesses of all sizes and risk profiles.
5. Critical for Global Asset Allocation
The bond market provides diversification for investors worldwide. Pension funds, insurance companies, and sovereign wealth funds rely heavily on bonds because they deliver steady income and reduce portfolio volatility.
A well-balanced portfolio often includes:
Government bonds for safety
Corporate bonds for higher returns
Municipal bonds for tax benefits
Emerging-market bonds for growth exposure
This mix stabilizes the global financial system and ensures long-term wealth preservation for millions of individuals whose retirement funds are invested in bond portfolios.
6. Influencing Currency Movements
Bond yields are closely linked to currency valuations. Countries with higher interest rates often attract foreign capital, strengthening their currency. Conversely, falling yields may weaken a currency as investors move funds elsewhere.
For example:
Rising U.S. Treasury yields usually strengthen the U.S. dollar.
Falling yields can result in dollar depreciation and capital outflows.
Currency traders therefore watch bond markets closely. Global trade balances, import/export competitiveness, and cross-border investments depend heavily on currency movements influenced by bond yields.
7. Indicator of Economic Health and Expectations
Bond markets are deeply sensitive to inflation expectations, growth trends, and central-bank actions. The shape of the yield curve—the relationship between short- and long-term bond yields—serves as a powerful predictor of economic conditions.
Normal yield curve: Indicates stable growth.
Flattened yield curve: Signals uncertainty or slowing expansion.
Inverted yield curve: Occurs when short-term yields exceed long-term yields; historically, a strong recession indicator.
Investors, policymakers, and economists use yield-curve patterns to forecast economic cycles. Hence, the bond market provides valuable information long before official economic data is released.
8. Supports Financial Stability and Liquidity
The bond market offers deep liquidity, allowing governments and institutions to borrow and invest efficiently. Bond markets run smoothly even during economic disruptions, ensuring continuous capital flow.
Moreover, bonds are widely used as collateral in financial transactions, including repo markets and derivatives. This makes them essential for maintaining liquidity in the banking system.
Central banks also use bonds in open-market operations to regulate money supply—buying bonds injects liquidity, while selling bonds absorbs excess liquidity. Without a functioning bond market, monetary policy would be ineffective.
9. Facilitating Global Trade and Investment
International investors often purchase sovereign and corporate bonds across borders to earn better returns or diversify geographically. Emerging markets, in particular, rely heavily on foreign investment in bonds to fund infrastructure and development.
Bond market integration also enables:
Cross-border investment flows
International trade financing
Global capital mobility
For instance, multinational corporations issue bonds in foreign currencies to access cheaper funding or hedge currency risks. This connects global markets and supports international commerce.
10. Stabilizing Retirement and Insurance Systems
Pension funds and insurance companies depend on predictable cash flows to meet future obligations. Bonds provide fixed income that aligns with long-term liabilities such as pensions, annuities, and insurance claims.
Stable bond markets therefore support public welfare systems, retirement planning, and financial security for millions of households.
Conclusion
The bond market plays an irreplaceable role in the global economic structure. It finances governments and corporations, influences interest rates and currency movements, acts as a safe haven during crises, guides monetary policy, and promotes financial stability. Its deep integration with global trade, investment flows, and retirement systems makes it one of the most vital components of modern finance. While often overshadowed by the stock market, the bond market silently powers the global economy, ensuring liquidity, stability, and long-term economic growth.
CPI Shock Across Countries: Global Price Alert1. Understanding CPI and Its Role in the Global Economy
CPI measures the change in prices paid by consumers for a basket of goods and services. It reflects inflation in categories like food, housing, fuel, transportation, medical care, education, and recreation. Central banks use CPI trends to decide interest rate policies.
High CPI (Inflation shock) → Prices rising quickly → Central banks may hike interest rates.
Low CPI (Deflation or disinflation shock) → Prices stabilizing or falling → Central banks may cut rates.
Because CPI affects interest rates, currencies, bond markets, and business sentiment, it has become a global indicator of economic stability.
2. Causes of CPI Shocks Across Countries
a. Supply Chain Disruptions
Breakdowns in supply networks—like those during the pandemic or geopolitical tensions—cause shortages and raise production costs. A disruption in one region can trigger ripple effects in several economies.
b. Commodity Price Surges
Oil, natural gas, metals, and food prices influence CPI worldwide. A spike in crude oil often pushes transportation and manufacturing costs up globally, causing inflation shocks in both developed and emerging markets.
c. Currency Depreciation
Weak local currencies make imports more expensive, leading to higher CPI. Emerging markets are more vulnerable to this because they rely heavily on imported goods, including fuel and raw materials.
d. Geopolitical Conflicts
Wars, sanctions, trade wars, and political instability can cause sudden CPI jumps. A conflict affecting key commodity regions (oil, grain, metals) can create global inflation alerts instantly.
e. Domestic Policy Changes
Tax hikes, subsidy cuts, or changes in minimum wages can lead to sudden CPI increases. Conversely, price controls or government intervention can temporarily keep CPI lower.
3. How CPI Shocks in Major Economies Affect the World
United States (US CPI Shock)
Because the US dollar is the world’s reserve currency, US CPI surprises have immediate global consequences.
A higher-than-expected US CPI typically strengthens the USD because investors expect rate hikes.
It reduces liquidity in global markets, causing capital outflows from emerging economies.
Risk assets like stocks fall as borrowing costs increase.
Eurozone (EU CPI Shock)
The Eurozone is a major import-export hub.
A CPI spike in Europe often pushes the European Central Bank (ECB) to tighten monetary policy.
This affects global bond yields and risk appetite, particularly in European-linked currencies such as GBP, CHF, SEK, and emerging European markets.
China (CPI and PPI Shocks)
China acts as the world’s factory.
A PPI (Producer Price Index) spike in China leads to higher global manufacturing and retail prices.
A CPI drop may signal weakening consumer demand, raising concerns about global growth.
India (CPI Shock)
India’s CPI is heavily influenced by food and fuel.
A high CPI can push the Reserve Bank of India (RBI) to increase interest rates, impacting emerging market bond yields and Asian currency flows.
As a major importer of crude oil, global energy changes impact India’s inflation outlook significantly.
Japan and the UK
Japan’s CPI shocks are rare due to its historically low inflation. A spike is often interpreted as structural economic change.
The UK, especially after Brexit, is vulnerable to energy and labor shortages, making CPI shocks a common occurrence that impacts global currency volatility.
4. Global Price Alerts: How CPI Data Triggers International Reactions
CPI shocks act as global price alerts—signals that drive immediate responses from central banks, financial markets, and businesses.
a. Central Bank Reactions
When CPI jumps unexpectedly:
Banks raise interest rates to curb demand.
Borrowing becomes expensive, slowing economic activity.
This synchronized tightening can lead to:
Global recession fears
Market sell-offs
Higher bond yields
Increased cost of capital
If CPI drops unexpectedly:
Banks may pause or cut rates.
Markets generally react positively, expecting lower borrowing costs.
b. Impact on Currencies
Currency traders react instantly to CPI data.
High CPI = stronger currency (rate hike expectations).
Low CPI = weaker currency (rate cut expectations).
This leads to volatility in USD/INR, EUR/USD, GBP/USD, USD/JPY, and other major pairs.
c. Global Equity Market Reaction
Stock markets are extremely sensitive to inflation data.
High CPI shocks → Sell-off in equities, especially rate-sensitive sectors like banking, IT, real estate, and consumer durables.
Low CPI → Rally in equity markets as liquidity expectations improve.
d. Commodity Market Sensitivity
Commodity traders use CPI as a demand-supply predictor.
High CPI = higher commodity prices, especially gold (as a hedge), oil, natural gas, and metals.
CPI shocks in commodity-exporting countries (Australia, Canada, Brazil) can influence global supply conditions.
5. Cross-Country Effects: How CPI Shocks Spread Globally
a. Through Trade
Countries dependent on imports feel inflation faster.
Example: A CPI shock in the US leading to rate hikes strengthens the USD and makes imports expensive for countries with weaker currencies.
b. Through Financial Markets
Global funds reallocate capital based on CPI trends.
High CPI in developed markets pulls money away from emerging markets.
Result: Currency depreciation and imported inflation in developing nations.
c. Through Commodity Prices
Oil, gas, and grain prices are extremely sensitive to inflation shocks.
CPI shocks in major consuming economies influence global demand expectations, altering prices worldwide.
6. Why CPI Shocks Are Becoming More Frequent
Increased geopolitical tensions
Volatile commodity markets
Rapid monetary policy cycles
Globalized supply chains vulnerable to disruptions
Domestic policy shifts and election cycles
The world is experiencing more frequent inflation surprises due to overlapping economic pressures.
7. Global Preparedness: How Countries Manage CPI Shocks
a. Strategic Reserves
Countries maintain reserves of oil, food, and critical minerals to stabilize prices during shocks.
b. Monetary Policy Tools
Interest rate adjustments, open market operations, and liquidity injections help manage inflation pressures.
c. Trade Diversification
Nations diversify import sources to reduce dependency and inflation vulnerability.
d. Commodity Hedging
Companies and governments hedge fuel and commodity risk in futures markets to mitigate price volatility.
Conclusion
CPI shocks across countries have become one of the most important global economic indicators. In an interconnected world, inflation no longer stays confined within borders. Every CPI release acts as a global price alert—shaping expectations, influencing policy decisions, moving markets, and guiding investors. As supply chains evolve, geopolitical tensions rise, and economic cycles shorten, CPI shocks will continue to play a defining role in global market behavior.

Forex Trading Options1. What Are Forex Options?
A forex option is a derivative contract whose value is derived from an underlying currency pair such as EUR/USD, GBP/INR, USD/JPY, or AUD/USD. The buyer of a forex option pays a premium to the seller (writer) in exchange for the right—not the obligation—to buy or sell the currency pair at a predefined price, known as the strike price.
Options help traders manage risk, hedge exposures, and take advantage of directional or non-directional forecasts about the forex market. Because global currencies constantly fluctuate due to interest rates, inflation, monetary policies, geopolitical factors, and macroeconomic data, options give traders flexibility and control over how much they stand to lose or gain.
2. Types of Forex Options
Forex options are broadly divided into two categories: vanilla options and exotic options.
a) Vanilla Options
These are the most basic and widely used options. They come in two forms:
Call Option
A call option gives the buyer the right to buy a currency pair at the strike price.
Example:
Buying a EUR/USD call at 1.0800 means you profit if EUR/USD rises above 1.0800 before expiry.
Put Option
A put option gives the buyer the right to sell a currency pair at the strike price.
Example:
Buying a USD/JPY put at 150.00 means you profit if USD/JPY falls below 150.00.
Vanilla options are straightforward and behave similarly to stock options.
b) Exotic Options
Exotic forex options are complex instruments tailored for advanced hedging or speculative plays. Popular types include:
Binary (digital) options – payoff is fixed if a condition is met.
Barrier options (knock-in, knock-out) – activate or deactivate based on price movement.
Asian options – payoff depends on average price over a period.
Chooser options – allow the holder to choose later whether it is a call or put.
These options are commonly used by institutions rather than retail traders.
3. How Forex Options Work
To understand how options work in forex, you need to understand a few essential terms.
a) Strike Price
The pre-agreed price at which the currency can be bought or sold.
b) Premium
The cost of buying the option. It is non-refundable.
c) Expiry Date
The date when the option contract ends.
d) In-the-Money (ITM)
Option currently has intrinsic value.
e) Out-of-the-Money (OTM)
Option has no intrinsic value and expires worthless unless price moves.
f) At-the-Money (ATM)
Spot price equals the strike price.
4. Option Pricing – What Determines Premium?
The price (premium) of an option is influenced by multiple factors:
1. Spot Price
The current market price of the currency pair.
2. Strike Price
The closeness of the strike to the spot affects intrinsic value.
3. Implied Volatility (IV)
Higher volatility = higher premium.
Forex markets with instability or news events have high IV.
4. Time to Expiry
More time = more premium, since more time means more opportunity for the trade to become profitable.
5. Interest Rate Differentials
Different national interest rates influence currency pair forward values and options pricing.
6. Market Liquidity
Major pairs like EUR/USD have cheaper, more liquid options compared to exotic pairs like USD/TRY.
These factors combine via pricing models like the Garman-Kohlhagen model (a modification of Black-Scholes for forex).
5. Why Traders Use Forex Options
Forex options provide unique advantages not available in spot trading.
1. Limited Risk
The worst-case scenario for option buyers is losing only the premium.
2. Unlimited Upside (for Call Buyers)
If the currency skyrockets, the trader profits significantly.
3. Hedging Tool
Businesses hedge currency risk using options to protect against exchange rate fluctuations.
Example:
An Indian importer expecting to buy goods in USD may buy a USD/INR call option to lock in cost.
4. Flexible Strategies
Options can be combined in creative ways to profit from trending, stagnant, or volatile markets.
5. No Mandatory Execution
If the market goes opposite, the trader can simply let the option expire.
6. Popular Forex Option Trading Strategies
1. Long Call
Expect the currency pair to rise.
2. Long Put
Expect the currency pair to fall.
3. Straddle
Buy both a call and a put at the same strike.
Used when expecting high volatility.
4. Strangle
Cheaper version of a straddle; strikes are wider apart.
5. Bull Call Spread
Buy one call and sell a higher strike call.
Used when expecting moderate upside.
6. Bear Put Spread
Buy put at higher strike, sell put at lower strike.
Used when expecting moderate downside.
7. Protective Put
Used by investors holding forex futures or large spot exposures.
8. Risk Reversal
Combine a long call and a short put to express directional views at lower cost.
Each strategy serves a different market scenario—trend, range, or high-volatility environment.
7. Forex Options vs. Spot Forex Trading
Feature Forex Options Spot Forex
Risk Limited to premium Unlimited (stop-loss needed)
Flexibility Very flexible Less flexible
Cost Requires premium No upfront cost
Profit Potential Unlimited (calls) High but risky
Expiry Yes No expiry
Complexity High Simple
Options are ideal when uncertainty is high, while spot forex is better for immediate price speculation.
8. Risks Involved in Forex Options Trading
Despite protections, options are not risk-free:
1. Time Decay (Theta)
Options lose value as expiration approaches.
2. Complex Pricing
Requires understanding volatility and Greeks.
3. Low Liquidity on Minor Pairs
Wider spreads = less efficient execution.
4. Premium Cost
High volatility = expensive options.
5. Seller’s Risk
Option sellers can face unlimited losses.
Therefore, beginners should focus on buying options rather than writing them.
9. Who Should Trade Forex Options?
Forex options are suitable for:
Intermediate to advanced traders
Businesses hedging currency exposure
Investors wanting limited risk
Traders expecting volatility spikes during events (Fed policy, inflation, elections)
Swing and positional traders who want controlled leverage
Beginners should start with vanilla calls and puts before experimenting with complex structures.
10. Conclusion
Forex options are powerful instruments that provide flexibility, leverage, and limited risk potential. By understanding the mechanics of calls and puts, pricing factors, strategies, and risks, traders can use options to hedge against uncertainties or speculate on currency movements with precision. While more complex than spot trading, forex options offer sophisticated possibilities—especially in volatile global markets driven by economic data, central bank policies, geopolitical events, and macroeconomic trends. With proper knowledge and disciplined strategy, forex options can significantly enhance a trader’s toolkit and open new avenues for profitable trading.
Global Market ParticipantsIntroduction
Global financial markets are vast, interconnected systems where capital flows across borders in search of returns. These markets are populated by a diverse set of participants, each with unique objectives, strategies, and resources. Understanding the various players in these markets is essential for analyzing market dynamics, price movements, and risk management. Global market participants can range from individual retail investors to massive institutional investors and sovereign entities. Their interactions determine liquidity, volatility, and the overall efficiency of the markets.
Types of Global Market Participants
Global market participants can be broadly classified into several categories based on their size, purpose, and behavior in the market. These include retail investors, institutional investors, hedge funds, sovereign wealth funds, central banks, commercial banks, investment banks, and market intermediaries. Each plays a distinct role in the global financial ecosystem.
1. Retail Investors
Retail investors, often referred to as individual investors, are non-professional market participants who invest their personal funds in various financial instruments such as stocks, bonds, mutual funds, and derivatives. Their primary motivation is wealth accumulation, retirement planning, or speculation. While retail investors are generally smaller in scale compared to institutional players, collectively they contribute significantly to market liquidity and price formation.
Behaviorally, retail investors are often influenced by psychological factors such as herd mentality, fear, and greed, leading to volatile trading patterns. They tend to follow trends or news-driven movements rather than fundamental analysis, making them more reactive than proactive in market participation.
2. Institutional Investors
Institutional investors include pension funds, insurance companies, mutual funds, endowments, and large asset management firms. These participants manage large pools of capital on behalf of their clients or beneficiaries and are typically focused on long-term investment objectives. Institutional investors influence market pricing and liquidity due to the size of their transactions, which can be in millions or even billions of dollars.
They utilize sophisticated investment strategies, including quantitative analysis, algorithmic trading, and risk management models. Unlike retail investors, institutional investors tend to focus on fundamentals, macroeconomic trends, and corporate earnings to drive their investment decisions. Their presence in the market ensures stability to some extent, though their large trades can also create temporary volatility.
3. Hedge Funds
Hedge funds are private investment partnerships that employ aggressive and often complex strategies to achieve high returns. They invest in equities, derivatives, commodities, currencies, and alternative assets. Hedge funds differentiate themselves from traditional institutional investors through their use of leverage, short selling, arbitrage, and high-frequency trading.
These funds are highly influential in global markets due to their capacity to move prices with large trades, exploit inefficiencies, and engage in speculative activities. Hedge funds often operate with shorter time horizons and are more willing to take concentrated risks compared to pension funds or mutual funds. Their trading strategies can impact liquidity, volatility, and market sentiment, particularly in niche or less liquid markets.
4. Sovereign Wealth Funds (SWFs)
Sovereign wealth funds are government-owned investment vehicles that manage the surplus wealth of a nation, typically derived from foreign reserves, commodity exports, or budget surpluses. Examples include Norway’s Government Pension Fund Global and the Abu Dhabi Investment Authority. SWFs are long-term investors focused on preserving national wealth while achieving sustainable returns.
These funds invest across asset classes globally, including equities, bonds, real estate, infrastructure, and private equity. Their significant capital allows them to influence global financial markets, attract co-investors, and stabilize capital flows during economic uncertainty. Unlike hedge funds, SWFs are not primarily driven by short-term gains; their strategy emphasizes long-term growth and stability.
5. Central Banks
Central banks, such as the U.S. Federal Reserve, European Central Bank, and Bank of Japan, are regulatory institutions responsible for managing a nation’s monetary policy and financial stability. Central banks are critical participants in global currency, bond, and interbank markets.
Their interventions, such as adjusting interest rates, conducting open market operations, or engaging in quantitative easing, directly influence liquidity, currency valuations, and risk premiums in financial markets. Central banks often act as market stabilizers, providing liquidity during crises and guiding macroeconomic expectations, making them pivotal in shaping global market trends.
6. Commercial Banks
Commercial banks play a dual role as financial intermediaries and market participants. They provide credit to corporations, governments, and individuals while also investing in securities and derivatives for proprietary trading or asset management. Their activities impact interest rates, credit spreads, and overall market liquidity.
Large international banks, like JPMorgan Chase or HSBC, participate in forex markets, capital markets, and global debt issuance. Their transactions, often in large volumes, affect market prices and liquidity conditions. Additionally, banks facilitate the flow of capital for other participants, making them central to market functioning.
7. Investment Banks
Investment banks serve corporations, governments, and institutions by providing advisory services for mergers, acquisitions, and capital raising. They underwrite securities, engage in trading and market-making, and offer structured products to clients.
Through underwriting and trading, investment banks influence asset prices, yield curves, and market sentiment. Their research departments also shape investor expectations and decisions by providing market analyses, forecasts, and strategic insights.
8. Market Intermediaries
Other participants include brokers, dealers, exchanges, and clearinghouses. Brokers facilitate transactions between buyers and sellers, while dealers trade on their own accounts, providing liquidity. Exchanges offer organized marketplaces with regulatory oversight, ensuring transparency, fair pricing, and efficiency. Clearinghouses mitigate counterparty risk, guaranteeing settlement and reducing systemic risk.
Although intermediaries may not be final investors, their role is essential in enabling seamless market operations and maintaining investor confidence.
Behavioral Dynamics of Market Participants
The interaction among global market participants is driven by diverse motives:
Speculation: Hedge funds and retail traders often engage in short-term profit-seeking activities.
Hedging: Corporations and institutional investors use derivatives to mitigate financial risks related to interest rates, currencies, or commodity prices.
Investment: Pension funds, SWFs, and insurance companies focus on long-term capital appreciation.
Policy Intervention: Central banks manage macroeconomic objectives through monetary policy tools.
These behaviors contribute to market liquidity, price discovery, and volatility. The balance between speculative and long-term investment behavior often determines the resilience or fragility of markets during stress periods.
Impact on Global Markets
The diverse activities of market participants collectively shape global financial markets. Large trades by institutional investors can move prices and influence market trends, while retail investors contribute to sentiment-driven volatility. Central banks and SWFs provide stability, while hedge funds exploit inefficiencies and enhance liquidity in certain sectors. Investment banks and intermediaries ensure markets function efficiently through research, advisory services, and trade facilitation.
During crises, the behavior of market participants can amplify or dampen shocks. For example, coordinated central bank actions can restore confidence, while mass liquidation by hedge funds or retail investors can exacerbate volatility. Understanding these participants’ roles helps analysts, policymakers, and investors navigate complex global markets.
Conclusion
Global market participants form a complex and interconnected ecosystem where diverse actors with varying objectives interact. Retail investors, institutional investors, hedge funds, sovereign wealth funds, central banks, and financial intermediaries collectively determine liquidity, volatility, and price formation in financial markets. Their behavior is influenced by economic trends, policy changes, technological advancements, and psychological factors.
A nuanced understanding of these participants is crucial for anyone seeking to navigate global financial markets successfully. Recognizing the motivations, strategies, and potential market impact of each participant allows investors and policymakers to anticipate market movements, manage risk, and make informed decisions in an increasingly interconnected global economy.
In essence, global market participants are the lifeblood of financial markets, and their coordinated and competitive interactions shape the dynamics of capital flows, investment opportunities, and financial stability worldwide.

The Impact of a Global Market Crash1. Economic Impact
The immediate economic consequences of a global market crash are often severe. Equity markets, commodity markets, and bond markets typically experience significant declines, undermining investor wealth and reducing consumer confidence. As stock prices plummet, households and businesses see a decline in their net worth, which can lead to reduced spending and investment. Since consumption and capital investment are core drivers of economic growth, the contraction in these areas can trigger a broader economic slowdown or even a recession.
A crash can also cause a tightening of credit conditions. Banks and financial institutions, facing losses on their investments and worried about counterparty risk, often become more risk-averse, reducing lending to businesses and consumers. This credit contraction further slows economic activity, as companies find it difficult to finance operations or expansion, and households struggle to secure loans for major purchases like homes and vehicles.
2. Impact on Financial Institutions
Financial institutions are directly impacted by a market crash, as the value of their holdings in equities, bonds, derivatives, and other financial instruments decline. Banks, hedge funds, insurance companies, and investment firms may incur massive losses, potentially leading to insolvency or bankruptcy. The interconnected nature of global finance means that the failure of one major institution can have a domino effect, threatening the stability of other financial entities. The 2008 global financial crisis exemplifies this, where the collapse of Lehman Brothers triggered panic across the banking sector and required coordinated government interventions.
Moreover, liquidity crises often accompany market crashes. When investors rush to sell assets, the markets may not have enough buyers, causing asset prices to fall even further. Financial institutions that rely on short-term funding or that have leveraged positions may find themselves unable to meet obligations, further exacerbating systemic risks.
3. Impact on Businesses
The effect of a global market crash extends beyond the financial sector into real-world business operations. Companies face declining stock prices, reduced access to capital, and a contraction in consumer demand. Many firms may be forced to delay expansion plans, cut costs, or lay off employees to preserve cash flow. Industries heavily reliant on discretionary spending, such as travel, luxury goods, and automobiles, are particularly vulnerable.
Global supply chains may also be disrupted. Firms may reduce production in response to decreased demand, which can create ripple effects across suppliers and manufacturers worldwide. Additionally, companies engaged in international trade may face currency volatility and reduced foreign investment, compounding the financial strain.
4. Impact on Governments and Fiscal Policy
Governments are not immune to the effects of a global market crash. Falling asset prices reduce tax revenues from capital gains, corporate profits, and wealth taxes. Lower revenues combined with increased public spending to stimulate the economy can strain government budgets and increase fiscal deficits. Governments may be forced to implement stimulus measures, such as interest rate cuts, quantitative easing, or direct fiscal support, to stabilize markets and prevent a deeper recession.
Central banks often play a critical role during a market crash, using monetary policy tools to provide liquidity, stabilize financial institutions, and encourage lending. However, prolonged crises may limit the effectiveness of these measures, especially if investor and consumer confidence remains low. Additionally, countries with high debt levels or weak economic fundamentals may face challenges in implementing effective countermeasures.
5. Impact on Investors and Households
Individual investors often experience significant financial losses during a global market crash. Retirement savings, investment portfolios, and other forms of personal wealth can erode rapidly, affecting long-term financial security. Panic selling is common, leading to further declines in asset prices. Investors with leveraged positions or exposure to high-risk assets may face margin calls or forced liquidation, amplifying losses.
Households may also experience indirect effects, such as rising unemployment, reduced wages, and limited access to credit. Economic uncertainty can lead to changes in consumption patterns, with families prioritizing essential spending and reducing discretionary expenditures. This reduction in consumption can feed back into the broader economic slowdown, creating a cycle of declining demand and increasing financial stress.
6. Global Trade and Investment
A market crash in one region can quickly spread to others due to globalization and financial interconnectedness. Capital flows may reverse, with foreign investors withdrawing from emerging markets to seek safety in developed economies, causing currency depreciation and financial instability in affected countries. International trade can decline as businesses postpone investment, and demand for imported goods falls. Cross-border investments and mergers may be canceled or delayed, reducing economic growth opportunities and increasing geopolitical tensions.
7. Psychological and Social Impact
Beyond tangible financial consequences, a global market crash can have significant psychological and social effects. Investor confidence and public sentiment often deteriorate, leading to fear-driven behavior in both markets and daily life. Anxiety about job security, savings, and retirement can influence consumer behavior, affecting spending and investment decisions. In severe cases, prolonged economic hardship can exacerbate social inequalities, trigger political unrest, and challenge social cohesion.
8. Long-Term Consequences and Recovery
The recovery from a global market crash can take months or even years, depending on the underlying causes and policy responses. Market crashes often prompt regulatory reforms aimed at strengthening financial systems and reducing systemic risks. For example, the 2008 financial crisis led to significant changes in banking regulation, risk management practices, and global oversight mechanisms.
However, repeated or prolonged market crashes can erode trust in financial institutions, government policy, and market mechanisms. Investors may become more risk-averse, reducing the flow of capital to businesses and slowing economic innovation. Long-term structural unemployment, reduced income growth, and increased debt burdens can persist well beyond the initial crash period.
9. Mitigation Strategies
While the effects of a global market crash are profound, there are strategies to mitigate risks and cushion the impact. Diversification of investment portfolios across asset classes, sectors, and geographies can reduce exposure to systemic shocks. Governments and central banks can implement preemptive regulatory and monetary measures to ensure liquidity and maintain financial stability. For businesses, maintaining strong balance sheets, prudent debt levels, and flexible operational strategies can enhance resilience.
Education and awareness are equally important. Investors who understand market cycles and maintain long-term investment perspectives are less likely to engage in panic selling, preserving wealth and contributing to overall market stability.
Conclusion
A global market crash is more than just a financial phenomenon—it is an economic, social, and psychological event with far-reaching consequences. From financial institutions to households, from governments to multinational corporations, the impact is pervasive, highlighting the interconnectedness of modern economies. While market crashes are inevitable over time due to economic cycles and external shocks, their severity and duration can be influenced by effective policy responses, prudent financial management, and a resilient global economic system. Understanding these impacts is crucial for investors, policymakers, and businesses alike, helping to navigate crises, protect wealth, and foster sustainable recovery.

Carry Trade Profits in the Global Market1. Fundamentals of Carry Trade
The carry trade is essentially a form of arbitrage. Traders exploit the differences in interest rates between countries to generate profit. Typically, investors borrow money in a currency considered “cheap” — usually from countries with low-interest rates like the Japanese yen (JPY) or the Swiss franc (CHF) — and convert it into a currency with higher interest rates, such as the Australian dollar (AUD), New Zealand dollar (NZD), or emerging market currencies like the Brazilian real (BRL) or Turkish lira (TRY).
The profitability of carry trades comes in two forms:
Interest Rate Differential (Carry): The primary profit is derived from the interest rate spread between the funding currency and the target currency. For instance, if an investor borrows 1 million JPY at an interest rate of 0.1% and invests in AUD at 5%, the net interest profit before costs is substantial, particularly on leveraged positions.
Currency Appreciation: In addition to the interest rate differential, carry trade profits can be enhanced if the higher-yielding currency appreciates against the funding currency. This combination of yield and potential capital gains makes carry trade highly attractive during periods of global economic stability and low volatility.
2. Mechanics of the Carry Trade
Carry trades are typically executed through foreign exchange (FX) markets. The process involves:
Funding Position: Borrowing a currency with low-interest rates, often through short-term instruments like FX swaps, forward contracts, or interbank loans.
Investment Position: Converting the borrowed funds into a higher-yielding currency and investing in instruments such as government bonds, corporate bonds, or high-interest savings accounts denominated in that currency.
Leverage Utilization: Many carry trades employ leverage to magnify returns. Borrowing multiple times the invested capital can substantially increase profits, though it also escalates risk.
The net profit is calculated as the difference between the earned interest and the cost of borrowing, adjusted for currency fluctuations and transaction costs.
3. Historical Context and Global Examples
Historically, carry trades gained prominence in the late 20th and early 21st centuries when global financial markets became increasingly integrated. The Japanese yen became the quintessential funding currency due to Japan’s long-standing low-interest-rate policies. For example, in the early 2000s, investors borrowed cheap yen to invest in Australian and New Zealand assets, reaping significant profits from both interest rate differentials and currency appreciation.
Emerging market currencies have also been frequent targets for carry trades. High yields in countries like Brazil, Mexico, and South Africa attracted global capital inflows, driving short-term currency strength. Similarly, during periods of monetary easing in developed economies, the differential widened, boosting carry trade attractiveness.
4. Profitability Drivers
Several factors determine carry trade profitability:
Interest Rate Differentials: Larger differentials increase potential returns. Central bank policies directly impact these spreads. For example, aggressive rate hikes in emerging markets can widen the gap with developed markets’ low rates, fueling carry trade activity.
Currency Stability: Stable currencies reduce the risk of adverse exchange rate movements, making the strategy more predictable.
Global Liquidity: Ample liquidity in global markets facilitates smooth execution of carry trades, lowering transaction costs.
Investor Sentiment and Risk Appetite: Carry trades tend to thrive in risk-on environments. Investors’ willingness to seek higher returns in emerging markets or higher-yield currencies directly influences profitability.
5. Risks Associated with Carry Trades
Despite their profitability, carry trades are inherently risky due to leverage and exposure to multiple market factors:
Currency Risk: A sudden depreciation of the target currency against the funding currency can quickly erase interest gains. For instance, if the Australian dollar falls against the yen, the initial investment converts back into fewer yen, causing losses.
Interest Rate Risk: Unexpected central bank decisions can reverse the interest rate advantage, reducing or eliminating carry trade profits.
Market Volatility: Financial crises or geopolitical events can trigger rapid unwinding of carry trades, leading to sharp losses. The 2008 global financial crisis exemplified this, as leveraged carry trades collapsed, causing massive currency swings.
Liquidity Risk: In times of market stress, exiting positions can be costly due to reduced liquidity, amplifying losses.
Professional traders mitigate these risks through hedging strategies, stop-loss orders, and diversification across multiple currency pairs and maturities.
6. Modern Developments in Carry Trades
In recent years, the carry trade landscape has evolved due to changes in monetary policy, technological advancements, and global market dynamics:
Low-Interest Rate Environment: Prolonged low rates in developed economies have compressed traditional interest rate differentials, reducing carry trade opportunities.
Algorithmic Trading: Automated strategies and algorithmic trading systems now dominate carry trade execution, improving efficiency but also increasing susceptibility to rapid market corrections.
Emerging Market Volatility: While high-yield currencies remain attractive, political instability and economic shocks introduce heightened risk, demanding more sophisticated risk management.
Diversification Across Asset Classes: Modern carry trades often integrate multi-asset approaches, including bonds, equities, and commodities, to enhance returns while mitigating currency risk.
7. Global Implications of Carry Trade Activity
Carry trades influence global financial markets beyond individual investor profits. Large-scale capital flows can impact exchange rates, interest rates, and liquidity conditions in emerging and developed markets alike. For example, heavy inflows into a high-yield currency can appreciate it significantly, affecting export competitiveness. Similarly, sudden unwinding of carry trades can trigger “flash crashes” in currency markets, as seen during past financial crises.
Central banks monitor carry trade activity carefully, as massive leveraged positions can exacerbate financial instability. This interplay between market participants and monetary authorities makes carry trade both a source of profit and a systemic consideration.
8. Conclusion
Carry trade profits in the global market emerge from exploiting interest rate differentials and potential currency appreciation. While historically lucrative, the strategy carries substantial risks, particularly during periods of economic uncertainty or market volatility. Successful carry trading requires a combination of careful analysis, risk management, and timely execution, often leveraging modern financial technologies.
Despite challenges, carry trades remain a vital component of the global financial landscape, influencing capital flows, currency valuations, and investment strategies worldwide. As central banks adjust monetary policies and global markets continue to integrate, carry trades will evolve, offering opportunities and risks that reflect the ever-changing dynamics of the global economy. Investors who understand these mechanisms and manage risks effectively can continue to profit from carry trades while navigating the complex landscape of international finance.
Reserves Impact on World Market Trading1. What Are Reserves?
Reserves refer to foreign exchange reserves, gold reserves, Special Drawing Rights (SDRs), and sometimes sovereign wealth fund assets. They are mainly held by central banks, with the U.S. dollar, euro, Japanese yen, and British pound forming the majority of global reserves. These reserves allow countries to participate in international trade smoothly, handle external shocks, manage currency volatility, and ensure financial stability.
The most crucial component is foreign exchange reserves, which include foreign currencies and government bonds from other countries. For example, many nations accumulate U.S. Treasury bonds because the dollar is the world’s primary reserve currency.
2. Why Reserves Are Important in Global Trading
Reserves influence world markets through multiple channels:
a. Currency Stability
Currency value is central to global trade. When a nation has high reserves, it can intervene in currency markets to stabilize its exchange rate. Stable currencies reduce uncertainty for traders and investors, leading to smoother global trade flows.
b. Import and Debt Payment Security
Countries with higher reserves can easily pay for imports, repay foreign debt, and maintain creditworthiness. This reduces the risk of default and contributes to overall market stability.
c. Confidence for Foreign Investors
International investors closely monitor a country’s reserve levels. High reserves improve market confidence, leading to increased foreign investment, which directly boosts equity, bond, and currency markets.
d. Crisis Management
During a financial or geopolitical crisis, reserves act as a first line of defense. Countries use reserves to:
support their currency
fund imports when exports fall
prevent capital flight
maintain liquidity in the banking system
This crisis-buffering role helps stabilize global markets and prevents contagion.
3. How Reserves Influence World Market Movements
a. Impact on Forex Markets
Foreign exchange markets respond directly to changes in reserves. When a central bank buys or sells foreign currency using its reserves, exchange rates are impacted.
Buying domestic currency using reserves → currency strengthens.
Selling domestic currency to buy foreign assets → currency weakens.
This affects:
export competitiveness
import costs
commodity prices
investor flows
For instance, if China increases U.S. Treasury holdings, demand for USD rises, strengthening the dollar, and impacting global trade.
b. Impact on Commodity Markets
Commodity prices—particularly gold, oil, and metals—are sensitive to reserve trends.
Gold:
Central banks hold gold as a reserve asset. When countries increase gold buying, gold prices rise globally. A shift away from the dollar through higher gold reserves can weaken the USD, boosting commodity prices since most are dollar-denominated.
Oil:
Countries with strong reserves can withstand oil price volatility. If major oil exporters (e.g., OPEC members) have large reserves, they can manage low-price periods without harming the market.
c. Bond Markets (Especially U.S. Treasuries)
Global bond markets are heavily influenced by reserve flows.
Many countries hold U.S. Treasuries as the safest reserve asset. If central banks like China or Japan buy more treasuries:
U.S. bond yields fall
borrowing costs decrease
equities often rise
If they reduce their holdings, yields rise sharply, affecting loan rates, stock valuations, and global liquidity.
d. Global Equity Markets
Equity markets respond indirectly to reserve changes because reserves influence:
currency stability
investor sentiment
capital flows
When reserves rise, it signals economic health and encourages foreign investors to buy stocks in that country. Falling reserves may trigger sell-offs as investors anticipate currency depreciation or economic stress.
4. Central Bank Intervention Using Reserves
Reserves allow central banks to intervene during volatility. There are three primary intervention methods:
Direct Market Intervention
The central bank buys or sells foreign currency in the spot market to manage exchange rates.
Indirect Intervention
Raising interest rates, adjusting liquidity, or using swap lines to support currency stability.
Sterilized Intervention
The bank intervenes in the FX market but offsets the impact on money supply through bond operations.
These interventions shape trading patterns worldwide because they influence currency trends, yield curves, and cross-border capital flows.
5. How Global Reserve Distribution Shapes Market Power
The dominance of the U.S. dollar is directly linked to reserve distribution. Since over 60% of global reserves are held in USD, the U.S. enjoys:
lower borrowing costs
global demand for its assets
influence over international sanctions
Countries like China and Russia have attempted to reduce reliance on the USD by increasing gold and other currency reserves, influencing long-term structural changes in global markets.
6. Impact of Reserve Accumulation on Trading Strategies
Traders often observe reserve data as a leading indicator.
a. Forex Traders
They track reserve announcements to anticipate currency interventions. Rising reserves may indicate upcoming currency appreciation, while falling reserves may signal outflows or financial stress.
b. Commodity Traders
Gold and oil traders watch central bank behavior as a trigger for price movements. Increased gold buying is a bullish signal for gold markets globally.
c. Stock Market Traders
Reserves affect foreign institutional investment (FII) behavior. High reserves attract FII inflows, boosting stock indices, particularly in emerging markets like India, Brazil, and Indonesia.
7. When Low Reserves Trigger Global Market Panic
Countries with dangerously low reserves become vulnerable to:
currency crashes
forced devaluations
sovereign defaults
capital flight
Such events cause ripple effects across global financial markets. Examples include:
Asian Financial Crisis (1997)
Argentina (2001)
Sri Lanka crisis (2022)
Low reserves can cause global fear, driving investors into safe-haven assets like gold, USD, and U.S. Treasuries.
8. The Future of Reserves in Global Markets
Several trends are shaping the future of global reserves:
De-dollarization
Countries are gradually reducing dependence on the USD and increasing gold, yuan, and euro reserves.
Digital Currencies
Central bank digital currencies (CBDCs) may become part of national reserve strategies in the future.
Sovereign Wealth Funds
These funds, backed by national reserves, increasingly influence global stock and real estate markets.
Conclusion
Reserves are one of the most powerful macroeconomic tools shaping global market trading. They impact currency stability, commodity prices, investor sentiment, bond yields, and trade flows. Strong reserves enhance market confidence and stabilize economies, while low reserves can trigger financial crises and global market turmoil. For traders and analysts, monitoring reserve trends provides critical insight into future movements in forex, commodities, and equity markets. Ultimately, reserves serve as both a protective shield and a strategic instrument that determines a nation’s strength in global financial markets.

Forex Trading Secrets1. Price Action Is the Real King (Not Indicators)
Most beginners clutter their charts with dozens of indicators hoping to find a perfect buy–sell formula. Professionals know the truth: price itself gives the most reliable information. Indicators lag because they represent past price data, not current market intent.
What professionals focus on:
Support and resistance zones
Market structure (higher highs, lower lows)
Liquidity levels (areas where stop-loss clusters exist)
Candlestick strength (rejection wicks, engulfing candles)
When a trader learns to read price action—how candles react to zones, how momentum builds or fades—they can trade profitably even with a clean chart. Indicators become secondary confirmation tools, not primary decision drivers.
2. Liquidity Is What Moves the Market
Here’s a hidden truth: forex markets move to fill liquidity, not because of random price swings. Big players like banks and institutional traders execute massive orders, and they need liquidity to fill those orders efficiently. That means:
Price hunts stop-loss clusters
Price sweeps highs and lows before reversing
Spikes occur to capture pending orders
This is why you often get stopped out right before the market moves in your favor. Understanding liquidity behavior gives traders a powerful edge.
Liquidity concepts include:
Stop hunts
Fake breakouts
Order block zones
Liquidity grabs
Smart traders expect these moves and position themselves accordingly.
3. The Trend Is Stronger Than Your Analysis
One of the biggest secrets is deceptively simple: Trading with the trend dramatically increases win probability. Many traders try to catch tops and bottoms, but institutional players rarely fight the trend—they ride it.
Characteristics of trend-following success:
Higher time-frame confirmation
Entering on pullbacks, not chasing
Using simple trend continuation patterns
Keeping trades open longer during strong trends
The trend holds more weight than any indicator or news event. Fighting the trend is one of the fastest ways to blow up an account.
4. Risk Management Is the Most Guarded Secret
Ask any long-term successful trader their biggest edge, and the answer won’t be a strategy—it will be risk management.
Key risk management secrets:
Never risk more than 1–2% per trade
Position sizing is more important than entries
A trader with moderate accuracy and strong risk rules often outperforms a trader with high accuracy but poor risk control
Understanding when not to trade is also a powerful risk strategy. Not trading low-quality setups protects your capital and mental energy.
5. Trading Psychology Outweighs Strategy
This is the hardest secret for beginners to accept: Your mindset determines your results more than your system.
The psychological traits professionals share:
Patience to wait for ideal setups
Discipline to follow rules consistently
Neutrality—no emotional attachment to wins or losses
Resilience after a losing streak
Confidence built on data, not hope
A trader can have the world’s best strategy, but fear, greed, revenge trading, and impulsiveness will destroy the account. This is why psychology books are more valuable than indicator tutorials.
6. Higher Time Frames Reduce Noise and Increase Accuracy
A hidden secret among consistently profitable traders is that they rely heavily on higher time frames like the daily or 4-hour.
Why higher time frames work:
Clearer market structure
Stronger trend visibility
Fewer false signals
Trades require less screen monitoring
Better risk-to-reward setups
Scalping looks attractive, but it magnifies emotions and often leads to over-trading. Higher time-frame trading reduces mental stress and increases consistency.
7. Fundamental Catalysts Drive Major Moves
Forex is deeply influenced by macroeconomic factors. Professionals use fundamentals to understand why the market is trending and where major volatility will occur.
Major catalysts include:
Central bank interest rate decisions
Inflation data (CPI, PCE)
Employment data (NFP, unemployment rates)
GDP figures
Geopolitical events
Fiscal policies
Ignoring fundamentals means ignoring the very forces that create trends.
But the secret is: You don’t need to be an economist—just know when news is happening and how it affects risk.
8. Smart Money Concept (SMC) Edge
Institutional-style concepts, once hidden from retail traders, are now increasingly discussed. These include:
Order blocks
Fair value gaps (FVG)
Market structure shifts (MSS)
Imbalance zones
Buy-side and sell-side liquidity
These concepts explain how institutions accumulate and distribute positions. Traders who master SMC often experience a major breakthrough in accuracy.
9. Consistency Beats Intensity
This secret is rarely acknowledged.
Successful traders:
Follow a structured routine
Practice the same strategy repeatedly
Keep a trading journal
Backtest regularly
Set trading sessions and stick to them
Failure in forex often comes from randomness—random indicators, random entries, random time frames. Success comes from consistency, not constant experimentation.
10. Forex Is a Business, Not Gambling
Treating forex like a business means:
Maintaining a trading plan
Logging trades
Tracking performance metrics
Identifying weak areas
Improving process instead of chasing profits
Traders who approach forex like gambling lose money. Traders who approach it like a business grow gradually and sustainably.
Conclusion: The “Secrets” Are Not Hidden—They Are Underrated
The real secrets of forex trading are not magic formulas or mysterious tools. They are principles that professionals use every day but beginners often overlook in search of shortcuts.
To summarize:
Price action matters most
Liquidity drives the market
Trend-following improves probability
Risk management is the true edge
Psychology determines consistency
Higher time frames simplify trading
Fundamentals guide long-term trends
SMC offers an advanced structural view
Consistency builds mastery
Treating trading as a business ensures longevity
Mastering these secrets takes time, discipline, and patience. But once internalized, they form the foundation of sustainable forex success.
The Global Trade Market Superpower1. What Defines a Global Trade Superpower?
A global trade superpower is a country (or group such as the EU) that:
✔ Dominates global exports and imports
The ability to supply goods at scale—manufactured, agricultural, technological—creates massive global impact.
✔ Controls key global supply chains
Superpowers are deeply embedded in or outright control production lines, energy routes, shipping, logistics, and commodity flows.
✔ Influences global financial systems
Trade superpowers usually have strong currencies, major stock exchanges, and banking systems that shape global capital movement.
✔ Sets global standards and rules
From trade agreements to environmental norms, superpowers shape what the world must follow.
✔ Maintains military and diplomatic dominance
Economic power is supported by defense capabilities, alliances, and diplomatic networks that protect trade interests.
Countries like the United States, China, and the European Union are prime examples of trade superpowers, while emerging economies like India, South Korea, and ASEAN nations are rapidly rising.
2. Historical Evolution of Trade Superpowers
a. Age of Exploration (1500–1800)
European powers—Portugal, Spain, Netherlands, France, and Britain—dominated global trade through:
Maritime exploration
Colonization
Monopoly control over spices, textiles, gold, and silver
This era established the foundations of global shipping routes and international markets.
b. Industrial Revolution (1800–1950)
Britain was the first global trade superpower driven by:
Mechanized manufacturing
Steamships and railways
Massive colonial markets
Later, the United States and Germany joined as industrial giants.
c. Post–World War II Era (1950–2000)
The United States emerged as the world’s leading trade superpower due to:
Dollar becoming the global reserve currency
Strong manufacturing and innovation
Control over global institutions like IMF and World Bank
Japan and Europe also became major export-driven economies.
d. Rise of China (2000–Present)
China transformed into the “Factory of the World” by:
Massive low-cost manufacturing
Export-oriented economic strategy
Investment in ports, shipping, and global infrastructure
China now rivals the United States in global trade influence.
3. Key Elements That Build a Trade Superpower
1. Industrial Capacity
Large production capability allows superpowers to dominate global markets.
China: electronics, machinery, textiles
United States: high-tech, aerospace, pharmaceuticals
EU: luxury goods, machinery, chemicals
Countries without strong industrial bases cannot gain global influence.
2. Control of Supply Chains
From microchips to crude oil, controlling supply chains decides global power.
Trade superpowers invest heavily in:
Ports and logistics
Manufacturing hubs
Rare earth minerals
Energy pipelines
Shipping fleets
For example, China’s Belt and Road Initiative strengthens its global supply chain control.
3. Strong Currency and Financial Power
A trade superpower’s currency becomes widely used in international transactions.
USD dominates global trade payments.
Euro is second in trade invoicing.
China’s yuan is expanding rapidly through global trade partnerships.
Financial power also helps these nations dictate global economic rules.
4. Technology and Innovation
Trade superpowers lead in:
Artificial intelligence
Semiconductors
Aerospace
Biotechnology
Green energy
Technology ensures long-term global competitiveness.
5. Strategic Trade Agreements
A superpower uses diplomacy to secure favorable trade networks:
Free trade agreements
Regional partnerships
Security alliances
Maritime control
The US-led alliances and China’s RCEP advantage demonstrate how diplomacy supports trade dominance.
4. Current Global Trade Superpowers
1. China
China is now the world’s largest exporter and a major importer of technology, energy, and food. Its strengths include:
Manufacturing scale unmatched globally
Strong logistics network
Belt and Road infrastructure
Dominance in rare earth minerals
Increasing influence in Asia, Africa, and Europe
China’s growth has reshaped global supply chains.
2. United States
The US remains a powerful trade superpower due to:
Dollar dominance
Technological leadership (Apple, Microsoft, Tesla, Boeing)
Agricultural exports
Strong domestic demand
Global financial and defense alliances
Even without being the largest exporter, its innovation and capital markets give it unmatched global leverage.
3. European Union
As a combined economy, the EU is a trade powerhouse:
World’s largest trading bloc
Major exporter of machinery, automobiles, pharmaceuticals
Highly regulated market influencing global standards
EU’s strength lies in quality manufacturing and a unified market.
4. Rising Powers
Countries like India, Japan, South Korea, Brazil, and ASEAN nations are gaining influence through:
Tech innovation
Young workforce
Regional trade agreements
Strategic resource control
India, for example, is becoming a major global service exporter and manufacturing hub.
5. How Trade Superpowers Influence Global Markets
a. Price Setting Power
Superpowers influence global prices of:
Oil and gas
Metals
Electronics
Food commodities
Their policies can cause global price shifts.
b. Sanctions and Trade Restrictions
Trade superpowers can impose sanctions that affect entire industries or nations.
Examples:
US sanctions disrupting global semiconductor trade
EU carbon tariffs influencing manufacturing norms
China’s export controls on rare earth elements
c. Shipping and Logistics Control
Major superpowers operate:
Key global ports
World’s largest shipping fleets
Global air cargo networks
This ensures they can move goods faster and cheaper than others.
d. Standard-Setting Power
From food safety to digital privacy, superpowers write rules the world must follow.
6. Future of Global Trade Power: Who Leads Next?
The global trade landscape is changing rapidly:
China is strong, but faces challenges like geopolitical tensions and shrinking demographics.
The United States remains influential, particularly in technology and finance.
India is the fastest-rising contender, driven by:
Rapid economic growth
Large workforce
Expanding manufacturing
Strong technology sector
India could become the next major trade superpower by 2035.
Regional blocs like ASEAN and Africa are also emerging as significant players.
Conclusion
A global trade superpower is not defined by exports alone, but by the ability to shape global markets, rules, supply chains, technology, and finance. Today, China, the United States, and the European Union dominate the trade landscape, while emerging economies like India are rapidly rising.
Global trade superpowers determine the flow of goods, capital, technology, and influence—ultimately shaping the direction of the world economy.

Startups Reshaping the Global Market1. Innovation as the Core Driver of Market Transformation
Startups thrive on innovation—not just in products, but in processes, platforms, and business models. Traditional firms often struggle with legacy systems, bureaucratic decision-making, and risk aversion. Startups, however, operate with flexibility and a problem-solving mindset, enabling them to test new ideas quickly.
Examples of Startup-Led Innovations
FinTech companies introduced digital banking, mobile wallets, micro-lending, and crypto-based financial services.
HealthTech startups pioneered telemedicine, AI diagnostics, and wearable health monitoring.
CleanTech innovators built new pathways for sustainable energy, including solar SaaS models and electric mobility.
AgriTech startups are transforming farming with precision agriculture, drone monitoring, and smart irrigation.
By challenging traditional norms, startups create entirely new markets and redefine customer expectations.
2. Digital Transformation and the Acceleration of Automation
Startups have significantly accelerated global digital transformation. They adopt technologies like AI, machine learning, blockchain, IoT, cloud computing, robotics, and automation as foundational elements of their products and services.
Key Impacts
AI-driven startups are powering forecasting, personalization, fraud detection, and workflow automation across industries.
IoT startups are reshaping manufacturing, logistics, and smart cities by enabling real-time data flow and predictive maintenance.
Blockchain startups introduced decentralization in finance, supply chain tracking, and digital identity.
The rapid adoption of digital tools by startups forced larger companies to modernize at unprecedented speed. Today, many enterprises partner with or acquire startups to remain competitive.
3. Disruption of Traditional Industries
Startups often succeed by simplifying complex, expensive, or inefficient processes within existing industries. They disrupt markets by offering:
Lower costs
Better customer experience
Faster delivery
Unique value propositions
Personalized solutions
Industry Disruptions
Transportation: Ride-hailing and mobility startups like Uber, Ola, Grab shaped the future of mobility.
Hospitality: Airbnb redefined accommodation by turning homes into global travel assets.
Retail: E-commerce startups forced traditional retail to shift online.
Media and Entertainment: Streaming startups revolutionized how people consume content.
Education: EdTech platforms made learning accessible to anyone, anywhere.
These disruptions create ripple effects, compelling traditional players to adapt or risk extinction.
4. Democratizing Access to Products and Services
Startups often focus on removing barriers—whether financial, geographical, or technological. Their solutions frequently make services accessible to people who previously could not reach them.
Examples
FinTech startups provide digital loans to small businesses lacking access to traditional banking.
EdTech platforms bring high-quality education to rural areas.
HealthTech solutions enable remote diagnostics for patients in underserved regions.
E-commerce startups allow small merchants to sell nationwide.
This democratization gradually levels the playing field and broadens economic participation.
5. Globalization and Cross-Border Expansion
Startups scale quickly due to digital infrastructure, venture capital funding, and cross-border partnerships. Cloud technology and digital marketing allow them to reach global audiences with minimal physical presence.
Global Expansion Strategies
Launching digital-first products
Partnering with global distributors
Leveraging borderless payment gateways
Operating through remote teams
Using international venture ecosystems
China, India, the US, Southeast Asia, and Europe have emerged as startup hotspots, each contributing to the global innovation landscape. Today, a startup founded in Bangalore or Singapore can compete directly with players in Silicon Valley or London.
6. Redefining Work Dynamics and the Future of Employment
Startups have also reshaped the global labor market. Their work culture emphasizes:
Flexibility
Remote work capabilities
Decentralized teams
Innovation-centric roles
Project-based employment
They push the boundaries of traditional corporate structures, preferring flat hierarchies and collaborative environments.
Impact on the Global Workforce
The rise of freelancing and gig economy platforms.
Increased demand for digital skills—coding, analytics, design, marketing.
Hybrid work becoming a global norm.
New roles emerging in AI, Data Science, UX, and Sustainable Tech.
This shift changes how workers engage with employers and how companies attract global talent.
7. India, Southeast Asia, and Africa: Emerging Powerhouses
While Silicon Valley retains its influence, emerging markets are becoming innovation hubs. They offer young populations, rising internet penetration, and business-friendly policies.
India
Thriving FinTech, EdTech, and SaaS sectors
Large talent pool
Increasing unicorn count
Southeast Asia
Digital commerce boom
Mobility and logistics innovations
Rapid adoption of mobile-first solutions
Africa
FinTech revolutionizing financial inclusion
Startups solving local issues like energy and agriculture
These regions contribute to diversifying global innovation beyond traditional Western markets.
8. Venture Capital and Funding Fuel Startup Growth
The global flow of venture capital has empowered startups to scale quickly. Investors provide not only capital but also mentorship, networks, and strategic guidance.
Funding Trends
Focus on AI, deep tech, sustainability, and biotech.
Rise of sovereign wealth funds investing in global startups.
Increase in corporate venture capital.
Growth of startup incubators and accelerators.
This financial ecosystem feeds global innovation and drives market evolution.
9. Sustainability and Impact-Driven Startups
With climate concerns and ESG policies gaining momentum, startups are building environmentally responsible solutions. Sustainability-focused ventures are transforming energy, mobility, packaging, food production, and recycling.
Areas of impact
Renewable energy
Electric mobility
Carbon capture
Biodegradable materials
Circular economy models
Impact startups are pushing both governments and corporations toward greener practices.
10. Challenges Startups Face in Redefining Global Markets
Despite their strengths, startups also encounter significant barriers:
Regulatory uncertainty
High failure rates
Scaling challenges
Funding shortages during downturns
Talent acquisition struggles
Competition from large established companies
However, their ability to adapt quickly helps many survive and flourish.
Conclusion
Startups are no longer just small experimental ventures—they are powerful forces reshaping the global market. By driving innovation, accelerating digital transformation, democratizing services, disrupting traditional industries, and fostering global competition, startups are setting new benchmarks for how businesses operate. Their influence extends across economies, technologies, and societal structures, making them central to the future of global commerce.
In the coming decade, startups will continue to redefine not just markets, but also how people work, collaborate, and consume. Their role in shaping a smarter, more inclusive, and more sustainable world will be one of the defining forces of the global economy.
G7 and G20 Roles in the World Market1. Understanding the G7: Composition and Purpose
1.1 Who Are the G7?
The G7 consists of the world’s most advanced economic democracies:
United States
United Kingdom
Germany
France
Italy
Canada
Japan
(Plus the European Union as a participant)
These nations collectively represent a significant portion of global GDP, technological innovation, financial markets, and political influence.
1.2 Core Purpose of the G7
Formed in the 1970s to address financial crises, the G7 serves as a policy coordination forum for major developed economies. It prioritizes:
Macroeconomic stability
Trade liberalization
Financial market regulation
Technology cooperation
Global security and democracy
Climate change and sustainability
The G7 does not have binding authority, but its decisions shape global market sentiment and policy directions.
2. G7 Roles and Impact on the World Market
2.1 Setting Global Economic Priorities
The G7 acts as a “steering committee” for global capitalism. Its members often set the tone for:
Interest rate expectations
Fiscal policy shifts
Global inflation strategies
Debt management frameworks
Statements from G7 meetings influence market behavior, investor confidence, and foreign exchange flows.
2.2 Leading Global Financial Stability
G7 nations dominate institutions such as:
IMF (International Monetary Fund)
World Bank
OECD
Through these institutions they guide:
Economic bailouts
Structural reforms
Monetary cooperation
Their collective stance is crucial during crises (e.g., 2008 financial crisis, COVID-19 recovery).
2.3 Shaping International Trade
The G7 is a major voice in defending free-market principles. It influences:
WTO policies
Global tariff standards
Supply chain resilience
Technology transfer regulations
Trade-related G7 declarations often impact commodity prices, currency movements, and trade routes.
2.4 Technology and Digital Governance Leadership
G7 countries lead in:
Artificial intelligence
Cybersecurity standards
Digital taxation rules
Their regulations affect global tech companies and cross-border e-commerce.
2.5 Geopolitical Influence on Markets
The G7 imposes sanctions, export bans, and trade restrictions that influence:
Oil and gas markets
Defense spending
Currency movements
Global investor flows
For example, sanctions on Russia shifted energy markets, trade routes, and commodity prices worldwide.
3. Understanding the G20: Composition and Purpose
3.1 Who Are the G20?
The G20 includes 19 countries plus the European Union:
Argentina
Australia
Brazil
Canada
China
France
Germany
India
Indonesia
Italy
Japan
Mexico
Russia
Saudi Arabia
South Africa
South Korea
Turkey
United Kingdom
United States
European Union
This group represents 80% of global GDP, 75% of global trade, and 60% of the world’s population.
3.2 Purpose of the G20
Formed in 1999 after the Asian Financial Crisis, the G20 brings together advanced and emerging economies to address:
Global economic governance
Financial market regulation
Sustainable development
Climate goals
Digital transformation
Trade and investment environment
It is a platform where both developed and developing economies have a voice.
4. G20 Roles and Impact on the World Market
4.1 Ensuring Global Economic Stability
The G20 acts as the primary global economic governance forum, especially during crises. It played a decisive role in:
Coordinating stimulus packages during the 2008 crisis
Managing COVID-19 economic recovery
Structuring global debt relief programs
Its policy coordination helps prevent global recessions and market collapses.
4.2 Strengthening Financial Market Regulations
The G20 instructs institutions like the Financial Stability Board (FSB) to:
Regulate big banks
Improve global accounting standards
Monitor crypto assets
Reduce shadow banking risks
These actions impact global stock markets, banking systems, and capital flows.
4.3 Facilitating Global Trade and Investment
The G20 influences:
WTO reforms
Lowering trade barriers
Cross-border investment rules
Infrastructure partnerships
Initiatives like the G20 Trade and Investment Working Group shape globalization trends.
4.4 Sustainable Economic Development
The G20 pushes global development goals in areas such as:
Renewable energy
Climate financing
Circular economy
Agriculture and food security
Digital inclusion
These priorities influence sectors like green energy, EV markets, and sustainable finance.
4.5 Voice for Emerging Economies
Countries like India, Brazil, Indonesia, and South Africa gain influence through the G20. It provides:
A platform for domestic issues
Opportunities for global partnerships
Access to international funding
Policy alignment with major economies
This fosters investment inflows and boosts regional economic growth.
5. Comparing the G7 and G20 in the World Market
Feature G7 G20
Members 7 developed nations 20 major economies (developed + emerging)
Share of Global GDP ~40% ~80%
Main Focus Policy leadership, geopolitical issues Economic governance, financial stability
Decision-making Political alignment Broader consensus
Influence on Markets Strong on finance, tech, sanctions Strong on trade, global growth, regulation
The G7 sets strategic direction, while the G20 ensures inclusive implementation.
6. How G7 and G20 Complement Each Other
G7 provides ideological leadership and rapid decision-making.
G20 provides global representation and practical solutions.
G7 initiatives often become G20-backed global policies.
Both together stabilize markets, trade flows, and global finance.
7. Conclusion
The G7 and G20 play distinct yet interconnected roles in shaping the world market. The G7 acts as a leadership forum for advanced economies, influencing global finance, technology, and geopolitical strategies. The G20 brings together developed and emerging markets, driving inclusive economic governance, sustainable development, and crisis management. Together, they provide direction, stability, and coordination across global markets, ensuring that the world economy remains resilient, interconnected, and forward-looking.

How Trading Markets Show Growth1. Price Appreciation: The Most Visible Sign of Market Growth
The most straightforward indicator of market growth is price appreciation. When the overall market rises, major indices such as the NIFTY 50, S&P 500, or Dow Jones show upward movement. Price growth reflects confidence, strong earnings, and bullish sentiment.
Why Prices Rise:
Higher corporate profits
When companies post strong earnings, investors expect future growth and push stock prices higher.
Lower interest rates
Cheaper borrowing costs encourage businesses to expand and consumers to spend.
Favorable global cues
Positive geopolitical stability or rising global demand often boosts markets.
Increasing liquidity
When more money flows into markets, it naturally drives prices upward.
However, price growth alone doesn’t always reflect true market strength. Sometimes markets rise due to speculation rather than fundamentals. Therefore, analysts look at other indicators to confirm growth.
2. Market Breadth: How Many Stocks Are Participating?
Market growth is healthier when a large number of stocks across sectors move upward, not just a few heavyweights.
Key Breadth Indicators:
Advance–Decline Ratio (ADR):
A high ADR shows more stocks rising than falling.
New Highs vs. New Lows:
If more stocks hit 52-week highs, it signifies broad participation.
Sector Rotation:
Growth is stronger when multiple sectors—like IT, banking, manufacturing, FMCG—move up together.
A market driven by only a few large companies may look strong on charts but remains vulnerable to sharp corrections. Broad-based rallies indicate sustainable growth.
3. Rising Trading Volumes: Another Major Clue
Volume shows the strength behind price movements. When markets grow with rising volumes, it signals genuine participation by investors.
Why Volume Matters:
Higher trust: More traders and institutions are confident.
Liquidity: Easier to buy and sell without big price swings.
Institutional activity: Large players accumulate stocks during growth phases.
A price rise without strong volume might indicate a temporary or weak rally, but rising prices with strong volume often confirm solid market growth.
4. Increased Market Capitalization: A Structural Indicator of Growth
Market capitalization—total value of all listed companies—offers a long-term view of market expansion.
What Increases Market Cap?
IPOs and new listings
Rising stock prices
Expanding corporate earnings
Sector development (e.g., renewable energy, AI, EVs)
When a market’s total capitalization rises consistently, it reflects economic expansion, more investor participation, and confidence in the business environment.
5. Positive Earnings Trends and Corporate Expansion
Markets fundamentally grow when companies grow.
Corporate actions that signal market growth:
Increasing revenues and profits
New product launches and innovation
Expansion into foreign markets
Large capex (capital expenditure) cycles
Dividend growth
When companies deliver strong results consistently, investors reward them by driving prices higher. Markets often show sustainable growth during periods of economic expansion and rising profit cycles.
6. Foreign Institutional Investment (FII) Inflows
FIIs are major market movers in developing economies like India. When foreign investors increase their holdings, markets grow rapidly because FIIs bring large amounts of capital.
Why FIIs invest more:
Stable government policies
Rising GDP
Favorable interest rate cycle
Strong currency
Attractive valuations
FII inflows often push markets to new highs, indicating global confidence in the region’s economic future.
7. Lower Volatility and Higher Stability
Growth phases are typically marked by lower volatility. When markets rise steadily without large swings, it signals:
Confidence among investors
Predictable economic environment
Stable business cycle
Indicators like the VIX (volatility index) are monitored to gauge stability. Declining volatility during rising markets is a classic sign of sustainable growth.
8. Technological Advancements and Higher Participation
Modern markets grow not only due to fundamentals but also due to structural improvements.
Technology-driven growth factors:
Online trading platforms
Faster execution
AI-based analytics
Increased financial literacy
Global accessibility through mobile apps
The rise of retail participation, especially after 2020, shows how technology boosts market growth by democratizing access.
9. Growth in Economic Indicators
Trading markets reflect the health of the overall economy. When major economic indicators turn positive, markets also show growth.
Key Indicators:
GDP growth
Declining unemployment
Rising industrial production
Higher consumer spending
Stable inflation
Markets often rally in anticipation of strong economic data since investors forecast higher corporate earnings.
10. Strong Business & Policy Environment
Government support can fuel market growth significantly.
Pro-growth policies include:
Lower taxes
Business-friendly regulations
Infrastructure spending
Stable monetary policy
Economic reforms
When the policy environment is supportive, businesses grow faster, which reflects in rising markets.
11. Bullish Investor Sentiment
Sentiment plays a massive role in driving markets upward. When traders feel positive, they buy more aggressively, pushing markets into a bull run.
Sentiment indicators include:
Investor surveys
Derivatives data
Options Put-Call Ratio
Media trends
Social media buzz
Strong sentiment combined with good fundamentals leads to prolonged market growth.
12. The Role of Global Markets
Local markets often mirror global trends. If the U.S., European, or Asian markets rally, emerging markets also show growth due to:
Increased risk appetite
Global capital flows
Lower global inflation
Strong worldwide demand
Trading markets are interconnected, and global strength often signals local growth.
Conclusion
Trading markets show growth through a combination of rising prices, higher participation, healthy economic conditions, strong corporate earnings, and favorable global trends. Growth is not merely a quick rally but a sustained upward movement supported by broad market participation, strong volume, investor confidence, and economic expansion. Understanding these indicators helps traders identify genuine growth phases and avoid temporary or speculative spikes.
The Importance of Reserves in Trading1. Definition and Types of Reserves
Reserves generally refer to the assets that a country, financial institution, or corporation keeps aside to meet future obligations, emergencies, or to stabilize economic activities. In the context of trading, reserves are primarily associated with central banks, which maintain foreign exchange reserves, gold reserves, and other liquid assets.
Foreign Exchange Reserves (Forex Reserves): These are holdings of foreign currencies, usually in the form of government bonds or deposits, used to back a country’s currency, manage exchange rates, and intervene in the forex market.
Gold Reserves: Traditionally, gold has been a store of value and a hedge against currency volatility. It is part of a country’s overall reserve portfolio.
Special Drawing Rights (SDRs) and Reserve Assets: Allocated by the International Monetary Fund (IMF), these act as supplementary foreign exchange reserve assets to support international liquidity.
Corporate and Bank Reserves: On a smaller scale, businesses and banks maintain cash or liquid reserves to manage operational risks, meet obligations, and ensure stability in trading activities.
2. Stabilizing Currency and Exchange Rates
One of the primary reasons reserves are important in trading is their role in stabilizing a country’s currency. In international trade, goods and services are often priced in stable foreign currencies, particularly the US dollar, Euro, or Japanese Yen. If a country’s currency fluctuates excessively due to market pressures, trade becomes unpredictable and costly.
Reserves allow central banks to intervene in the forex market by buying or selling currencies to maintain exchange rate stability. For example, if the local currency is depreciating sharply, the central bank can sell foreign exchange reserves to support its currency, preventing sudden spikes in import costs and preserving the competitiveness of exports. This stabilization ensures smoother trade transactions, predictable pricing, and confidence among international trading partners.
3. Ensuring Liquidity and Meeting Payment Obligations
Trade often involves payments across borders, which requires liquidity in foreign currency. Countries and corporations holding sufficient reserves can easily settle import bills, service foreign debts, and maintain creditworthiness. For businesses, maintaining cash reserves ensures that operational transactions, supplier payments, and contractual obligations are met without delay.
In times of economic stress, such as a balance-of-payments crisis, reserves act as a crucial liquidity buffer. They allow a country to continue trading, importing essential goods, and servicing debts even when other sources of financing are constrained. Without adequate reserves, a country risks defaulting on payments, facing higher borrowing costs, or experiencing a freeze in trade flows, all of which can be catastrophic for the economy.
4. Building Market Confidence and Creditworthiness
Reserves are not only about liquidity—they are also a signal of financial strength. Large reserves indicate that a country or institution is well-prepared to handle external shocks, giving confidence to investors, traders, and international financial institutions. This confidence translates into lower borrowing costs, stronger credit ratings, and greater willingness of foreign partners to engage in trade.
For instance, countries with ample forex reserves are perceived as more stable and less risky, which encourages foreign trade and investment. Corporations with healthy cash reserves or liquid assets are considered reliable partners in trade agreements, leading to smoother transactions and more favorable credit terms.
5. Hedging Against Trade Risks
International trade is inherently risky due to fluctuating exchange rates, commodity price volatility, geopolitical tensions, and economic downturns. Reserves act as a hedge against these risks. For example:
If a country faces a sudden surge in import prices due to a weakening local currency, reserves can be used to stabilize the exchange rate.
In commodity trading, reserves of strategic goods or currency assets can prevent supply disruptions or price shocks.
During global financial crises, reserves provide a cushion to continue critical trade operations without resorting to excessive borrowing or austerity measures.
This risk mitigation ensures that trade continues even under adverse conditions, protecting both the domestic economy and international trade relationships.
6. Facilitating Monetary and Trade Policies
Reserves give governments and central banks the flexibility to implement monetary and trade policies. By managing reserves effectively, countries can influence interest rates, control inflation, and maintain competitive export pricing. For instance, a country seeking to boost exports might use its reserves to prevent excessive appreciation of its currency, keeping export goods affordable in the global market.
Reserves also enable governments to implement trade agreements, provide subsidies, or intervene in strategic sectors without destabilizing the economy. They act as a financial lever, giving policymakers tools to balance growth, trade, and economic stability.
7. Supporting Crisis Management
History has repeatedly shown that countries with insufficient reserves face severe consequences during economic crises. Examples include sudden capital outflows, currency collapses, or trade restrictions. Reserves act as a shock absorber, allowing countries to navigate crises with minimal disruption to trade. During the 1997 Asian financial crisis, nations with higher reserves were able to stabilize their currencies faster, maintain trade flows, and recover more quickly than those with depleted reserves.
8. Strategic and Geopolitical Importance
Reserves also carry strategic significance. Countries with substantial reserves can influence global trade dynamics, secure critical imports, and participate in international financial negotiations with greater leverage. In geopolitically tense situations, reserves ensure that trade and essential imports continue uninterrupted, supporting national security and economic sovereignty.
Conclusion
Reserves are much more than a financial metric—they are a critical tool that underpins trading activities at every level. They stabilize currency and exchange rates, ensure liquidity, signal creditworthiness, mitigate risks, and enable effective policy implementation. For businesses, sufficient reserves safeguard operational continuity and international trade reliability. For countries, reserves act as both a shield against economic shocks and a lever for strategic influence in global markets.
In an interconnected and unpredictable global economy, reserves are the silent guardian of trade. They enable economies to operate smoothly, sustain investor confidence, and maintain a competitive edge in international commerce. Countries or institutions that fail to maintain adequate reserves face heightened vulnerability to market volatility, trade disruptions, and financial crises. Therefore, managing reserves prudently is not just an accounting exercise—it is a vital component of sustainable economic growth and successful trading.
Currency Wars and Forex TradingIntroduction
The global financial system is interconnected in complex ways, and one of the most crucial aspects of this system is the movement of currencies. Currency values are not just numbers on a screen; they represent national economic strength, political stability, and global competitiveness. Two concepts that are closely tied to this reality are currency wars and forex trading. Understanding them is essential for policymakers, investors, and traders who navigate the volatile world of international finance.
What are Currency Wars?
Currency wars, sometimes referred to as “competitive devaluations,” occur when countries deliberately devalue their own currencies to gain an advantage in international trade. The primary goal is to make exports cheaper and imports more expensive, stimulating domestic economic growth. For example, if Country A devalues its currency against the US dollar, its goods become cheaper for foreign buyers, potentially boosting exports. Conversely, imports from other countries become more expensive for domestic consumers, which can encourage consumption of locally produced goods.
Historically, currency wars are often associated with periods of global economic stress. The Great Depression of the 1930s and the financial crisis of 2008 both saw nations engaging in strategies to weaken their currencies to protect domestic industries. Currency wars can also arise from competitive monetary policies, where central banks use tools like interest rate cuts or quantitative easing to influence their currency’s value.
Causes of Currency Wars
Trade Imbalances: Countries with persistent trade deficits may attempt to devalue their currency to make exports more competitive and reduce the deficit.
Economic Stimulus Needs: During recessions, weaker currencies can boost domestic growth by encouraging exports.
Monetary Policy Differences: Central banks may adopt divergent policies—like lowering interest rates or engaging in quantitative easing—to influence their currency’s strength.
Global Political Tensions: Geopolitical rivalries can prompt countries to manipulate their currencies to protect economic interests.
While currency devaluation can stimulate exports, it also has risks. It can trigger inflation, erode consumer purchasing power, and provoke retaliatory measures from trading partners. If multiple nations engage in competitive devaluation simultaneously, a currency war emerges, potentially destabilizing the global economy.
Forex Trading: The Global Currency Market
Forex trading, or foreign exchange trading, is the act of buying and selling currencies in a decentralized global market. The forex market is the largest financial market in the world, with daily trading volumes exceeding $7 trillion as of 2023. Traders, investors, corporations, and governments participate to hedge risks, speculate on currency movements, or conduct international transactions.
The forex market operates 24 hours a day across different time zones, spanning financial centers in London, New York, Tokyo, and Sydney. Trading occurs in currency pairs, such as EUR/USD, USD/JPY, and GBP/USD. The value of a currency pair represents how much of the quote currency (the second currency) is needed to purchase one unit of the base currency (the first currency).
How Currency Wars Impact Forex Trading
Currency wars have a profound influence on forex markets. Since forex trading revolves around the relative value of currencies, any deliberate move by a government or central bank to weaken its currency creates volatility and trading opportunities.
Volatility and Speculation: Traders often capitalize on expected devaluations by short-selling the currency of a country engaging in competitive devaluation. Increased volatility can lead to both higher profits and greater risks.
Interest Rate Differentials: Central banks may cut interest rates to weaken their currency, affecting forex markets. Investors seek higher yields, leading to capital flows that influence currency values.
Safe-Haven Currencies: During currency wars, investors often flock to stable currencies like the US dollar, Swiss franc, or Japanese yen, affecting global liquidity and forex pricing.
Market Sentiment: Perceptions of a country’s economic health and political stability, influenced by currency policies, directly affect trading decisions in forex markets.
For instance, during the 2010s, when Japan aggressively pursued monetary easing to combat deflation, the Japanese yen experienced periods of significant depreciation. Forex traders who anticipated these moves were able to profit from yen carry trades and other strategies.
Trading Strategies in a Currency War
Currency wars create unique opportunities and risks for forex traders. Common strategies include:
Carry Trades: Traders borrow a low-interest-rate currency and invest in a high-interest-rate currency. In times of currency wars, the low-interest-rate currency may weaken, amplifying gains.
Technical Analysis: Traders analyze historical price movements, support/resistance levels, and technical indicators to predict currency movements in volatile markets.
Fundamental Analysis: Economic indicators such as GDP growth, trade balances, inflation, and central bank policies are closely monitored to anticipate currency devaluations.
Hedging: Corporations and investors may hedge their exposure to currency fluctuations using options, forwards, and futures contracts to manage risk during competitive devaluations.
However, currency war-induced volatility also carries risks of sudden market reversals. Traders must balance potential gains with the risk of unexpected policy changes or geopolitical developments.
Examples of Currency Wars in History
The 1930s Great Depression: Many countries devalued their currencies to boost exports, leading to trade tensions and global economic instability.
2008 Financial Crisis: Central banks in the US, Japan, and Europe implemented aggressive monetary easing, prompting fears of competitive devaluations.
US-China Trade Tensions (2010s–2020s): Both nations took measures affecting their currency values, impacting global trade flows and forex markets.
These examples show that currency wars are not only about short-term profit but also involve broader geopolitical and economic consequences.
Implications of Currency Wars
Global Trade Disruption: Competitive devaluations can distort trade balances and create uncertainty for exporters and importers.
Inflation Risks: Weaker currencies can increase import costs, driving domestic inflation.
Capital Flow Volatility: Investors may rapidly shift funds to perceived safe-haven currencies, affecting emerging markets.
Policy Retaliation: Countries may impose tariffs, quotas, or other trade barriers, exacerbating tensions.
Thus, currency wars have a dual impact: they influence both macroeconomic stability and micro-level trading opportunities.
Conclusion
Currency wars and forex trading are deeply intertwined. While currency wars involve deliberate attempts by nations to manipulate exchange rates for competitive advantage, forex trading represents the arena where these policies manifest in tangible price movements. Traders who understand the dynamics of currency wars can profit from volatility, but they must also navigate the risks of sudden policy shifts, global economic pressures, and geopolitical events.
In today’s interconnected world, the study of currency wars and forex trading is more relevant than ever. Central banks’ policies, global trade imbalances, and political developments can all cause rapid fluctuations in currency markets, influencing everything from international trade to individual investment portfolios. For policymakers, understanding the consequences of currency devaluation is critical to maintaining economic stability. For traders, monitoring these developments is essential for navigating the high-stakes, fast-moving world of forex markets.
Exchange Rates: The Pulse of Global Trade1. What Are Exchange Rates?
An exchange rate is the price at which one currency can be exchanged for another. For example, if 1 US Dollar equals 83 Indian Rupees, this rate governs how American imports from India are priced and how Indian exports to the US are valued. Exchange rates are determined by the supply and demand for currencies in the foreign exchange (Forex) market, which is the largest and most liquid financial market in the world, with daily trading exceeding $6 trillion.
2. Types of Exchange Rates
There are two main types of exchange rates:
Floating Exchange Rates: Determined by market forces of supply and demand. Most major currencies like the US Dollar (USD), Euro (EUR), and Japanese Yen (JPY) operate on this system.
Fixed or Pegged Exchange Rates: Set and maintained by governments or central banks. For example, the Hong Kong Dollar is pegged to the US Dollar within a narrow band.
Additionally, there are managed floats, where central banks intervene to stabilize currency volatility without fully fixing it.
3. How Exchange Rates Influence Global Trade
Exchange rates play a pivotal role in determining trade flows:
Export Competitiveness: A weaker domestic currency makes exports cheaper for foreign buyers. For example, if the Indian Rupee weakens against the US Dollar, Indian goods become cheaper in the US, boosting export demand.
Import Costs: Conversely, a stronger domestic currency makes imports cheaper, reducing costs for businesses reliant on foreign raw materials or technology.
Profit Margins: Multinational corporations must account for currency fluctuations in their pricing strategies. Unhedged currency risks can erode profits.
4. The Hidden Secrets Behind Exchange Rate Movements
While exchange rates are publicly quoted, the underlying forces often remain opaque to casual observers. Some key “secrets” include:
Interest Rate Differentials: Countries with higher interest rates attract foreign capital seeking better returns. This capital inflow increases demand for the domestic currency, strengthening it. Traders monitor central bank policies closely because even minor rate changes can trigger significant currency moves.
Trade Balances vs. Capital Flows: Many assume trade balances alone dictate currency value, but capital flows—investments in stocks, bonds, and real estate—often have a larger impact. For instance, even a country running a trade deficit may see its currency appreciate if foreign investors are pouring money into its financial markets.
Speculative Forces: The Forex market is dominated by large banks, hedge funds, and institutional investors. Speculators can create short-term volatility by betting on expected currency movements, sometimes disconnecting exchange rates from economic fundamentals temporarily.
Political Risk Premiums: Exchange rates embed expectations of political stability. Elections, policy changes, trade wars, or geopolitical tensions can prompt sudden currency swings. For example, uncertainty about Brexit led to dramatic fluctuations in the British Pound.
Central Bank Interventions: Some central banks actively buy or sell their currency to stabilize trade competitiveness or control inflation. These interventions are often discreet, making their influence seem almost magical to outsiders. For example, Japan’s Bank of Japan has a long history of intervening in currency markets to maintain export competitiveness.
Currency Pegging Strategies: Some nations deliberately maintain undervalued currencies to promote exports. China’s historical management of the Yuan is a classic case; by keeping the currency artificially low, Chinese exports became cheaper globally, boosting economic growth.
5. Exchange Rate Risks in Global Trade
For companies involved in cross-border trade, exchange rates are a double-edged sword:
Transaction Risk: Deals agreed upon in foreign currencies may lose value if the exchange rate moves unfavorably before payment.
Translation Risk: Multinationals converting foreign earnings back to the home currency may see profits shrink due to adverse currency movements.
Economic Risk: Long-term currency trends can affect market competitiveness and strategic planning.
Businesses often use hedging instruments such as forward contracts, options, and swaps to mitigate these risks, but hedging itself requires careful timing and analysis.
6. The Role of Exchange Rates in Trade Policies
Governments and policymakers closely monitor exchange rates as they influence trade balances, inflation, and economic growth. Some subtle but powerful strategies include:
Devaluation: Intentionally lowering a currency’s value to make exports cheaper and stimulate economic growth.
Revaluation: Increasing a currency’s value to reduce inflationary pressures from imports.
Capital Controls: Restricting foreign investment flows to prevent excessive volatility in the domestic currency.
These strategies are sometimes opaque and subject to sudden changes, making the currency markets an arena of both economic and political strategy.
7. Global Trade Patterns and Currency Movements
Currency trends often shape global trade flows in ways that are not obvious:
Commodity Prices: Commodities like oil are priced in US Dollars. Countries dependent on these imports face a hidden “currency tax” if their own currency depreciates.
Regional Trade Blocs: Exchange rates influence regional competitiveness. For instance, the Euro affects intra-European trade and external trade with non-Euro countries.
Supply Chain Costs: Multinational companies adjust sourcing and production locations based on currency trends to optimize costs.
8. Long-Term Insights
Understanding exchange rates requires more than just watching daily quotes. Savvy traders and policymakers analyze:
Purchasing Power Parity (PPP): Long-term equilibrium exchange rates based on relative price levels.
Real Effective Exchange Rate (REER): Adjusted for inflation and trade weight, giving a more realistic measure of competitiveness.
Global Reserve Currencies: US Dollar dominance impacts how other currencies behave in trade. Countries holding large dollar reserves can stabilize their exchange rates and trade flows.
9. Technology and Algorithmic Influence
Modern currency markets are heavily influenced by technology:
Algorithmic Trading: Sophisticated algorithms detect tiny market inefficiencies, executing trades within milliseconds, which can amplify short-term currency volatility.
High-Frequency Trading (HFT): Small price differentials are exploited across different exchanges globally, subtly affecting exchange rates and market liquidity.
10. Key Takeaways
Exchange rates are central to global trade, influencing prices, demand, and competitiveness.
Beyond obvious supply and demand, factors like capital flows, speculation, political stability, and central bank strategies profoundly affect currency movements.
Businesses, investors, and governments must actively manage exchange rate risks to protect profits and economic stability.
Understanding long-term fundamentals like PPP, REER, and reserve currencies helps anticipate shifts in global trade patterns.
In short, exchange rates are both a reflection and a driver of global economic dynamics. Mastering their complexities offers a competitive edge in international business and investment—often a “hidden secret” that separates average market participants from those who profit consistently in global trade.
ETFs and Index Trading1. What Are ETFs?
An Exchange-Traded Fund (ETF) is an investment fund that trades on stock exchanges just like individual shares. It pools money from multiple investors and invests in a basket of assets such as:
Stocks
Bonds
Commodities
Currencies
A combination of multiple asset classes
An ETF aims to track the performance of a specific index, sector, commodity, or theme. For example:
Nifty 50 ETF tracks the Nifty 50 index
S&P 500 ETF tracks the S&P 500
Gold ETF tracks gold prices
Bank ETF tracks banking sector stocks
Because ETFs trade like stocks, you can buy and sell them throughout market hours at real-time prices.
2. Key Features of ETFs
A. Diversification
Instead of buying many stocks individually, investors get instant diversification through one ETF.
For example, a Nifty ETF gives exposure to 50 major Indian companies at once.
B. Liquidity
ETFs can be bought and sold anytime during market hours. Their liquidity depends on the trading volume and the liquidity of underlying assets.
C. Low Cost
ETFs usually have lower expense ratios than mutual funds, mainly because most are passively managed.
D. Transparency
ETFs disclose their portfolios daily, so investors know exactly what they own.
E. Flexibility
Investors can use ETFs for:
Long-term investment
Short-term trading
Hedging
Sector rotation
Commodity exposure
3. Types of ETFs
A. Equity ETFs
Track stock indices such as:
Nifty 50
Sensex
S&P 500
Nasdaq 100
B. Bond ETFs
Invest in government or corporate bonds. These offer lower volatility and predictable income.
C. Commodity ETFs
Track commodities such as gold, silver, crude oil, and natural gas.
D. Sector and Thematic ETFs
Focused on specific sectors like:
Banking
Pharma
IT
Or themes like:
EV (Electric Vehicles)
Renewable energy
Digital technology
E. International ETFs
Provide exposure to global markets without currency complications.
F. Leveraged and Inverse ETFs
Used mainly by advanced traders:
Leveraged ETFs amplify index returns (2x or 3x)
Inverse ETFs move opposite to index direction
4. How ETFs Work
An ETF is created through a process involving:
Asset Management Company (AMC)
Authorized Participants (APs)
Market Makers
The AMC creates ETF units by assembling a portfolio of securities that replicate an index. APs ensure that ETF price stays close to the NAV by arbitrage.
5. What Is Index Trading?
Index trading involves buying and selling financial instruments that track major stock indices like:
Nifty 50
Bank Nifty
Sensex
S&P 500
Dow Jones
Nasdaq 100
Instead of trading individual stocks, traders speculate on overall market direction using:
Index Futures
Index Options
ETFs
Index Contracts for Difference (CFDs) in global markets
Index trading allows exposure to the broad market with a single trade.
6. Why Index Trading Is Popular
A. Reduced Stock-Specific Risk
Indices represent a basket of stocks; poor performance of one stock doesn't drastically affect the entire index.
B. High Liquidity
Major indices have extremely high trading volumes, ensuring smooth entry and exit.
C. Stable Price Movements
Indices are generally less volatile than individual stocks (though instruments like Bank Nifty can still be volatile).
D. Easy to Analyze
Indices react more to macro factors like:
GDP data
Inflation
Interest rates
Global market trends
This makes them easier to study compared to hundreds of stocks.
E. Ideal for Derivatives Trading
Most option traders prefer index options such as:
Nifty options
Bank Nifty options
FINNIFTY options
These contracts have:
Better liquidity
Lower manipulation
More reliable directional moves
7. ETFs vs Index Funds vs Index Trading
ETFs
Trade on exchanges
Real-time price changes
Good for traders and long-term investors
Index Funds
Work like mutual funds
Bought and sold at NAV
No intraday trading
Index Trading
Uses futures and options
More suited for active traders
High leverage
Higher risk
8. Strategies Using ETFs and Index Trading
A. Long-Term Wealth Building Using ETFs
Investors use:
Nifty 50 ETF
S&P 500 ETF
Nasdaq 100 ETF
for 10–20 year wealth creation.
Benefits include:
High return potential
Low cost
Passive investment
B. Short-Term Trading
Traders buy or sell ETFs based on:
Breakouts
Moving averages
RSI or MACD signals
Example:
Buy Nifty ETF when it breaks above 200-day moving average.
C. Hedging
If traders hold a portfolio of Indian stocks, they hedge by shorting:
Nifty futures
Bank Nifty futures
Inverse ETFs (outside India)
This protects against market crashes.
D. Sector Rotation
Traders switch between sector ETFs based on economic conditions:
Banking ETF during interest rate cuts
IT ETF when currency weakens
Pharma ETF during global uncertainty
E. Options Trading Strategies
Index options allow strategies like:
Straddle
Strangle
Iron Condor
Bull Call Spread
Bear Put Spread
These strategies help traders manage volatility and risk.
9. Risks in ETFs and Index Trading
A. Market Risk
ETFs reflect the broader market; if markets fall, ETF values fall.
B. Tracking Error
Sometimes ETFs do not perfectly replicate index movements due to:
Costs
Liquidity issues
Management inefficiencies
C. Liquidity Risk
Some thematic ETFs have low trading volumes.
D. Leverage Risk
Leveraged ETFs and index futures can magnify losses.
E. Volatility Risk
Index options traders face sudden moves due to global events.
10. Who Should Use ETFs and Index Trading?
ETFs Are Ideal For:
Long-term investors
Beginners
Those seeking diversification
Passive investors
Index Trading Is Ideal For:
Active traders
Options and futures traders
Short-term speculators
Hedge fund strategies
Conclusion
ETFs and index trading combine simplicity, diversification, liquidity, and flexibility—making them essential tools in modern financial markets. ETFs allow low-cost, long-term investment with broad exposure, while index trading offers high-efficiency strategies for short-term traders and professionals. Whether someone wants to invest passively for decades or actively trade market movements, understanding ETFs and index trading provides a strong foundation for smarter financial decisions.

1 Test – 2 Breaks” in Gold: How It WorksIn the gold market, there’s a price behavior pattern that professional traders always pay attention to: “1 test – 2 breaks”.
This is not a lucky pattern or a coincidence — it is a repeating market behavior driven by liquidity, psychology, and institutional order flow.
Once you understand this rule, you’ll read gold’s movement far more clearly, especially during volatile phases.
1. What does “1 test – 2 breaks” actually mean?
This rule describes how gold typically reacts when it approaches a major support or resistance zone:
First time:
Price tests the level and rejects strongly.
Traders think the zone is “solid”.
Second time:
Price returns but reacts weaker.
This is where the market is collecting liquidity.
Third time:
The level gets broken decisively, starting a strong move in the breakout direction.
In short:
Gold respects the level the first time, tricks traders the second time, and breaks for real on the third.
2. Why does gold follow this rule so often?
Not random.
There are three core reasons:
2.1. Gold has extremely high liquidity
Gold (XAUUSD) is one of the most liquid assets in the world.
Institutions dominate
Volatility is high
Price often seeks stop-loss zones
This makes support/resistance areas get tested multiple times before the real break.
2.2. Retail traders believe too much in “strong levels”
Retail traders tend to:
Buy at support
Sell at resistance
Place SLs below/above obvious levels
Result?
Market makers know exactly where liquidity clusters are , so they push price to test those zones multiple times before the real move.
2.3. Institutions need liquidity to build large positions
Big players can’t:
Buy directly at the bottom
Sell directly at the top
They need price to revisit the zone to gather liquidity → then break it decisively.
The “1 test – 2 breaks” pattern reflects this institutional flow perfectly.
3. How to apply this rule in gold trading
(1) Don’t enter on the first test
The first reaction is strong but often not sustainable .
Avoid FOMO — just observe.
(2) The second test reveals the market’s intention
If the second reaction is:
Weaker
Low momentum
Weak rejection wicks
Lack of strong buyers/sellers
→ It likely indicates liquidity harvesting.
(3) The third approach is where the breakout often happens
If price comes back the third time with:
Faster momentum
No higher highs / lower lows
No clear rejection
Clean, steady approach
→ It’s a strong sign the zone is about to be broken cleanly .
You can then look for breakout entries or retest entries.
4. Important notes
Don’t apply this rule mechanically
Only use it on significant zones, especially on H1 and H4
Confirm with momentum or volume
Avoid using it during high-impact news (NFP, CPI, FOMC…)
5. Conclusion: Gold doesn’t move randomly — it repeats behavior
The “1 test – 2 breaks” rule works because:
Institutions need liquidity
Retail SLs cluster at predictable spots
Gold’s volatility + liquidity amplify the pattern
Recognizing this gives you:
Fewer premature entries
Fewer SL hunts
More confidence during real breakouts
Understanding Global Market Meltdowns and CrisesIntroduction
Global markets are the backbone of the world economy, connecting nations, investors, and industries. They are often perceived as resilient and self-correcting, yet history shows they are prone to sudden and severe collapses known as market meltdowns. These meltdowns are characterized by sharp declines in stock prices, bond markets, and commodities, often accompanied by panic selling, liquidity crises, and systemic financial disruptions. Understanding the causes, mechanisms, and impacts of these crises is essential for policymakers, investors, and businesses alike.
Defining Market Meltdowns
A market meltdown, sometimes referred to as a financial crisis, occurs when the prices of assets drop precipitously within a short period. Unlike normal market corrections, which reflect adjustments based on valuations or economic cycles, meltdowns are marked by panic-driven behavior, loss of confidence, and widespread liquidity constraints. They are rarely confined to a single sector, often triggering a chain reaction across global financial systems.
Historically, major meltdowns include the 1929 Great Depression, the 2008 Global Financial Crisis, and the 2020 COVID-19 market crash. Each had unique triggers but shared common dynamics of excessive speculation, over-leverage, and systemic vulnerabilities.
Causes of Global Market Crises
Excessive Leverage and Debt
Financial institutions, corporations, and households often borrow excessively during economic booms. High leverage amplifies gains during expansions but drastically magnifies losses during downturns. For example, the 2008 crisis was primarily driven by over-leveraged banks investing in subprime mortgages. When defaults rose, the interconnectedness of institutions led to a global liquidity crisis.
Speculative Bubbles
A speculative bubble forms when asset prices soar far above their intrinsic value, fueled by irrational investor optimism. Bubbles are often visible in real estate, equities, and commodities. When investor sentiment reverses, the bubble bursts, triggering rapid sell-offs. The 2000 dot-com crash exemplified this phenomenon, where internet-based companies were massively overvalued before the market collapsed.
Banking System Failures
Banks are the lifeblood of modern economies. A failure in the banking sector can quickly escalate into a financial crisis. Bank runs, where depositors rush to withdraw funds, can destabilize the entire financial system. The 1930s Great Depression was exacerbated by widespread bank failures, causing massive unemployment and contraction in economic output.
Macroeconomic Imbalances
Excessive fiscal deficits, high inflation, or persistent trade imbalances can undermine confidence in financial markets. Investors may withdraw capital from affected regions, causing currency depreciation, stock market losses, and economic stagnation. The Asian Financial Crisis of 1997 was partly triggered by high external debt and currency overvaluation in countries like Thailand and Indonesia.
Geopolitical and Global Shocks
Wars, political instability, pandemics, and natural disasters can act as sudden shocks, triggering market panics. For instance, the COVID-19 pandemic in 2020 caused unprecedented global market volatility as governments imposed lockdowns, disrupting supply chains and consumer demand.
Regulatory Failures and Lack of Oversight
Weak regulatory frameworks, insufficient supervision, or financial innovation without proper oversight can allow systemic risks to build unnoticed. The 2008 crisis highlighted the dangers of unregulated derivatives, which magnified losses and spread risks across global financial institutions.
Mechanisms of Market Meltdowns
Liquidity Crunch
During a meltdown, liquidity—the ease with which assets can be bought or sold—evaporates. Investors rush to convert assets into cash, driving prices further down. Banks may restrict lending to preserve liquidity, exacerbating economic contraction.
Contagion Effect
Financial markets are globally interconnected. A crisis in one region can quickly spread internationally through trade, investment flows, and banking linkages. The 2008 crisis, which started with U.S. mortgage-backed securities, rapidly affected Europe, Asia, and emerging markets due to these linkages.
Panic Selling and Herd Behavior
Human psychology plays a significant role. Fear often triggers irrational selling, creating a self-reinforcing downward spiral. Investors abandon long-term strategies, leading to sharp price declines that are disproportionate to actual economic fundamentals.
Credit Freeze
Banks and investors may hoard cash and reduce lending, causing a credit crunch. Businesses struggle to finance operations, leading to layoffs, bankruptcies, and reduced consumer spending, which further depresses economic activity.
Impacts of Market Crises
Economic Recession
Market meltdowns often coincide with broader economic downturns. Declining asset prices reduce wealth, curtail consumption, and disrupt investment, leading to slower economic growth or outright recession.
Unemployment and Social Consequences
Business failures and reduced investment lead to layoffs, increasing unemployment rates. Social unrest and political instability may follow, as seen during the Great Depression and subsequent economic crises.
Loss of Investor Confidence
Crises shake investor confidence, making markets more volatile and risk-averse. Recovery often takes years, as rebuilding trust is slower than stabilizing balance sheets.
Policy Interventions
Governments and central banks typically intervene through fiscal stimulus, interest rate cuts, or quantitative easing. While necessary to restore stability, these measures may increase long-term debt burdens or inflate asset prices, potentially sowing the seeds of future crises.
Global Ripple Effects
In a globalized economy, meltdowns in major financial centers impact trade, investment, and currency markets worldwide. Emerging economies often bear the brunt of capital outflows, currency depreciation, and reduced access to credit.
Lessons and Mitigation Strategies
Diversification and Risk Management
Investors can protect themselves by diversifying portfolios across asset classes, sectors, and geographies. Proper risk management helps absorb shocks during periods of extreme volatility.
Regulatory Oversight and Transparency
Strong regulation, stress testing of financial institutions, and transparency in financial products reduce the likelihood of systemic risks accumulating unnoticed.
Monetary and Fiscal Preparedness
Central banks and governments must maintain tools to stabilize markets, such as liquidity facilities, interest rate adjustments, and targeted fiscal stimulus to cushion economic shocks.
Behavioral Awareness
Understanding the psychological dimensions of markets—herd behavior, panic selling, and over-optimism—can help investors make rational decisions even in turbulent times.
Global Coordination
Given the interconnectedness of modern markets, international cooperation is crucial to prevent contagion and stabilize financial systems. Institutions like the IMF and World Bank play pivotal roles in crisis mitigation.
Conclusion
Global market meltdowns are complex phenomena with roots in economic imbalances, speculative excesses, regulatory lapses, and human psychology. While each crisis has unique characteristics, their recurring nature underscores the need for vigilance, risk management, and systemic safeguards. Understanding the mechanisms, causes, and impacts of these meltdowns is essential for investors, policymakers, and societies to navigate the volatile terrain of global finance.
By learning from history and implementing robust preventive measures, the world can reduce the frequency and severity of market crises, ensuring more stable and resilient financial systems in the future.
Understanding Discipline in TradingWelcome back everyone to another post. In today’s article we will dive deeper into the 3 keys of Trading success! As attached below.
Today we will be reviewing the Key “DISCIPLINE”
Just like risk management and Psychology this is also a difficult skill to maintain.
In the modern world it’s considered a skill now, because most of society doesn’t have any discipline in any field.
Let’s get started.
Definition:
When it comes to Trading Discipline. Trading Discipline means one user has the mental ability ( strength ) to follow their system. Their Trading Plan, risk management and maintain their psychology regardless of what events happen.
Trading Discipline separates profitable traders from the gamblers.
(Below I have attached the article Trader or Gambler as it relates to this post, make sure to give it a read!)
Discipline ensures that the user makes the right decisions based on strategy and logic instead of FOMO, ego and greed.
It is not just about following rules though. Discipline relates to the outside world of cultivating habits, mindsets and self-control too.
1) Understanding Trading Discipline
Firstly, you must truly grasp what it actually means. Most individual traders confuse it with stubbornness. They think it’s about holding on to trades or forcing a system. In reality, it’s only about consistency and self-control! Simple right?
Example:
Imagine, you have a system. A trading plan. It has the 1% rule where you don’t risk more than 1% of your account per trade. Understanding discipline means you must know why that rule is in place. It’s too protected your capital! Not breaking it after a few losses just to catch up.
Real Life Analogy:
A professional runner trains every day. They do it even when they are sad, tired, unhappy and unmotivated. This is discipline. Discipline drives long term results. Discipline is continuing it no matter what the current situation is.
2) Implementing Trading Discipline
The process of implementation is nothing complicated. It’s only turning knowledge into action. Knowing about it won’t do anything, you must maintain the effort of consistently applying it to each step in your system.
How to implement it:
- Follow your plan: Before each trading day starts, read out your system and tell yourself you will follow it. Even if no set ups appear, you will still succeed because you followed your plan.
- Set risk rules: Apply proper risk management and lot management so you don’t cave into fear. Apply the 1:3 Rule or 1:4 Rule.
- JOURNAL your TRADES Damn it: Record every trade, your reasoning, and whether you actually followed your rules. Don’t just add a screen shot and nothing else. YOU won’t succeed if you don’t journal your trades properly.
Example:
A novice trader may plan to place an entry when price is at $50 and exit at $55 with a 2% risk per trade. Even if it dips to price $48, they hold to the stop loss accepting the loss instead of moving it and hoping it “recovers”
Real Life analogy:
Think of it as budgeting every day, or for a holiday, or your next maccas run. You set a weekly budget plan and stick to it. Even when tempted by special deals, sticking to your budget allows for long term financial health to take place. Just like risk management but with real life.
3) Maintaining Trading Discipline
Discipline can’t act overnight, it’s the process of small steps working your way up to solid consistency over time. Even when feelings run high – discipline isn’t one time. It’s daily practice.
Some strategies are:
- Reviewing your previous trades daily or at the end of each week during a market close. Assess your wins and losses.
- Build up emotional awareness, be aware of what fear, greed and overconfident emotions take place.
- Reward yourself to the rules of your system, not just profitable outcomes.
If you reward yourself for not trading in one day because not a single set up appeared, you were still successful because you didn’t “force” a set up and take a gamble.
Example:
A trader might experience 3 losses in the first hour of the day, even if they were all A++ set ups. Instead of revenge trading, he sticks to his plan, accepts the L and leaves the charts for the rest of the day to reset mentally and gain a win in another field, eg – Gym.
Real-life analogy:
By maintaining a healthy lifestyle, you must apply the same approach. You don’t stop exercising after a few days off. Discipline keeps you aligned even when your motivation and mental strength fades.
4) Adapting without breaking your Discipline
Long story short, Markets move, Markets change, Markets can and WILL evolve.
Traders must adapt. Not just allows their system to adapt, but their psychological mindset of discipline.
Adapting can be confusing but it can be done by:
- Don’t switch up new strategies, adjust your current system slightly then back test and forward test it on demo accounts. Eg Paper trading.
- Update your trading system based on data and monthly results, not emotions.
- Avoid making sudden changes right after losses.
Example:
Let’s say a forex strat no longer works due to low volume and volatility. A strict trader tests adjustments in their demo accounts, then incorporates them into the plan after they have received positive data from tests.
Real-life analogy:
A chef might change his recipe based on a specific ingredient availability but will not ignore the core cooking principles. It’s about adapting strategically, not impulsively.
5) Reinforcing Discipline Through mindset and daily life.
Discipline in the trading field is just amplified by the discipline process outside of trading. It follows the exact same process. Daily habits and mindset directly impact one’s trading performance.
To reinforce discipline, you can:
- Maintain routines: Wake up at consistent times. Don’t wake up at 3:00am to “grind” if you do that, you’re stupid – you’ll burn yourself out and make the process harder.
Plan your day and review goals. Eg do a brain dump every morning, write down or type out all ideas, thoughts and emotions and sort it out.
- Practice mental training: People suggest doing personal journaling or meditation. Just go for a walk in the morning for 5 minutes. First thing in the morning, feel the fresh breeze, air, sunlight and nature. You simulate the mind and body in a natural way allowing for you to think clearly and train your mind.
- Change your environment: surround yourself with work dogs, people who are strict on routines, self-improvement, self-development, individuals who don’t slack off.
Example:
Traders who can control their time well, exercise, eat healthy can maintain their stress in trading better than one who does not focus on outside habits.
Real-life analogy:
A school student who studies consistently every day and night rather than squishing it all in before exams perform better. Just like a trader who can maintain structured habits inside and outside of the market.
Conclusion:
Trading discipline is more than following rules, it’s a mindset and a lifestyle, it relates to the world outside of trading. Just like psychology, if you can’t master it outside, you won’t master it inside.
It's about understanding your own weaknesses and adjusting the system to hold structured rules that will allow it to be more easily achievable for yourself.
Remember, trading is not sunshine and rainbows.
It’s about building a system and following it. It is the hardest way to make “ easy ” money.
To find out what the other 2 keys are, review the 3 posts below where I explain the 3 keys to trading success, and go deeper into each of them!

The Energy Transition Boom: A Global Shift in PowerDrivers of the Energy Transition Boom
Climate Change and Environmental Pressures
The primary driver of the energy transition is the urgent need to combat climate change. Rising global temperatures, extreme weather events, and the growing awareness of environmental degradation have compelled governments, corporations, and societies to rethink energy production and consumption. International agreements, notably the Paris Agreement of 2015, set ambitious goals for reducing carbon emissions, pushing nations to accelerate the adoption of renewable energy sources. The global push for net-zero emissions by 2050 has fueled unprecedented investment in clean technologies.
Technological Advancements
The boom in renewable energy has been facilitated by significant technological breakthroughs. The cost of solar photovoltaic (PV) panels has dropped by over 90% in the past decade, while wind turbine efficiency has increased dramatically. Advances in energy storage, particularly lithium-ion and emerging solid-state batteries, have mitigated the intermittency issues associated with renewable energy, making it a more reliable alternative to fossil fuels. Smart grids, digital energy management systems, and artificial intelligence in energy optimization are also enabling more efficient and resilient energy networks.
Economic Incentives and Investment Flows
Governments worldwide are offering tax incentives, subsidies, and regulatory support to promote renewable energy. Simultaneously, private capital is flooding into clean energy projects. Investment in renewable energy reached over $500 billion globally in recent years, encompassing solar, wind, battery storage, and green hydrogen projects. The economic logic is compelling: renewable energy has low operational costs, scalability, and long-term price stability compared to volatile fossil fuel markets.
Energy Security and Geopolitical Factors
The energy transition is also influenced by energy security considerations. Countries seeking to reduce dependence on imported oil and gas are increasingly investing in domestic renewable energy infrastructure. Geopolitical conflicts and energy price shocks have underscored the vulnerability of traditional fossil fuel supplies. This has reinforced the urgency of diversifying energy sources to ensure stable, resilient, and locally controlled energy systems.
Key Sectors Driving the Boom
Solar Energy
Solar energy is at the forefront of the energy transition. Utility-scale solar farms and distributed rooftop installations have proliferated globally. Countries such as China, India, the United States, and Germany are leading in installed solar capacity. The combination of declining panel costs, government incentives, and the push for decentralized energy production is driving massive adoption. Innovations such as floating solar farms, solar windows, and bifacial panels are expanding the potential applications of solar technology.
Wind Energy
Wind power, particularly offshore wind, is experiencing rapid growth. Offshore wind farms offer higher and more consistent wind speeds, enabling greater energy output. Technological improvements, including larger turbines and floating platforms, are opening new regions for wind development. Europe, China, and the U.S. are investing heavily in offshore wind, with gigawatt-scale projects now feasible. Wind energy not only contributes to carbon reduction but also creates significant employment opportunities in manufacturing, construction, and maintenance.
Energy Storage and Grid Modernization
As renewable energy generation increases, so does the need for effective energy storage solutions. Batteries, pumped hydro storage, and emerging hydrogen storage technologies are essential for balancing supply and demand. Smart grid technologies, which integrate distributed energy resources, real-time monitoring, and predictive analytics, ensure efficient energy distribution. These innovations are critical to making renewable energy reliable and commercially viable.
Electric Vehicles and Electrification
The transition extends beyond power generation. Transportation, responsible for a significant share of global emissions, is undergoing electrification. Electric vehicles (EVs), supported by extensive charging infrastructure, are transforming automotive markets. Global EV sales have surged, driven by declining battery costs, government incentives, and rising consumer awareness. Electrification is also occurring in industrial processes, heating, and building systems, further boosting electricity demand from clean sources.
Hydrogen and Emerging Technologies
Green hydrogen, produced via electrolysis using renewable energy, is emerging as a key solution for decarbonizing hard-to-electrify sectors such as heavy industry, shipping, and aviation. Investments in hydrogen infrastructure, fuel cells, and storage are growing rapidly. Other emerging technologies, including carbon capture and storage (CCS) and next-generation nuclear power (e.g., small modular reactors), complement renewable energy deployment, expanding the toolbox for a sustainable energy future.
Economic and Societal Impacts
Job Creation and Industrial Growth
The energy transition boom is generating millions of jobs worldwide. Manufacturing, installation, operations, and maintenance of renewable energy assets require skilled labor. Research and development in clean technologies are fostering innovation hubs and boosting high-tech sectors. Economies embracing the transition are positioning themselves as leaders in the next industrial revolution.
Energy Access and Equity
Renewable energy offers opportunities for energy access in remote and underserved regions. Decentralized solar and wind projects can provide reliable electricity to rural communities, reducing dependence on centralized fossil-fuel grids. This contributes to socioeconomic development, education, and improved quality of life.
Market Disruption and Investment Opportunities
Traditional energy markets are being disrupted as renewable energy costs continue to fall. Fossil fuel companies are adapting by diversifying portfolios into renewables, while investors are reallocating capital toward sustainable assets. Green bonds, carbon credits, and ESG-focused investments are reshaping global finance, making sustainability a key driver of economic growth.
Challenges and Considerations
Despite its promise, the energy transition boom faces several challenges:
Intermittency of Renewable Energy: Solar and wind are weather-dependent, necessitating robust storage and grid management solutions.
Resource Constraints: The production of batteries and renewable infrastructure requires critical minerals such as lithium, cobalt, and rare earth elements, creating supply chain challenges.
Policy and Regulatory Uncertainty: Inconsistent policies and subsidies can slow investment and deployment.
Social and Environmental Concerns: Large-scale renewable projects must navigate land use, ecological impacts, and community acceptance.
The Future Outlook
The energy transition boom is expected to accelerate in the coming decades. Analysts predict that renewables could supply more than 50% of global electricity by 2050, with electrification of transport and industry driving further demand. Digitalization, artificial intelligence, and blockchain technologies will enhance grid management, energy trading, and efficiency. Investment in hydrogen, carbon removal, and advanced nuclear will provide complementary solutions for a fully decarbonized energy system.
In conclusion, the energy transition boom represents a historic opportunity for humanity to redefine how we produce, distribute, and consume energy. It is driven by environmental imperatives, economic incentives, technological innovation, and societal demand for sustainable growth. While challenges remain, the momentum is undeniable. Countries, corporations, and individuals who embrace this transformation stand to benefit from cleaner energy, economic growth, job creation, and long-term resilience. The energy transition is not just a shift in power—it is a paradigm shift that promises to reshape our economies, societies, and planet for generations to come.