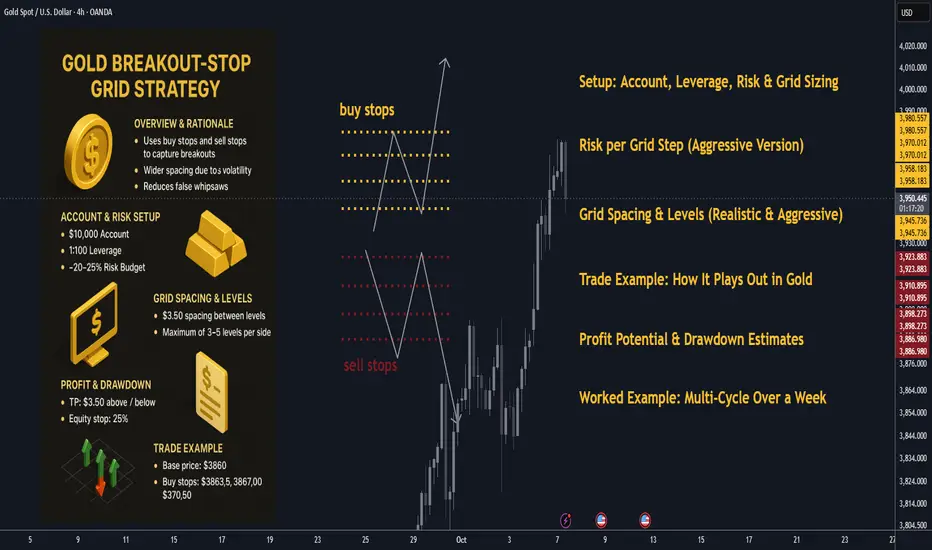
Gold Grid Trading Overview: Effective Strategy for 20% gains🪙 Gold Breakout-Stop Grid Strategy: Overview & Rationale
Grid trading is often built using limit orders above and below a base price, expecting the market to oscillate and capture many small profits. But in a strongly trending or volatile asset like gold, there is often breakout momentum that drives price through grid zones rather than bouncing.
By instead using buy stops above and sell stops below (i.e. breakout triggers), you capture directional thrusts, while still retaining a grid structure (i.e. multiple layers). Think of it as a hybrid between a breakout strategy and a grid.
Key advantages in gold:
• ✨ Gold often exhibits strong trending phases, with momentum after breakouts of supply/demand zones.
• 📊 Volatility is higher than many forex pairs, so you can space your grid more widely, reducing overcrowding.
• 🎯 With breakout stops, you reduce “false bounce” whipsaws inside the range; only when momentum validates do you trigger entries.
Risks / caveats:
• ⚠️ If price doesn’t break strongly and whipsaws, you could trigger and then reverse, creating drawdown.
• 📉 In a sideways gold market, fewer breakouts may be triggered, lowering trade frequency.
• 🛡 You must carefully size exposure and use drawdown controls, especially with leverage.
I’ll now walk through how to set this up, with gold-tailored specifics and sample trades (with increased aggressiveness), using realistic current spot prices (≈ $3,862) Investing.com.
________________________________________
🧮 Setup: Account, Leverage, Risk & Grid Sizing
📋 Account & Leverage
• Account size: $10,000
• Leverage: 1:100
• This means your maximum notional exposure is huge but margin and maintenance rules will limit you.
• We’ll now risk ~20–25%+ of equity in an aggressive version of this system (in order to aim for 20-30% weekly), i.e. $2,000–$2,500 at most drawdown limit for a grid run.
Note: This is very aggressive and only for demonstration. Many traders would never risk this much per grid.
💰 Risk per Grid Step (Aggressive Version)
• Let’s target $50 risk per triggered order (instead of $10) so that each step is meaningful.
• That means if a triggered order goes adverse by its maximum “stop zone,” your loss is $50.
• If you trigger, say, 5 steps, that’s $250 worst case on that direction (if all hit adverse).
• You must still cap total drawdown (e.g. 25% or $2,500) and limit exposures.
📈 Gold Contract & Price Movements
• Spot gold (XAU/USD) currently trades about $3,862.74 Investing.com.
• Let’s assume a contract specification such that 1 standard lot gives $100 per $1 move (so $1.00 move = $100) — a common ballpark in retail gold CFDs.
• Then:
• A move of $0.01 = $1 (for 1 lot).
• Therefore, if you trade 0.50 lots, a $1 move = $50.
So with this, to get ~$50 risk per $1 adverse move, 0.50 lots is a candidate (because $1 adverse × 0.50 lots × $100/lot = $50).
You can scale lot sizes accordingly.
📏 Grid Spacing & Levels (Realistic & Aggressive)
Given gold’s volatility, use wider spacing. Let’s choose:
• Grid spacing = $3.50 between successive triggers (a robust distance).
• We’ll place buy stops and sell stops relative to a base zone around current spot.
Let’s pick base ~ $3,860 as our pivot.
So:
• Buy stops: $3,863.50, $3,867.00, $3,870.50, $3,874.00, $3,877.50
• Sell stops: $3,856.50, $3,853.00, $3,849.50, $3,846.00, $3,842.50
(Max 5 levels each side, but you may cap to 3–5.)
Take Profit / Exit Logic:
• Target profit per trade = $3.50 (same as spacing).
• Thus one successful step = $3.50 × lot_size × $100.
• If lot_size = 0.50 lots, $3.50 × 0.50 × $100 = $175 profit per triggered trade.
• If you get 3 successful triggers in a run: 3 × $175 = $525 gross.
• That’s 5.25% on $10,000 in one clean directional run (before commissions/slippage).
You see the scaling is now aggressive — you risk more per step, but also gain more per successful trade. Limit how many triggers you allow (e.g. max 3–4 per side) to cap exposure.
Define a hard equity stop: e.g. if floating drawdown > 25% ($2,500), close all and reset.
________________________________________
🧭 Trade Example: How It Plays Out in Gold (Realistic Prices & Aggression)
We’ll do two detailed scenarios. This time we target higher returns, with real price zones.
________________________________________
🎯 Scenario A: Bullish Breakout
Base price: ~$3,860 (spot)
Buy stops: $3,863.50, $3,867.00, $3,870.50
Sell stops: $3,856.50, $3,853.00, $3,849.50
Lot sizing: 0.50 lots per order (so $3.50 adverse = $175 risk).
TP per trade: +$3.50
Sequence:
1. Gold climbs and breaks $3,863.50 → triggers Buy #1 at 3,863.50
o TP at 3,867.00 → profit if reached = ($3.50 × 0.50 × $100) = $175
2. Momentum continues, price breaks 3,867.00 → triggers Buy #2 there
o TP at 3,870.50 → another $175
3. Price surges, breaks 3,870.50 → triggers Buy #3 → TP = 3,874.00 → +$175
If all three succeed: Gross = $525 (5.25% gain) in one directional move.
If you allow up to 4 or 5 levels, total can scale to ~$700–900 (7–9%) in a strong move — if all hits. If reversal? If price reverses after buy #2, or before buy #3, you can:
• Close open longs immediately when opposite side’s sell stop triggers.
• Or cancel further buy stops once a reversal signal appears.
• Or net positions (if your broker supports hedging) — but that adds complexity.
Better to disable opposite side (sell stops) after the first buy triggers, to avoid collision exposures.
________________________________________
🔻 Scenario B: Bearish Breakout
Same base zone. Now price breaks downward.
• Sell stops at: 3,856.50, 3,853.00, 3,849.50
• TP each = –$3.50 from entry.
Sequence:
1. Gold breaks 3,856.50 → Sell #1 → target 3,853.00 → profit $175
2. Continues down, breaks 3,853.00 → Sell #2 → target 3,849.50 → +$175
3. Breaks 3,849.50 → Sell #3 → target 3,846.00 → +$175
If all three succeed: $525 profit.
If you allowed 4 levels: e.g. break 3,846.00 next → target 3,842.50 → +$175 more → total $700. Again, reversal risk must be managed.
________________________________________
📊 Mixed / Whipsaw Scenario
Suppose price crosses above $3,863.50 → triggers Buy #1, moves a bit, then reverses and crosses down through 3,856.50, triggering Sell #1.
You now hold:
• Long from $3,863.50 (losing)
• Short from $3,856.50 (potential profit)
This is a collision. To avoid chaotic risk:
• Cancel all opposite-side stops when first side triggers.
• Or immediately close all on first collision signal.
• Or lock in partial profit/loss and pause grid until trend clarity returns.
That’s why many breakout-grid strategies disable the opposite direction after first breakout.
________________________________________
📈 Profit Potential & Drawdown Estimates (Aggressive Model)
Let’s simulate one clean grid run (bullish) where 3 steps succeed fully:
• Gross profit = $525
• If you risked 3 steps * $175 = $525, worst-case these same 3 steps lose you $525 (if all adverse)
• Net = +5.25% in one run
• If you manage 2–3 such runs per week (if market allows), theoretically 10–15%+ weekly is possible — but that is optimistic.
However, in real life, not all runs will hit all targets — sometimes partial, sometimes losses. A drawdown of 25% ($2,500) is your cap boundary.
With that, if you undergo 5 bad runs in a row, you’d hit your equity stop.
If average win per run is $400 and average loss per bad run is $500, you need a favorable win-loss ratio to hit ~20–30% weekly. This is extremely aggressive.
________________________________________
🔁 Adaptive Mechanics & Enhancements (for robustness)
To improve consistency and manage risk, add:
• 📐 ATR-based spacing: Use a 14-period ATR on H4 or D1 to set grid spacing. If ATR = $4, spacing = $4 or $5.
• 📈 Trend filter: Only open buy-side grids when price > 200-period MA (H4 or D1), or only open sell-side when price < MA. Prevent fighting trend.
• 🚫 Volatility filter / news blocks: Do not place or trigger near major gold-related news (Fed, CPI, central bank announcements).
• 🔄 Grid rebase / reset: After a winning cycle, re-center grid around new price and restart stop orders.
• 📈 Scaling rules:
– Aggressive scaling: after n consecutive wins, increase lot size (within risk caps).
– Defensive scaling: after a loss, reduce lot size or skip grid.
• 🛑 Equity-stop / margin cap: If floating drawdown > 25% or margin usage > 80%, close all and reset.
• 🧊 Cooldown periods: After a loss or big run, pause grid orders for some hours/days to let market settle.
________________________________________
🧮 Worked Example: Multi-Cycle Over a Week (Aggressive)
Say you run 3 grid cycles in a week under trending conditions:
Cycle Direction Steps hit Gross profit Net (after one partial loss)
1 Up 3 out of 4 levels hit fully +$525 +$490 (small drawdown on partial)
2 Down 2 of 3 hit, 1 reversed +$350 +$320
3 Up 4 levels hit fully +$700 +$700
Total gross = $525 + $350 + $700 = $1,575
Net after adjustments/slippage ~ $1,450–$1,500
That’s ~ 14.5% gain in one week.
If the market is more favorable, you may hit ~20–30%, but the risk is commensurate.
Over multiple weeks the compounding is powerful — but a few big losses can wipe gains.
________________________________________
✅ Summary & Implementation Tips
• Use breakout stops (buy stops above, sell stops below) instead of limits to catch directional thrusts in gold.
• Wider grid spacing (e.g. $3–$5) is essential to survive volatility.
• Lot sizing must match your desired risk per step (here $50).
• Limit max triggers per direction and enforce a hard equity stop (e.g. 25%) to avoid blow-ups.
• Employ trend / volatility filters to filter low-probability entries.
• After a net winning run, rebase grid to current price.
• Use scaling and cooldown mechanics to moderate aggression.
• On collision signals, cancel opp side stops or close everything to avoid contradictory exposures.
Harmonic Patterns
Commodities: The Pulse of Global TradeIntroduction: The Lifeblood of Global Trade
Commodities are the foundation of global trade, the building blocks upon which the modern economy thrives. From crude oil powering industries to gold backing currencies, and agricultural goods feeding nations — commodities shape economic policies, influence geopolitics, and drive the rhythms of international commerce.
The global commodity market is a vast and dynamic ecosystem where raw materials are bought, sold, and traded across borders. It serves as a vital link between producers (countries rich in natural resources) and consumers (industrialized economies and emerging markets).
Understanding this market is crucial because fluctuations in commodity prices can make or break national economies, impact inflation, shape trade balances, and even alter political relationships.
1. What is the Commodity Market?
A commodity market is a place where raw materials or primary products are exchanged. These are typically divided into two main categories:
Hard Commodities: Natural resources that are mined or extracted — such as crude oil, natural gas, gold, silver, copper, and iron ore.
Soft Commodities: Agricultural or livestock products that are grown or raised — including wheat, corn, coffee, cotton, sugar, and soybeans.
The trading of these commodities happens both in physical form (actual goods being delivered) and financial form (through futures, options, and derivatives contracts).
Commodities are the first stage of production — they feed into industries like energy, manufacturing, construction, and consumer goods. As such, they reflect global economic health and industrial demand.
2. The Structure of Global Commodity Markets
Global commodity trading is facilitated through organized commodity exchanges, which act as platforms for price discovery and standardization. Some of the most influential commodity exchanges include:
New York Mercantile Exchange (NYMEX) – USA (for crude oil, natural gas, and metals)
Chicago Board of Trade (CBOT) – USA (for grains, soybeans, and other agricultural products)
London Metal Exchange (LME) – UK (for base metals like copper, zinc, and aluminum)
Intercontinental Exchange (ICE) – Global (for energy and soft commodities)
Multi Commodity Exchange (MCX) – India (for energy, metals, and agri commodities)
Shanghai Futures Exchange (SHFE) – China (for metals and energy)
These exchanges operate as transparent markets where prices are determined by supply and demand dynamics, speculation, hedging activities, and global economic indicators.
3. The Role of Commodities in Global Trade
Commodities are the building blocks of the world economy. Their importance in global trade can be understood in multiple ways:
a) Driving Economic Growth
Commodity exports are the primary source of revenue for many developing and resource-rich countries. For example:
Oil accounts for over 90% of export revenue in nations like Saudi Arabia and Nigeria.
Agricultural commodities dominate the exports of Brazil and Argentina.
Metals and minerals are key exports for Australia, Chile, and South Africa.
b) Enabling Industrialization
Industrial economies like China, the US, and Germany rely heavily on importing raw materials to fuel their manufacturing sectors. Without commodity imports, their industrial engines would stall.
c) Influencing Currency and Inflation
Commodity prices directly affect inflation rates and currency valuations. For instance:
A surge in oil prices increases transportation costs, leading to global inflation.
Commodity-exporting nations’ currencies (like the Canadian Dollar and Australian Dollar) often rise with higher global commodity prices.
d) Powering Global Supply Chains
Every major global supply chain — from food production to electronics — begins with commodities. For example:
Copper and lithium are crucial for electric vehicles and renewable energy infrastructure.
Wheat and corn are essential for global food security.
4. Factors Influencing Commodity Prices
Commodity markets are known for their volatility, driven by a complex web of factors:
a) Supply and Demand
This is the core driver. When demand exceeds supply (as seen in post-pandemic recoveries), prices surge. Conversely, when oversupply hits the market, prices fall sharply.
b) Geopolitical Tensions
Conflicts, trade sanctions, and political instability can disrupt supply chains. For example:
The Russia–Ukraine war affected wheat and crude oil supplies.
Sanctions on Iran influenced global oil markets.
c) Climate and Weather Conditions
Agricultural commodities are heavily influenced by climate. Droughts, floods, or hurricanes can devastate crop yields and spike prices for grains, coffee, or cotton.
d) Technological Developments
Innovation in extraction and farming methods can improve supply. For instance, the shale revolution in the US transformed it into a major oil exporter, altering global energy dynamics.
e) Speculation and Investment
Institutional investors and hedge funds actively trade commodities as an asset class. Large inflows of speculative money can amplify price movements.
f) Currency Fluctuations
Since most commodities are priced in US dollars, a strong dollar makes them more expensive for other countries, reducing demand and impacting prices globally.
5. The Global Commodity Supercycles
A commodity supercycle refers to a prolonged period of rising or falling prices driven by structural shifts in global demand and supply.
Historically, there have been several notable supercycles:
1950s–1970s: Post-war reconstruction in Europe and industrial expansion in Japan.
2000s: China’s rapid industrialization and infrastructure boom drove massive demand for metals and energy.
2020s (Emerging): The green energy transition is creating new demand for copper, lithium, and rare earth metals.
Each cycle has reshaped global trade flows and altered the balance of power between resource-rich and manufacturing nations.
6. The Role of Developing Nations in Commodity Trade
Developing countries are the main suppliers of global commodities, while developed nations are the primary consumers. This dynamic defines much of global trade.
a) Resource Dependency
Many developing nations rely heavily on commodity exports for government revenue and employment. However, this dependence can lead to vulnerability — known as the “resource curse” — where economic instability follows commodity price fluctuations.
b) Trade Imbalance
Commodity-rich nations often face trade imbalances due to their reliance on exporting raw materials while importing finished goods, trapping them in low-income cycles.
c) Diversification and Industrialization
To reduce this dependency, many emerging economies are now focusing on value addition, investing in refining, processing, and manufacturing to capture higher margins within the global supply chain.
7. Commodity Derivatives and Financialization
The evolution of commodity derivatives has transformed global trade by enabling participants to manage risk.
a) Futures Contracts
These allow buyers and sellers to lock in prices for future delivery, providing price certainty and stability in volatile markets.
b) Options and Swaps
These instruments allow traders to speculate on or hedge against price fluctuations without directly owning the physical commodity.
c) The Rise of Financial Investors
Banks, hedge funds, and ETFs have turned commodities into an investment asset class, linking them more closely to global financial markets. While this enhances liquidity, it also increases price volatility.
8. The Impact of Technology and Sustainability
The commodity market is undergoing a transformation driven by technological innovation and sustainability concerns.
a) Digitalization and Blockchain
Blockchain technology is enhancing transparency in commodity trading by creating secure, tamper-proof records of transactions. This reduces fraud and improves trust between buyers and sellers.
b) Automation and AI
AI and big data analytics are helping traders predict price trends, manage risks, and optimize logistics and supply chain operations.
c) Green Transition
The global shift toward renewable energy is reshaping demand for commodities:
Oil and coal demand may decline, while lithium, cobalt, and nickel demand surges for battery production.
Renewable infrastructure requires vast amounts of copper and aluminum.
Sustainability is now at the core of commodity trade, pushing producers to adopt eco-friendly practices.
9. Challenges in the Global Commodity Market
Despite its central role, the global commodity market faces numerous challenges:
Price Volatility: Unpredictable price swings disrupt planning for producers and consumers alike.
Supply Chain Disruptions: Wars, pandemics, and trade restrictions can halt the flow of goods.
Environmental Concerns: Mining and extraction often damage ecosystems, sparking global protests.
Economic Inequality: Resource wealth often benefits elites, not the broader population.
Policy and Regulatory Risks: Sudden government interventions, export bans, or taxation changes affect stability.
These challenges underline the need for resilient, transparent, and sustainable commodity trading systems.
10. Future Outlook of the Global Commodity Market
The future of commodities is intertwined with global megatrends — climate change, technological innovation, population growth, and geopolitical realignments.
a) Green Commodities Will Dominate
With the rise of electric vehicles, renewable energy, and decarbonization efforts, the demand for green metals like lithium, nickel, and copper will skyrocket.
b) Digital Commodity Exchanges
Digital platforms will make global trading more accessible, efficient, and transparent — benefiting small traders and emerging markets.
c) Strategic Resource Alliances
Nations will form alliances to secure access to critical minerals, leading to “resource diplomacy” becoming as vital as military or trade diplomacy.
d) Climate Risk Integration
Commodity prices will increasingly factor in climate risks, such as carbon footprints, water usage, and environmental impact.
e) Sustainable Investing
Institutional investors will favor ESG-compliant (Environmental, Social, and Governance) commodity producers, reshaping investment flows.
Conclusion: Commodities as the Pulse of the World Economy
The global commodity market is not just about trade—it’s about survival, growth, and balance. It powers industries, feeds populations, and fuels innovation. Every price movement in oil, gold, or grain ripples through the world economy, influencing policies, investments, and livelihoods.
In essence, commodities are the pulse of global trade, reflecting humanity’s evolving relationship with nature, technology, and economics. As the world transitions toward a green and digital future, the role of commodities will remain central — not just as resources, but as strategic instruments shaping the destiny of nations and the direction of global commerce.
Research Shows That Trading Harmonic Pattern Could Improve IQ. Hey everyone, in this video, I broke down a fantastic trading setup on the EUR/USD pair using harmonic patterns. I love trading harmonics because it constantly challenges your IQ and makes you a smarter, more analytical trader.
I focused on my three-step framework that I apply to any pair:
Key Level: First, I identified a crucial order block on the higher time frame (weekly). This is our potential reversal zone.
Harmonic Pattern: Next, I moved to the 4-hour and daily charts to find a harmonic pattern aligned with that key level. I found a beautiful bearish Butterfly pattern. It's crucial to match the pattern with the trend—since the overall structure was bullish, we looked for an extension pattern (like the Butterfly) into the key level, not a retracement pattern.
Liquidity Sweep & Entry: The final step was confirming the setup. We waited for a liquidity sweep (a break of the Previous Daily High - PDH) and then a close below a key bullish candle. Entry is on the retest of that break, with a stop loss placed just above the key level.
I showed how the Fibonacci measurements (the 1.272 and 2.0 extensions) converged perfectly in the Potential Reversal Zone (PRZ), making it a high-probability trade. We also discussed profit targets and how to manage the trade by moving stop losses to maximize profits.
This exact same process is what I've used successfully on pairs like GBP/JPY, USD/JPY, and indices like the German 40. It's a structured, repeatable method that filters out market noise.
If you have any questions, drop them in the comments below! Don't forget to like, subscribe, and watch out for more videos like this.
Happy trading!

How Sustainable is Finance?1. The Current Financial System and Sustainability
The traditional financial system has largely been designed around profit maximization and short-term returns. Banks, investment funds, insurance companies, and capital markets operate primarily on the principles of risk and reward. While these principles have driven remarkable economic growth over the past century, they often overlook long-term environmental and social costs. Examples include:
High carbon investments: Fossil fuel companies continue to receive substantial financing despite their contribution to climate change.
Resource-intensive industries: Mining, agriculture, and industrial manufacturing often rely on practices that degrade ecosystems and deplete natural resources.
Short-termism: Many investors prioritize quarterly earnings or immediate stock performance over long-term value creation and sustainability.
This short-term focus creates systemic risks. For instance, climate-related disasters, resource shortages, and social unrest can destabilize markets, affect asset values, and create financial crises. Sustainable finance seeks to internalize these externalities into the investment and lending decision-making process.
2. Environmental, Social, and Governance (ESG) Integration
ESG integration is central to sustainable finance. ESG refers to three key criteria that guide responsible investment decisions:
Environmental (E): Companies are assessed on their impact on the environment, including carbon emissions, energy consumption, water use, and waste management. Financial institutions increasingly track these metrics to identify climate-related risks and opportunities.
Social (S): Social factors include labor rights, human capital development, diversity, community engagement, and supply chain management. Companies that neglect social responsibility face reputational damage, legal challenges, and declining customer loyalty.
Governance (G): Governance encompasses transparency, ethical leadership, board diversity, shareholder rights, and anti-corruption measures. Strong governance reduces operational risks and fosters sustainable corporate performance.
The rise of ESG-focused funds, green bonds, and impact investing demonstrates the growing recognition that sustainability is not merely a moral obligation but a financial imperative. For instance, firms with high ESG ratings often experience lower cost of capital, reduced volatility, and better long-term financial performance.
3. Green Finance and Sustainable Investment Vehicles
Green finance has emerged as a powerful mechanism to drive sustainability. It channels funds toward projects that have positive environmental or social outcomes. Key instruments include:
Green bonds: Debt instruments issued to fund projects with environmental benefits, such as renewable energy, waste management, or climate-resilient infrastructure.
Sustainability-linked loans: Loans with interest rates tied to the borrower’s achievement of sustainability targets.
Impact investing: Investments explicitly intended to generate measurable social or environmental benefits alongside financial returns.
Carbon trading and offsets: Financial mechanisms that allow companies to offset emissions by funding projects that reduce carbon elsewhere.
The adoption of these tools indicates a shift in market norms. Global green bond issuance, for example, grew exponentially from under $11 billion in 2013 to over $600 billion by 2022. This reflects both regulatory pressure and investor demand for climate-aligned investments.
4. Regulatory and Policy Drivers of Sustainable Finance
Governments and international bodies play a crucial role in ensuring financial sustainability. Policies and regulations are increasingly designed to align financial flows with sustainable development objectives. Key initiatives include:
European Union Sustainable Finance Disclosure Regulation (SFDR): Requires asset managers to disclose ESG risks and impacts in investment products.
Task Force on Climate-related Financial Disclosures (TCFD): Encourages companies and investors to report climate-related financial risks and strategies.
Central bank policies: Some central banks integrate climate risk into stress tests and lending criteria to safeguard financial stability.
Such measures help internalize environmental and social risks into the financial system. They also reduce greenwashing—the practice of misrepresenting the sustainability of financial products—and ensure that capital allocation aligns with long-term societal goals.
5. Challenges to Sustainability in Finance
Despite progress, several challenges hinder the full integration of sustainability in finance:
Measurement and reporting gaps: ESG data can be inconsistent, opaque, or difficult to compare across companies and regions.
Short-term incentives: Many financial institutions still operate under performance metrics that reward immediate returns rather than long-term resilience.
Market fragmentation: Lack of standardization in ESG ratings, green bonds, and impact metrics creates confusion for investors.
Trade-offs: Some projects may offer environmental benefits but create social or governance risks, requiring careful balancing.
Greenwashing: Companies and funds may exaggerate sustainability claims to attract capital, undermining credibility.
Addressing these challenges requires stronger regulation, improved data standards, education, and cultural shifts within financial institutions.
6. Financial Technology (FinTech) and Sustainability
FinTech is reshaping the sustainability landscape. Digital platforms, AI, blockchain, and big data allow for better risk assessment, monitoring, and reporting of ESG metrics. Examples include:
Blockchain for transparency: Tracking carbon credits or sustainable supply chains to prevent fraud.
AI-powered ESG analysis: Algorithms that analyze sustainability reports, news, and social media to provide real-time ESG scores.
Crowdfunding for sustainable projects: Enabling small investors to fund renewable energy, circular economy, and social impact initiatives.
FinTech innovations democratize access to sustainable finance and accelerate the adoption of ESG principles across the global financial system.
7. The Role of Investors and Society
Sustainability in finance is not only a matter of regulation or technology—it also depends on investor behavior. Institutional and retail investors increasingly demand responsible investing options. Key trends include:
Millennial and Gen Z investors: Younger generations prioritize sustainability and ethical investment, influencing asset allocation decisions.
Active stewardship: Investors engage with companies to improve ESG performance, voting on shareholder resolutions and participating in governance.
Divestment movements: Divesting from fossil fuels or unethical industries sends market signals that influence corporate behavior.
Ultimately, the collective actions of investors can incentivize companies to adopt sustainable practices, thereby enhancing financial system resilience.
8. The Interconnection Between Financial Stability and Sustainability
Sustainable finance is intertwined with broader economic stability. Climate change, social inequality, and environmental degradation are not just ethical issues—they are financial risks. Extreme weather events, resource scarcity, and social unrest can trigger market volatility, supply chain disruptions, and capital flight. By integrating sustainability, finance can:
Mitigate systemic risks: Reducing exposure to climate and social shocks.
Enhance resilience: Companies with strong ESG practices tend to recover faster from crises.
Promote long-term value creation: Sustainable investments align economic growth with environmental and social goals.
This perspective reframes sustainability from a “cost” to a strategic advantage, emphasizing its role in ensuring a stable and robust financial system.
9. Case Studies and Global Examples
Norway’s Sovereign Wealth Fund: Actively divests from companies with poor ESG practices, illustrating responsible national-level investment.
UN Principles for Responsible Investment (PRI): Over 4,000 signatories manage over $120 trillion in assets, committing to integrate ESG into investment decisions.
China’s Green Finance Initiative: Rapid growth in green bonds and sustainable lending to support carbon neutrality targets by 2060.
These examples highlight how policy, investor behavior, and institutional strategies can collectively drive financial sustainability.
10. Conclusion
Finance today stands at a critical juncture. Traditional profit-centric models are increasingly inadequate in addressing global environmental and social challenges. Sustainable finance is not merely a trend—it is an essential evolution to align economic growth with planetary and societal limits. While challenges remain—such as standardization, reporting, and greenwashing—the rise of ESG integration, green bonds, impact investing, and regulatory frameworks demonstrates that the financial system can become more sustainable.
Sustainability in finance ultimately depends on collaboration among policymakers, investors, financial institutions, and society at large. By internalizing environmental and social risks, promoting long-term thinking, and leveraging technological innovation, finance can evolve into a system that not only generates wealth but also safeguards the world for future generations. In essence, sustainable finance is no longer optional—it is a prerequisite for the resilience, stability, and ethical legitimacy of the global financial system.

Startups Reshaping the Global Market1. The Rise of Startups: An Overview
Historically, innovation was primarily the domain of large corporations and research institutions. However, over the past two decades, the entrepreneurial landscape has shifted dramatically. Several factors have contributed to the meteoric rise of startups:
Technological democratization: The proliferation of cloud computing, mobile technology, artificial intelligence, and blockchain has lowered the barriers to entry for new ventures. Entrepreneurs can now build sophisticated products with limited capital.
Access to capital: Venture capital firms, angel investors, and crowdfunding platforms have emerged as powerful engines of startup growth. Global investment in startups has grown exponentially, enabling ambitious ideas to scale quickly.
Global connectivity: The internet and digital platforms allow startups to reach global audiences instantly, bypassing traditional geographic limitations.
Changing workforce dynamics: Millennials and Gen Z are more inclined toward entrepreneurial ventures, valuing flexibility, creativity, and purpose over conventional employment.
This environment has produced a surge in startups capable of challenging market incumbents and introducing disruptive innovations at unprecedented speed.
2. Disruption Across Sectors
A. Financial Technology (FinTech)
One of the most prominent areas of startup-driven disruption is the financial sector. FinTech startups have fundamentally altered the way people save, invest, borrow, and transact:
Digital payments and banking: Companies like Stripe, PayPal, and Revolut offer seamless digital payment solutions, reducing reliance on traditional banks. In emerging markets, mobile-based payment platforms like M-Pesa have revolutionized access to financial services.
Investment platforms: Startups like Robinhood and Zerodha democratize investing, allowing retail investors to participate in markets previously dominated by institutional players.
Cryptocurrency and blockchain: Blockchain startups such as Coinbase, Binance, and Chainalysis are redefining the concept of currency, security, and decentralized finance (DeFi).
The result is a more inclusive financial ecosystem that challenges conventional banking and payment systems.
B. Healthcare and Biotechnology
Healthcare has traditionally been slow to adopt technology due to regulatory complexities, but startups are driving profound changes:
Telemedicine: Platforms like Teladoc and Practo enable remote consultations, reducing the need for physical visits and improving access to care in remote regions.
Personalized medicine: Startups such as 23andMe and GRAIL leverage genetic data to offer personalized treatments and early disease detection.
Medical devices and diagnostics: Innovators are creating portable, AI-powered diagnostic tools that enhance efficiency and reduce costs.
These startups are not only improving patient outcomes but also creating entirely new healthcare delivery models.
C. Transportation and Mobility
The transportation sector has undergone a radical transformation thanks to startups:
Ride-sharing and mobility-as-a-service: Uber, Lyft, and Didi Chuxing have redefined urban mobility, challenging traditional taxi services while introducing app-based convenience.
Electric vehicles and sustainable transport: Tesla, Rivian, and Nio have catalyzed the electric vehicle revolution, while startups in micromobility—like Lime and Bird—promote sustainable short-distance transportation.
Logistics and supply chain innovation: Companies like Flexport and Convoy use technology to optimize shipping, reduce costs, and improve transparency.
These innovations not only enhance convenience but also contribute to sustainability by reducing carbon footprints.
D. E-commerce and Retail
Startups have radically reshaped consumer behavior and retail structures:
Direct-to-consumer (DTC) brands: Companies like Warby Parker, Glossier, and Casper bypass traditional retail channels, connecting directly with customers online.
Marketplace platforms: Amazon, Shopify, and MercadoLibre empower smaller sellers to reach global audiences.
AI-driven personalization: Startups utilize AI to recommend products, optimize pricing, and enhance customer experience.
As a result, consumers enjoy more choices, lower prices, and personalized shopping experiences, while traditional retailers are forced to innovate or risk obsolescence.
E. Education and Skill Development
The education sector, long dominated by institutions resistant to change, is now witnessing a surge of edtech startups:
Online learning platforms: Coursera, Udemy, and Byju’s provide accessible, flexible, and often affordable education options for global learners.
Skill development and upskilling: Startups like Skillshare and Pluralsight focus on professional development, bridging the gap between academic knowledge and industry needs.
Gamification and AI-driven learning: Innovative tools adapt to individual learning patterns, making education more engaging and effective.
These startups are democratizing knowledge, enabling lifelong learning, and fostering a global talent pipeline.
F. Renewable Energy and Sustainability
Sustainability has become a crucial driver of startup activity:
Clean energy startups: Companies like Rivian, Nextracker, and Sunrun innovate in solar, wind, and battery storage technology.
Circular economy and waste management: Startups focus on recycling, waste-to-energy solutions, and reducing industrial pollution.
Carbon management platforms: Technologies that track, verify, and reduce carbon footprints are increasingly critical as regulatory frameworks tighten globally.
These ventures not only target environmental goals but also create lucrative new markets for sustainable products and services.
3. Drivers of Global Impact
Several key characteristics allow startups to reshape global markets more effectively than traditional companies:
Agility and adaptability: Startups can pivot quickly in response to market feedback, regulatory changes, or technological advancements.
Customer-centric innovation: Unlike legacy corporations bound by legacy systems, startups design products around real user needs, often delivering superior experiences.
Scalable technology: Digital platforms, cloud computing, and AI enable rapid global expansion without proportional increases in cost.
Collaborative ecosystems: Startups leverage partnerships, open-source frameworks, and global networks to accelerate innovation.
Risk tolerance: Higher tolerance for failure allows startups to experiment with bold ideas that incumbents may avoid.
4. Global Examples of Startup Influence
A. United States
The U.S. continues to be a hub for tech-driven startups:
Silicon Valley dominance: Companies like Airbnb, Stripe, and SpaceX exemplify how U.S. startups influence sectors ranging from hospitality to aerospace.
Innovation culture: A strong emphasis on entrepreneurship, venture capital availability, and a skilled workforce enables continuous market disruption.
B. Asia
Asian startups are redefining markets in their regions and globally:
China: Alibaba, Tencent, and Bytedance dominate e-commerce, social media, and entertainment, influencing consumer behavior worldwide.
India: Flipkart, Paytm, and Ola demonstrate the potential of emerging-market startups to scale rapidly while addressing local challenges.
Southeast Asia: Grab and Gojek epitomize mobility and fintech innovation tailored to regional needs.
C. Europe
Europe fosters innovation in sustainability, biotech, and deep tech:
Sustainability startups: Companies like Northvolt focus on green energy and battery production.
Fintech hubs: London and Berlin incubate fintech startups that challenge European banking norms.
Cross-border scalability: EU policies facilitate startups accessing multiple markets efficiently.
D. Emerging Markets
Startups in Africa, Latin America, and the Middle East address unique local challenges while achieving global relevance:
Fintech in Africa: M-Pesa (Kenya) revolutionized mobile banking in regions with limited financial infrastructure.
E-commerce in Latin America: MercadoLibre democratizes online shopping across the continent.
Energy innovation in the Middle East: Startups focus on solar and smart-grid technologies to address energy scarcity.
5. Economic and Social Implications
Startups’ impact on the global market is not confined to technological disruption—they also have significant economic and social consequences:
Job creation: Startups create direct employment opportunities and stimulate ancillary sectors, fostering broader economic growth.
Market competition: Disruption forces incumbents to innovate, ultimately benefiting consumers through better products and services.
Globalization: Startups accelerate the diffusion of ideas, products, and business models across borders.
Inclusivity: By targeting underserved populations or regions, startups foster greater economic inclusion.
Wealth creation: Successful startups generate significant returns for founders, employees, and investors, contributing to wealth distribution and financial dynamism.
6. Challenges and Risks
Despite their potential, startups face substantial challenges:
Funding volatility: Venture capital cycles can lead to sudden liquidity crises for startups dependent on external financing.
Regulatory hurdles: Compliance with local laws, especially in finance, healthcare, and data privacy, can slow growth.
Market saturation: High competition within startup ecosystems can lead to rapid failure rates.
Technological risks: Dependence on emerging technologies carries the risk of obsolescence or failure to achieve scalability.
Global economic shocks: Startups are often vulnerable to macroeconomic disruptions, geopolitical tensions, and supply chain volatility.
Understanding and mitigating these risks is essential for startups to achieve sustainable global influence.
7. Future Outlook
The influence of startups on global markets is poised to expand:
Artificial Intelligence and automation: Startups developing AI-powered tools will transform productivity, decision-making, and customer engagement across industries.
Climate tech and sustainability: The global push toward net-zero emissions will create vast opportunities for startups addressing energy efficiency, carbon reduction, and resource optimization.
Healthcare innovation: Advances in biotechnology, personalized medicine, and digital health will continue to redefine healthcare delivery.
Space and frontier technologies: Companies like SpaceX, Blue Origin, and emerging space startups will expand markets beyond Earth.
Global collaboration: International partnerships, cross-border incubators, and digital platforms will enable startups to scale globally faster than ever before.
Startups’ ability to rapidly experiment, innovate, and adapt positions them as crucial architects of the future economic landscape.
8. Conclusion
Startups are no longer peripheral players—they are central to the evolution of the global market. Their capacity for disruption, combined with technological innovation, global connectivity, and customer-focused strategies, allows them to challenge entrenched incumbents, redefine industries, and create new economic paradigms. While they face challenges from regulation, funding, and competition, their agility and creativity make them uniquely suited to shape the world economy in the 21st century.
In essence, startups are not just creating companies—they are creating new markets, new business models, and new ways of living and working. As they continue to scale and expand, their influence on global trade, investment, technology, and society will only grow, making them indispensable drivers of economic and social transformation.

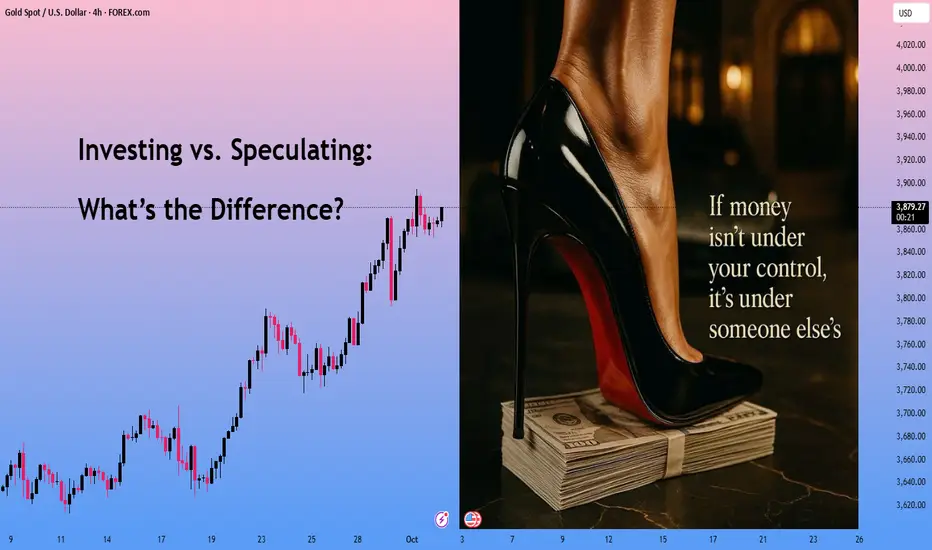
Investing vs. Speculating: What’s the Difference?Hey everyone, you’ve probably heard the words “investing” and “speculating,” but do you really know what sets them apart? Both are about putting money in to make more money, but the mindset and approach are Totally different. Let’s break it down super simply:
What’s Investing? (4 Keywords: Long-term, steady, knowledge, patience)
Investing is like a marathon—it’s about the long game, focusing on things that grow in value over time. You’re aiming for steady, lasting profits, not a quick buck.
When you invest, you do your research. You really understand what you’re putting your money into.
You use knowledge—like studying a company’s finances (FA), looking at market trends (TA), or knowing the rules of the game (FM, RM).
You stay cool-headed, not getting swept up by hype or greed.
Investing isn’t about betting everything on one big win. It’s about protecting your money first, then letting profits grow slowly.
Think of it like planting a tree: you care for it, water it, and wait patiently for the fruit.
For example , let’s say you research a solid real estate deal. You believe a piece of land will grow in value over 3–5 years because it’s in a great spot with new roads being built. You buy it, hold on, and later sell it for a profit. Or you keep it, build a house, or rent it out for monthly cash while owning something valuable.
Investing like this isn’t fazed by short-term ups and downs—it’s all about the long-term payoff.
What’s Speculating? (4 Keywords: Short-term, fast, risky, flexible)
Speculating is like surfing—you jump in to catch a quick wave and make money fast by riding short-term price changes.
You know the term “riding the wave”? That’s it! You need waves to surf, right? If there’s no wave, you’re stuck.
Speculating works the same: it’s a bit daring, and you have to be ready to lose.
When you see a chance, you dive in fast or cut your losses quickly if things go wrong.
For example , back in the day, I got hyped up when Elon Musk tweeted about SHIBA coin. I jumped in, my money shot up 10 times in a short time, and I sold fast. Good thing, because the price crashed right after! If I hadn’t moved quickly, my account would’ve been wiped out.
Speculating is all about quick moves—”buy the rumors, sell the news”, and cashing in on the hype. It’s not about long-term value; it’s about grabbing profits fast. But it’s way riskier, and you can lose everything if you’re not sharp. Knowing when to stop is super important.
So, What’s the Key Difference?
Investing is all about patience.
Speculating is about being quick and flexible.
Someone asked me: “If I trade short-term but do research, is that investing?” Awesome question! But even with research, short-term trading is usually called speculating.
Why?
Because it’s focused on fast profits and higher risks, unlike the steady, long-term foundation of investing.
If you trade short-term with a solid plan, that’s cooler—pros call it systematic trading, way better than just guessing. But in general, short-term moves are still seen as speculating, not investing, because they don’t have that long-term vision.
Investing without a plan? That’s just gambling. (Investing + No plan = Gambling)
Speculating with a strategy? You’re thinking like a smart entrepreneur. (Speculating + Strategy = Entrepreneur)
Whether investing or speculating is better depends on you—your style and your game plan!
That said, choosing between investing and speculatingsometimes depends on each person's position. I’ll share more details in my next video.
If you agree with my opinion, drop a comment here!
I’m Anfibo , just sharing what I know about finance.
Exploiting Closing vs Opening Price Gaps Across Regions1. Introduction
In global financial markets, one of the most intriguing phenomena observed by traders is the price gap between the previous day’s closing price in one region and the opening price in another. These gaps present opportunities for informed traders to anticipate price movements, hedge positions, and exploit short-term volatility. Understanding the mechanics of these gaps, their underlying causes, and the strategies to trade them is essential for both institutional and retail investors aiming to optimize returns in a highly interconnected market.
Price gaps occur due to various factors: geopolitical events, overnight news, earnings announcements, macroeconomic data, and liquidity mismatches. By analyzing historical data and employing structured trading strategies, traders can turn these gaps into actionable insights.
This article delves into the nature of closing vs opening price gaps, the drivers behind them, the strategies used to exploit them across different regions, and practical considerations for risk management.
2. Understanding Closing vs Opening Price Gaps
2.1 Definition of Price Gaps
A price gap occurs when an asset’s opening price significantly differs from the previous day’s closing price. These gaps can be either:
Up Gap: Opening price is higher than the previous close.
Down Gap: Opening price is lower than the previous close.
2.2 Types of Gaps
Common Gaps:
Often occur in quiet markets without major news. Typically filled quickly within the same trading session.
Breakaway Gaps:
Form when the market breaks a significant support/resistance level. Often precede sustained trends.
Runaway (Continuation) Gaps:
Appear during strong trending moves, confirming the momentum.
Exhaustion Gaps:
Occur near the end of a trend, signaling potential reversals.
2.3 Relevance Across Global Markets
Due to time zone differences, markets in Asia, Europe, and North America open and close at different times. For example:
Asian markets: Tokyo, Hong Kong, and Singapore operate roughly between 9:00–16:00 local time.
European markets: London and Frankfurt operate roughly 8:00–16:30 GMT.
US markets: NYSE and NASDAQ operate 9:30–16:00 EST.
Price gaps often reflect overnight developments in one region that impact the opening of another. This inter-market influence creates exploitable arbitrage opportunities.
3. Causes of Closing vs Opening Price Gaps
3.1 Overnight News and Events
Economic data releases, geopolitical developments, and corporate news can significantly shift investor sentiment between market closes. For example:
An unexpected US Federal Reserve interest rate change can trigger large opening gaps in Asian and European indices.
Earnings announcements released after US market close can affect European stocks the following day.
3.2 Currency Movements
In a globalized market, currency fluctuations often precede stock price adjustments across regions. For instance:
A sharp USD appreciation overnight can depress commodity-related stocks in Europe and Asia.
Emerging market equities denominated in local currencies are impacted by overnight forex volatility.
3.3 Liquidity and Market Participation
Different regions have varying levels of liquidity at different times:
Asian markets may close with low trading volumes in certain assets, leading to larger overnight gaps when European or US markets open.
Thin liquidity amplifies price swings, creating exploitable gaps.
3.4 Market Sentiment and Technical Levels
Price gaps are often exacerbated by technical triggers, such as:
Breakout above key resistance levels in one market.
Oversold or overbought conditions causing momentum-driven gaps at market open.
4. Strategies to Exploit Price Gaps Across Regions
4.1 Gap-Fill Strategy
Concept: Many gaps tend to "fill," meaning the price moves back to the previous close over the next few hours or days.
Steps:
Identify significant overnight gaps using pre-market data.
Evaluate news and sentiment to determine the likelihood of gap fill.
Enter a trade in the direction opposite to the gap.
Example:
If S&P 500 futures show a 1% down gap overnight due to weak Asian data, but no major US fundamentals changed, a trader may anticipate a partial recovery after the US market opens.
4.2 Momentum Gap Trading
Concept: Some gaps indicate strong momentum, and trading in the gap’s direction can be profitable.
Steps:
Confirm gap accompanied by high pre-market volume or strong news catalyst.
Trade in the direction of the gap after the market opens.
Set tight stop-losses to protect against reversals.
Example:
A positive earnings report from a major tech company may cause a European market to open significantly higher. Traders may ride the momentum early in the session.
4.3 Arbitrage Across Regions
Concept: Price differences between regional markets for the same asset or index create arbitrage opportunities.
Steps:
Track closing prices in one region and opening prices in another.
Identify statistically significant gaps exceeding normal volatility.
Take offsetting positions in correlated assets or derivatives.
Example:
If the Nikkei closes sharply down but US futures are up, a trader can exploit the relative price mismatch using ETFs or futures contracts.
4.4 Pre-Market and Post-Market Futures Trading
Futures markets often remain open when cash markets are closed, providing a predictive view of opening gaps.
Steps:
Analyze overnight futures data.
Compare futures with previous day’s close.
Anticipate opening gaps and place orders accordingly.
Advantages:
Provides a leading indicator for the cash market.
Reduces reaction time to overnight news.
Conclusion
Exploiting closing vs opening price gaps across regions is a sophisticated strategy requiring an understanding of global market interconnectivity, macroeconomic factors, and technical analysis. Traders can leverage these gaps through gap-fill strategies, momentum trading, cross-region arbitrage, and futures-based pre-market positioning.
Successful exploitation demands:
Strong analytical skills
Risk management discipline
Awareness of market hours, liquidity, and regional nuances
Access to high-quality, real-time data
By combining quantitative analysis with practical insights, traders can turn global price gaps into profitable opportunities while navigating the inherent volatility of interconnected financial markets.
Globalization and De-GlobalizationPart I: Understanding Globalization
1. The Concept of Globalization
Globalization is the process through which countries and societies become more connected through trade, technology, investment, culture, and politics. It is not a new phenomenon. Historically, trade routes like the Silk Road or colonial expansions already linked distant societies. However, modern globalization is faster, broader, and more complex because of digital technologies, modern transportation, and global institutions.
2. Historical Phases of Globalization
Pre-modern globalization (before 1500): Exchange of goods, ideas, and culture through ancient trade routes.
Colonial globalization (1500–1800): European expansion, global maritime trade, and the integration of colonies into global markets.
Industrial globalization (1800–1945): Industrial revolution, rise of capitalism, mass migration, and colonial empires.
Post-WWII globalization (1945–1990): Bretton Woods system, establishment of IMF, World Bank, GATT (later WTO), rapid growth of multinational corporations.
Contemporary globalization (1990–present): Driven by digital revolution, liberalization of markets, China’s rise, and global value chains.
3. Drivers of Globalization
Economic factors: Free trade agreements, foreign direct investment, outsourcing, and global supply chains.
Technological factors: Internet, smartphones, containerization in shipping, aviation, artificial intelligence.
Political factors: Collapse of the Soviet Union, liberalization of China and India, neoliberal policies.
Cultural factors: Spread of movies, music, cuisine, tourism, and global media.
Institutional factors: Role of WTO, UN, World Bank, IMF in shaping global rules.
4. Key Features of Globalization
Free movement of goods and services through trade liberalization.
Capital mobility via foreign investments, stock markets, and financial flows.
Labor mobility, including migration and outsourcing.
Knowledge and cultural diffusion through digital platforms and global communication.
Global governance, where international rules and treaties influence domestic policies.
Part II: Benefits and Criticisms of Globalization
1. Benefits of Globalization
Economic growth: Countries like China, South Korea, and India grew rapidly by integrating into global trade.
Poverty reduction: Hundreds of millions lifted out of poverty, particularly in Asia.
Access to technology and knowledge: Rapid spread of innovations like smartphones, vaccines, and renewable energy.
Cultural exchange: Increased exposure to different cuisines, languages, films, and lifestyles.
Global cooperation: Joint efforts in areas like climate change, health, and peacekeeping.
2. Criticisms of Globalization
Economic inequality: Benefits concentrated in urban elites, while rural and working-class populations often feel left behind.
Exploitation of labor: Sweatshops, poor working conditions, and child labor in developing countries.
Cultural homogenization: Local traditions sometimes overshadowed by dominant Western culture.
Environmental damage: Global supply chains contribute to carbon emissions and resource depletion.
Sovereignty concerns: National governments constrained by global corporations and institutions.
Part III: The Rise of De-Globalization
1. Defining De-Globalization
De-globalization refers to a process where countries reduce their interdependence and focus more on domestic or regional economies. It is not necessarily a complete reversal of globalization but a slowing down or selective disengagement.
2. Historical Precedents
The Great Depression (1930s): Countries adopted protectionism and trade barriers.
World Wars: Global connections broke down, leading to regional blocs.
Oil crises (1970s): Triggered energy nationalism and protectionist policies.
3. Contemporary Drivers of De-Globalization
Economic nationalism: Trade wars, tariffs, and policies favoring domestic industries (e.g., U.S.–China tensions).
Pandemics: COVID-19 exposed vulnerabilities in global supply chains, leading to “reshoring” or “nearshoring.”
Geopolitical tensions: Russia-Ukraine war, Taiwan conflict, Middle East instability.
Technological sovereignty: Push for domestic control over critical technologies like semiconductors and AI.
Environmental concerns: Shift toward local production and sustainable supply chains.
4. Examples of De-Globalization
Brexit: UK’s withdrawal from the European Union.
U.S.–China trade war: Tariffs, sanctions, and decoupling in technology.
Supply chain reshoring: Companies like Apple diversifying away from China.
Regionalization: Growth of regional trade agreements like RCEP (Asia) and USMCA (North America).
Part IV: Future of Globalization and De-Globalization
1. Hybrid Future
Most experts argue that globalization will not disappear entirely. Instead, we are entering a hybrid era where:
Supply chains become regional rather than fully global.
Countries balance global trade with domestic resilience.
Digital globalization (data, AI, e-commerce) grows even if physical trade slows.
2. Scenarios for the Future
Re-globalization: If countries overcome geopolitical rivalries and focus on cooperation in climate, health, and technology.
Fragmented globalization: World splits into competing blocs (U.S.-led, China-led, EU-led).
Selective de-globalization: Nations globalize in technology and finance but de-globalize in food, energy, and security.
3. Role of Key Actors
Governments: Balance between economic openness and protecting domestic interests.
Corporations: Redesign supply chains for resilience.
International institutions: Need reforms to stay relevant.
Civil society: Push for fairer, greener globalization.
Part V: Case Studies
1. China – From Globalization to Selective De-Globalization
China was the biggest winner of globalization, lifting millions out of poverty. But now, facing U.S. pressure, it is pursuing “dual circulation” – focusing on both domestic and global markets.
2. United States – Global Leader to Economic Nationalist
Once the champion of free trade, the U.S. has shifted toward reshoring, tariffs, and tech protectionism, especially under Trump and Biden administrations.
3. European Union – Between Integration and Fragmentation
The EU promotes internal integration but faces pressures like Brexit, energy crises, and immigration debates.
4. India – Strategic Balancing
India embraces globalization in IT and services but protects key sectors like agriculture. It seeks to position itself as an alternative manufacturing hub to China.
Part VI: Globalization vs. De-Globalization in Society
In economics: De-globalization raises costs but increases resilience.
In politics: Globalization fosters cooperation, while de-globalization strengthens sovereignty.
In culture: Globalization spreads diversity, but de-globalization protects heritage.
In environment: Globalization increases carbon footprints, but de-globalization can encourage local sustainability.
Conclusion
Globalization has been one of the most transformative forces in human history, reshaping economies, societies, and cultures. It has brought prosperity, connectivity, and innovation, but also inequality, environmental damage, and political tensions. De-globalization is not simply a rejection of globalization but a recalibration. The world is moving toward a more balanced model that emphasizes resilience, regional cooperation, and sustainability.
In the end, neither globalization nor de-globalization is inherently good or bad. Both are responses to changing realities. The challenge for policymakers, businesses, and societies is to shape globalization in a way that is more inclusive, equitable, and sustainable—while learning from the lessons of de-globalization.
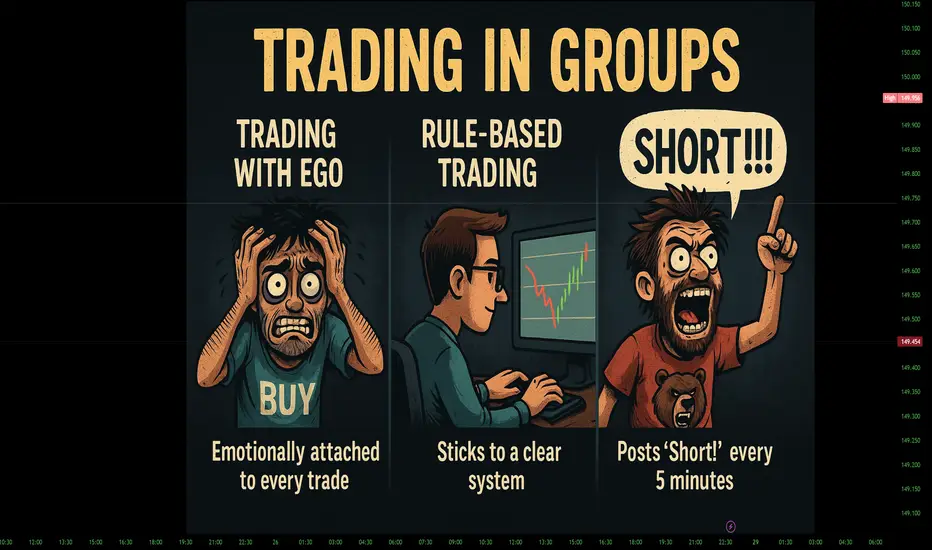
Trading in Groups – Rules vs. EgoIt’s always strange to trade in groups (or discussions) as a technical analyst with a clear rulebook – a framework built with effort, tuition money, and hard lessons.
But many don’t understand this work.
Why?
Because they don’t allow free thinking and are driven by constant online consumption.
🚫 Failed by Technique
Many traders fail at technique – and cannot survive this path.
Typical signs:
Ego comes first.
Constant bragging about how “big” they are, how many years of experience they have.
Suddenly, the technique becomes “the enemy.”
👉 Especially men often struggle more than women here.
Why? Because many men tie their self-worth to “being right” and “showing strength.” Women, on the other hand, often trade more pragmatically and accept losses faster as part of the game.
👉 This ego issue is one of the biggest reasons why so many traders fail.
🔊 The “Market Shouters”
You see them everywhere in forums:
“Up to the moon!” 🌕
“Now short!” 📉
…just because a MACD crossed in the 5-minute chart.
❌ No chart.
❌ No plan.
❌ Only emotions.
👉 That’s not analysis – that’s shouting.
🕳️ Copy-Trading & Fake Gurus
Another big problem: Copy-traders or wannabe gurus.
They celebrate themselves because they have 1,000 followers.
They give tips, posing as the “trading god.”
They want applause – instead of proving real trading.
In reality, it’s reckless – and dangerous.
Most don’t even know what they’re doing – trapped in their 1–5 minute hypnosis world.
👉 Anyone who’s been around long enough knows:
Small timeframes will eventually drive you crazy – you start seeing everything. 😵💫
🔍 The Hunt for the Holy Grail
Some look for it in fundamentals.
Others in charts.
Many mix methods randomly.
👉 The truth:
There are many roads to Rome – but the real question is:
Do you become free in your thinking, or do you stay trapped?
Anyone who has truly learned should trust their knowledge and path – just like after an apprenticeship, you trust your craft.
⚙️ Rulebook & Mechanics
The chart runs mechanically.
The timeframes are like gears that interlock.
Harmonic patterns are the connections in between.
👉 Without understanding these structures, all you have is a “lucky setup” – luck instead of system.
😂 Personal Observation
I personally find these patterns very amusing.
Once again, it shows: Trading is not just about technique and rules – but also psychology, character, humanity, and above all, mass psychology.
Because in the end, it’s not individual egos that move the market – but the collective emotions: greed, fear, panic, and euphoria.
👉 And that’s exactly where the opportunities lie – for traders who understand and move with the bots. 😏✨
👀 And here’s a tip:
Anyone who’s analyzed charts long enough will eventually switch their background to black – your eyes will thank you.
😅 Quote to close:
“Stare too long at the 1-minute chart, and you’ll start seeing patterns in the wallpaper.”
⚖️ Final Word
I am neither bull nor bear. I am an analyst.
I anticipate everything – and take what the chart gives me
Introduction to Global Currency Reset (GCR)1. Understanding the Concept of Global Currency Reset
A Global Currency Reset (GCR) is a large-scale, coordinated adjustment of the world’s monetary system.
It usually involves realigning the values of major currencies to reflect economic realities.
GCR addresses systemic financial imbalances that accumulate over decades in global trade and finance.
It is often seen as a response to over-reliance on a dominant reserve currency, historically the U.S. dollar.
The aim is to create a fairer, more balanced international financial system.
GCR can include devaluation, revaluation, or replacement of currencies, along with technological upgrades like digital currencies.
2. Historical Context of Currency Systems
Gold Standard Era (1870–1914):
Currencies were pegged to gold to maintain stability.
International trade relied on fixed exchange rates, reducing currency speculation.
Interwar Period and Economic Instability (1914–1944):
World War I caused collapse of the gold standard.
Countries experimented with floating currencies and competitive devaluation.
Bretton Woods System (1944–1971):
U.S. dollar became the global reserve currency, convertible to gold.
IMF and World Bank were established to maintain global financial stability.
Nixon Shock (1971):
U.S. abandoned gold convertibility, ushering in the fiat currency era.
Led to floating exchange rates and dollar dominance in global trade.
Post-Bretton Woods Era (1971–Present):
Dollar remained dominant due to the size and strength of the U.S. economy.
Global trade, energy markets, and debt systems became dollar-centric.
3. Drivers Behind the Global Currency Reset
U.S. Debt and Fiscal Policies:
High national debt and persistent deficits weaken long-term trust in the dollar.
De-Dollarization Efforts:
Countries like China, Russia, India, and BRICS nations are promoting local currency use in trade.
Aim to reduce vulnerability to U.S. sanctions and influence.
Technological Advancements:
Rise of cryptocurrencies, stablecoins, and Central Bank Digital Currencies (CBDCs) challenge traditional currency models.
Geopolitical Tensions:
Wars, sanctions, and trade wars encourage nations to explore alternatives to dollar dependency.
Trade Imbalances:
Persistent global trade deficits and surpluses create pressure for currency realignment.
Inflationary Pressures:
Excessive money printing and low interest rates lead to currency devaluation risks globally.
4. Potential Mechanisms of a Global Currency Reset
Currency Revaluation or Devaluation:
Adjusting currency values to reflect real economic strength.
Could strengthen weaker currencies or weaken overvalued ones.
Introduction of a New Reserve Currency:
Could replace the dollar with:
A basket of currencies (e.g., SDR – Special Drawing Rights)
A digital global currency
Expansion of IMF Special Drawing Rights (SDRs):
SDRs act as supplementary reserve assets for international liquidity.
Could reduce reliance on the U.S. dollar.
Central Bank Digital Currencies (CBDCs):
Governments may issue digital currencies for transparent, efficient, and secure transactions.
Global Agreements & Coordination:
A GCR would require multilateral coordination between major economies.
Could involve global financial institutions like IMF and World Bank.
5. Implications of a Global Currency Reset
Economic Rebalancing:
Potentially reduces imbalances in global wealth and trade.
Market Volatility:
Short-term disruptions in stock markets, commodity prices, and forex markets.
Monetary Policy Challenges:
Central banks face difficulty controlling inflation, interest rates, and liquidity.
Debt Revaluation:
Debts denominated in foreign currencies may increase or decrease in real terms.
Geopolitical Shifts:
Nations may realign alliances and trade strategies.
Impact on Individuals:
Savings, investments, and pensions may be affected depending on currency adjustments.
6. Key Indicators That a GCR May Be Approaching
Rapid Debt Accumulation:
High levels of sovereign debt raise global financial concerns.
Surge in Digital Currency Adoption:
Increasing use of CBDCs and cryptocurrencies signals a shift.
Declining Dollar Dominance:
Reduced use of USD in international trade, oil, and commodities.
Global Policy Coordination:
Moves towards currency baskets, SDR expansion, or multilateral monetary agreements.
Market Speculation:
Hedge funds and institutions adjusting portfolios to protect against currency shocks.
7. Preparing for a Global Currency Reset
Diversifying Investments:
Spread assets across different currencies, equities, bonds, and commodities.
Investing in Tangible Assets:
Gold, silver, real estate, and other hard assets serve as hedges against currency volatility.
Monitoring Global Financial Policies:
Track IMF, World Bank, and central bank announcements for early indicators.
Digital Asset Considerations:
Research and cautiously consider cryptocurrency or CBDC adoption.
Financial Risk Management:
Consult financial advisors to restructure portfolios for potential GCR scenarios.
8. Potential Scenarios of a Global Currency Reset
Soft Reset:
Minor revaluation of currencies with gradual global coordination.
Moderate Reset:
Adjustments in currency values, SDR expansion, and partial digital integration.
Full Reset:
New reserve currency, major debt revaluation, and mass adoption of digital currencies.
Impacts by Scenario:
Soft: Minimal disruptions; markets adjust slowly.
Moderate: Temporary volatility; moderate wealth shifts.
Full: Major shifts in trade, wealth, and economic power.
9. Challenges and Criticisms of GCR
Implementation Difficulty:
Coordinating multiple nations with conflicting interests is complex.
Market Resistance:
Financial institutions may resist changes threatening established profits.
Political Obstacles:
Sovereign nations may oppose loss of monetary influence.
Uncertainty Risks:
High unpredictability could cause panic, hoarding, and short-term economic shocks.
Technological Dependence:
Heavy reliance on digital systems and blockchain may introduce vulnerabilities.
10. Opportunities Arising from GCR
Global Economic Stability:
Long-term potential to balance trade, reduce deficits, and improve growth.
Digital Innovation:
Promotion of secure, transparent, and efficient digital payments.
Diversification of Power:
Reduces dominance of a single nation, fostering multi-polar economic influence.
Financial Inclusion:
CBDCs can expand access to banking and financial services globally.
Strengthening Global Cooperation:
Multilateral approach encourages peaceful economic collaboration.
11. Case Studies and Hypothetical Examples
Post-WWII Bretton Woods:
Demonstrated how global coordination stabilizes currencies after conflict.
China’s Renminbi Push:
Efforts to internationalize RMB show how de-dollarization trends evolve.
Digital Currencies:
Bahamas Sand Dollar and China’s Digital Yuan as real-world digital currency experiments.
Potential GCR in Action:
Hypothetical: SDR becomes a global reserve asset; USD value rebalanced; major debts recalculated.
12. Conclusion
The Global Currency Reset is not guaranteed, but discussions and preparatory steps are increasingly visible.
A GCR addresses economic imbalances, geopolitical risks, and financial vulnerabilities in the current system.
While risks of volatility and market disruption exist, opportunities for digital innovation, financial inclusion, and balanced economic power are substantial.
Preparation and awareness remain key for governments, institutions, and individuals.
The evolution of currencies, technology, and policy will likely shape the next phase of global finance.
The ABCD Pattern: The Market’s Favorite Alphabet TrickIf the markets had a secret language, the ABCD pattern would probably be one of the first letters you’d learn. Clean, geometric, and surprisingly common, this formation has been studied for decades. In abcd pattern trading, it’s not about spelling words. It’s about spotting balance, symmetry, and rhythm in price movements.
📐 What Is the ABCD Pattern?
Think of the ABCD pattern like a zigzag that markets often draw. It’s one of the simplest chart patterns in technical analysis because it shows how price usually moves in waves, not straight lines. Here’s how it works:
A → B (Impulse Move):
This is the first strong move, either up or down. In trading terms, it’s called an impulse leg — the market pushes in one direction with momentum.
B → C (Correction):
After a big push, the price takes a breather. This is the corrective leg. It doesn’t usually erase the whole move, just part of it.
C → D (Continuation Move):
Here’s the key: the price often makes another move, similar in size and angle to A → B. That’s why people say the ABCD has “symmetry.”
So, when you connect the dots A-B-C-D, you get a neat geometric shape that traders call the ABCD trading pattern. ⚠️ But a warning straight away: no matter how perfect an ABCD looks on paper, it cannot be read in isolation. Without confirmation from other tools — volume, momentum indicators, or broader market context — it’s just a geometric doodle on your chart.
🟩 Bullish and Bearish Variants
Like most patterns, ABCD has two moods. The bullish ABCD pattern shows up after a down-move, hinting that the market might be ready for a rebound. The bearish sibling often forms after an up-move, suggesting exhaustion.
The structure doesn’t change — it’s always AB, BC, and CD — but the meaning depends on where it forms. In a bullish ABCD, sellers push the price down twice before running out of strength, and that’s when buyers often step in. In a bearish ABCD, buyers push the price up twice, but eventually lose momentum, giving sellers a chance to take over. So when you see an ABCD chart pattern, you’re not just connecting dots — you’re watching how buyers and sellers take turns, and where one side might finally give up control.
📊 Real Market Example
Take Bitcoin in early 2021. After a powerful rally from around ~$14K to ~$42K, BTC corrected back to ~$29K before surging again to new highs near ~$64K. This sequence mapped cleanly into a textbook ABCD pattern:
A → B: The rally into the ~$42K peak.
B → C: The correction down to the ~$29K zone.
C → D: A rebound to ~$64K, completing the mirrored leg.
It wasn’t a trading signal on its own — far from it. However, when combined with fading momentum and volume divergence, the ABCD chart pattern provided a visual anchor for identifying exhaustion in what was becoming an overheated market.
🧩 Why the ABCD Pattern Still Matters
The appeal of the abcd trading pattern lies in its simplicity. Markets are noisy, messy, and emotional. The ABCD strips that down to a geometric rhythm that even a beginner can spot. But here’s the catch: if you lean only on it, you’ll miss the bigger story. Professional analysts stress this constantly: the ABCD pattern works best as part of a toolkit. Pair it with Fibonacci retracements, moving averages, or support/resistance zones, and you’ll see how it fits into the wider puzzle. Alone, it’s just half a sentence. Together with other tools, it becomes part of the market’s story.
🎯 Final Thoughts
So, what is the ABCD pattern? It’s not magic, not a guarantee, but a visual lens. Think of it as one of the market’s favorite ways of whispering: “Something’s happening here.” The trick is listening carefully and comparing it with the rest of the orchestra. Because in trading, and especially in crypto, a single instrument never plays the whole song.
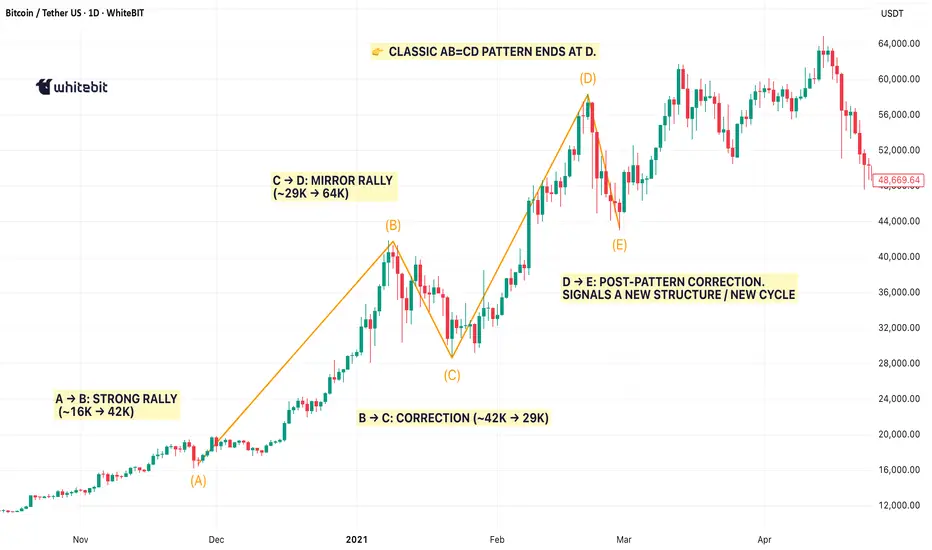
Domestic vs Global Markets1. Definition of Domestic and Global Markets
Domestic Market
A domestic market refers to the economic environment within a country's borders where goods, services, labor, and capital are exchanged. It is governed by local regulations, currency, taxation policies, and market structures. The domestic market serves as the primary platform for local businesses to sell products, engage consumers, and stimulate economic growth.
Examples:
India’s retail market primarily serving Indian consumers.
U.S. domestic stock market, such as NYSE or NASDAQ, dealing mainly in dollars.
Global Market
A global market (or international market) refers to the interconnected system of trade, finance, and investment across multiple countries. It involves cross-border exchange of goods, services, capital, and labor, influenced by global supply-demand dynamics, foreign currencies, international regulations, and geopolitical factors.
Examples:
The global oil market, where prices are determined internationally.
Forex market, which is inherently global, with currencies traded worldwide.
Companies like Apple, which sell products across multiple countries.
2. Key Characteristics
Domestic Market
Local Regulation: The market follows the country’s legal framework, tax policies, and consumer protection laws.
Single Currency: Transactions are primarily in the local currency, reducing foreign exchange risk.
Cultural Familiarity: Businesses have deeper knowledge of consumer behavior and local preferences.
Limited Exposure: Domestic markets are less impacted by global political or economic crises.
Global Market
Multiple Regulations: Operations span different countries, requiring compliance with diverse laws and standards.
Currency Fluctuations: Exposure to foreign exchange risk due to multiple currencies.
Wider Customer Base: Access to international consumers and markets increases potential revenue.
Higher Volatility: Global economic crises, geopolitical tensions, and trade policies can affect performance.
3. Advantages of Domestic Markets
Stability: Less affected by global economic shocks, providing consistent demand.
Regulatory Familiarity: Easier for businesses to comply with local laws and taxation.
Consumer Insight: Businesses can adapt products to local tastes and cultural nuances.
Lower Transaction Costs: No need to manage foreign exchange risks or international logistics.
Government Support: Domestic markets often benefit from incentives, subsidies, or protective tariffs.
4. Advantages of Global Markets
Market Expansion: Companies can access millions of new customers globally.
Diversification: Exposure to multiple markets reduces dependency on one economy.
Higher Profit Potential: International markets often have higher growth potential.
Learning Opportunities: Exposure to global trends fosters innovation and competitiveness.
Investment Access: Global financial markets provide opportunities for foreign capital and partnerships.
5. Challenges in Domestic Markets
Limited Growth: Once saturated, domestic markets may offer limited expansion opportunities.
High Local Competition: Localized industries may be competitive, making profit margins narrow.
Economic Vulnerability: Economic downturns in the country can significantly affect businesses.
Regulatory Constraints: Stringent local laws may limit flexibility.
6. Challenges in Global Markets
Currency Risk: Exchange rate fluctuations can erode profits.
Political Risk: Political instability in foreign countries can disrupt operations.
Cultural Barriers: Misunderstanding local customs can impact brand acceptance.
Logistics and Supply Chain: Managing international shipping, tariffs, and customs can be complex.
Regulatory Compliance: Adhering to multiple countries’ regulations increases costs and operational complexity.
7. Domestic vs Global Market Strategies
For Businesses in Domestic Markets
Focus on Brand Loyalty: Build strong local relationships.
Cost Optimization: Streamline operations for local efficiency.
Market Research: Analyze local consumer trends thoroughly.
Policy Leverage: Utilize government incentives and subsidies.
For Businesses in Global Markets
Diversify Operations: Spread operations across different countries to reduce risk.
Hedging Currency Risk: Use financial instruments like forwards or options.
Cultural Adaptation: Localize products and marketing strategies.
Global Partnerships: Collaborate with local firms to ease market entry.
8. Economic Impact of Domestic vs Global Markets
Domestic Market Impact
Drives local employment and entrepreneurship.
Increases government revenue through taxes and tariffs.
Supports national economic stability, cushioning against global shocks.
Global Market Impact
Encourages economic integration and global cooperation.
Stimulates foreign investment inflows and technology transfer.
Can create volatility, as economies become interdependent.
9. Investment Considerations
Domestic Market Investment
Lower Risk: Investments are less exposed to foreign policy or currency fluctuations.
Predictable Returns: Local trends are easier to anticipate.
Examples: Investing in national stock exchanges or government bonds.
Global Market Investment
High Returns Potential: International diversification can offer superior returns.
Hedging Benefits: Helps mitigate domestic economic slowdown.
Examples: Global ETFs, foreign real estate, international stocks.
10. Case Studies
Domestic Success Story
Reliance Jio in India: Focused on penetrating India’s telecom market, leveraging local consumer behavior and government policies.
Global Success Story
Apple Inc.: Operates in over 100 countries, generates significant revenue internationally, and adapts products to local markets (e.g., dual SIM iPhones in Asia).
11. Technological Influence
Both markets are increasingly shaped by technology:
Domestic: E-commerce platforms, digital payments, local delivery systems.
Global: Cloud computing, international payment gateways, global logistics networks, and data analytics for multi-country market strategies.
12. Policy Implications
Governments shape market dynamics through:
Domestic Market: Subsidies, tariffs, local content requirements, and tax incentives.
Global Market: Trade agreements, export-import regulations, foreign investment rules, and geopolitical diplomacy.
13. Future Trends
Domestic Market:
Increased digital adoption.
Localized production (e.g., Make in India).
Enhanced consumer-focused innovation.
Global Market:
Greater global interconnectivity via technology and logistics.
Rising influence of emerging markets in global trade.
Sustainability and ESG (Environmental, Social, Governance) shaping international investments.
14. Conclusion
Understanding domestic vs global markets is crucial for businesses, investors, and policymakers. Domestic markets offer stability, cultural familiarity, and lower risk, while global markets provide diversification, higher profit potential, and exposure to innovation and growth. Both markets are interlinked, with decisions in one often influencing the other. Businesses and investors must balance the benefits and challenges of each, leveraging technology, strategic partnerships, and risk management to thrive in today’s interconnected world.

The Crucial Role of Shipping and Logistics in Global Trade1. Historical Evolution of Shipping in Global Trade
1.1 Early Beginnings
Shipping has been central to human civilization for millennia. From the earliest riverboats in Mesopotamia to the grand seafaring voyages of the Phoenicians, Egyptians, and Greeks, waterborne trade allowed societies to exchange goods, ideas, and cultures.
1.2 The Age of Exploration
The 15th and 16th centuries marked a new era where maritime empires like Portugal, Spain, and later Britain and the Netherlands relied heavily on shipping to expand their colonies and access lucrative trade routes. Shipping played a key role in transporting spices, precious metals, textiles, and other goods, fueling global economic integration.
1.3 Industrial Revolution and Beyond
The industrial age brought innovations like steamships and the opening of key canals (Suez Canal in 1869, Panama Canal in 1914), drastically reducing travel time. These breakthroughs laid the groundwork for the modern shipping and logistics industry.
2. Shipping as the Backbone of Global Trade
2.1 Volume of Global Trade by Sea
Today, over 80% of global trade by volume and 70% by value is carried out by sea. From bulk commodities like oil, coal, and iron ore to manufactured goods and electronics, maritime shipping ensures global markets stay supplied.
2.2 Containerization Revolution
The advent of containerization in the mid-20th century revolutionized global shipping. Standardized containers allowed for efficient loading, unloading, and intermodal transfers, slashing costs and enabling the explosive growth of international trade.
2.3 Shipping Routes and Chokepoints
Vital shipping routes such as the Strait of Hormuz, the Malacca Strait, and the Panama and Suez Canals remain critical arteries of global trade. Any disruption in these chokepoints has a ripple effect on supply chains worldwide.
3. Logistics: The Invisible Engine of Trade
3.1 Definition and Scope
Logistics is far more than just moving goods. It encompasses planning, implementing, and controlling the efficient flow of goods, services, and information from point of origin to consumption.
3.2 Importance in Supply Chain Management
Efficient logistics ensures that goods are delivered on time, in the right quantity, and at the lowest possible cost. It balances supply and demand, enabling businesses to optimize inventory, reduce waste, and increase customer satisfaction.
3.3 Integration with Global Markets
Logistics allows businesses to operate globally, sourcing raw materials from one continent, manufacturing in another, and selling in yet another. This interconnectedness is possible only through streamlined logistics networks.
4. Infrastructure Supporting Global Shipping and Logistics
4.1 Ports and Harbors
Ports are the lifelines of global trade. Mega-ports like Shanghai, Singapore, and Rotterdam handle millions of containers annually, equipped with state-of-the-art cranes, warehouses, and customs facilities.
4.2 Shipping Fleets
Global shipping depends on a vast and diverse fleet, including container ships, bulk carriers, tankers, and roll-on/roll-off vessels. These specialized vessels cater to different cargo needs.
4.3 Logistics Hubs and Warehousing
Beyond ports, inland logistics hubs, warehouses, and free trade zones ensure goods can be stored, processed, and redistributed efficiently.
4.4 Intermodal Transportation
Railways, trucking, and air freight integrate with maritime shipping to form seamless supply chains, ensuring last-mile delivery and global connectivity.
5. Economic Significance of Shipping and Logistics
5.1 Contribution to Global GDP
Shipping and logistics contribute significantly to global GDP by reducing transaction costs, facilitating comparative advantage, and enabling economies of scale.
5.2 Enabler of Globalization
Without efficient shipping and logistics, globalization would be impossible. Companies like Apple, Toyota, and Amazon rely on complex supply chains spanning multiple continents.
5.3 Employment and Income
The industry employs millions worldwide—from seafarers and dock workers to truck drivers, logistics managers, and customs officials.
5.4 Trade Competitiveness
Countries with advanced logistics networks, like Singapore, Germany, and the Netherlands, enjoy greater trade competitiveness and higher economic growth.
6. Challenges Facing Global Shipping and Logistics
6.1 Geopolitical Risks
Maritime trade routes are vulnerable to piracy, territorial disputes, and blockades. For example, tensions in the South China Sea threaten major shipping lanes.
6.2 Supply Chain Disruptions
Events like the COVID-19 pandemic highlighted the fragility of global logistics, with port closures, container shortages, and shipping delays causing ripple effects worldwide.
6.3 Environmental Concerns
Shipping contributes significantly to greenhouse gas emissions, air pollution, and ocean degradation. Stricter environmental regulations are pushing the industry toward cleaner fuels and greener practices.
6.4 Infrastructure Bottlenecks
Congestion at ports, aging infrastructure, and limited inland connectivity often cause delays and increased costs.
6.5 Rising Costs
Fuel price volatility, labor shortages, and compliance with international standards increase operational costs for shipping companies.
7. Technological Transformation in Shipping and Logistics
7.1 Digitalization and Smart Shipping
Automation, artificial intelligence (AI), and big data analytics are optimizing routes, reducing fuel consumption, and improving cargo tracking.
7.2 Blockchain for Transparency
Blockchain ensures transparency, reduces fraud, and streamlines documentation in international trade. Smart contracts speed up customs clearance and payment systems.
7.3 Autonomous Ships and Drones
Unmanned ships and drones are being tested to reduce labor costs and enhance safety. While still in early stages, they represent the future of logistics.
7.4 IoT and Real-Time Tracking
The Internet of Things (IoT) enables real-time monitoring of cargo conditions (temperature, humidity, location), ensuring sensitive goods like pharmaceuticals and perishables remain intact.
7.5 Green Technologies
The adoption of LNG-powered vessels, wind-assisted propulsion, and electric trucks is reducing the industry’s carbon footprint.
8. Strategic Role in International Relations
8.1 Maritime Trade as a Geopolitical Tool
Control over shipping routes often translates into geopolitical power. For instance, China’s Belt and Road Initiative heavily invests in ports worldwide to expand its influence.
8.2 Trade Wars and Tariffs
Shipping and logistics adapt quickly to changing trade policies, rerouting goods and finding alternative markets.
8.3 Humanitarian and Defense Logistics
Logistics networks are vital for disaster relief and military operations, ensuring rapid deployment of aid or defense resources.
9. Case Studies
9.1 The Suez Canal Blockage (2021)
The Ever Given incident showed how a single disruption in a vital chokepoint could halt billions in global trade, causing shortages and delays.
9.2 COVID-19 Pandemic
Lockdowns disrupted supply chains globally, exposing vulnerabilities in just-in-time logistics and emphasizing the need for resilience.
9.3 E-Commerce Boom
Companies like Amazon and Alibaba rely on logistics networks to fulfill millions of orders daily, highlighting logistics’ central role in the digital economy.
10. Future Outlook
10.1 Resilient Supply Chains
The future will see greater emphasis on building resilient and flexible logistics networks to withstand shocks.
10.2 Sustainability Goals
The shipping industry is under pressure to align with climate goals, including the International Maritime Organization’s (IMO) target of halving emissions by 2050.
10.3 Technological Integration
Advances in AI, blockchain, robotics, and green shipping will reshape the industry.
10.4 Regionalization of Trade
While globalization remains dominant, regional trade agreements and nearshoring may reduce dependency on long-distance shipping.
Conclusion
Shipping and logistics are the unsung heroes of globalization, quietly powering the global economy by connecting producers, consumers, and markets across continents. They not only ensure the smooth movement of goods but also underpin economic growth, international cooperation, and cultural exchange. Despite challenges like environmental pressures, geopolitical risks, and technological disruptions, the industry continues to adapt and evolve.
In a world that increasingly relies on interconnected supply chains, the importance of shipping and logistics cannot be overstated. As trade volumes grow, technology advances, and sustainability becomes a priority, shipping and logistics will remain at the heart of global trade—ensuring that the wheels of globalization keep turning.

Core Concepts of Digital Assets & Economy1. Defining the Digital Economy
The digital economy refers to all economic activities that are based on or significantly shaped by digital technologies. It is built upon the interconnectedness of the internet, cloud computing, mobile applications, artificial intelligence (AI), blockchain, and big data analytics.
Key characteristics of the digital economy include:
Intangibility of Value – Value is increasingly derived from information, algorithms, and digital assets rather than physical goods.
Global Connectivity – The digital economy transcends geographical borders, enabling instant cross-border transactions.
Platform-Centric Business Models – Companies like Amazon, Google, and Alibaba leverage platforms to connect producers and consumers digitally.
Data as the New Oil – Data is both an asset and a currency in the digital economy, driving decision-making, personalization, and automation.
The digital economy represents a shift from traditional capital and labor-based growth models to innovation, intellectual property, and technological adoption.
2. What Are Digital Assets?
A digital asset is any item of value that exists in digital form and can be owned, transferred, or exchanged. While traditional assets such as stocks, bonds, or real estate are physical or paper-based, digital assets are intangible and exist in electronic environments.
Examples include:
Cryptocurrencies like Bitcoin and Ethereum
Tokenized assets (fractional ownership of real estate, stocks, or commodities)
Non-Fungible Tokens (NFTs) representing art, music, or collectibles
Intellectual property (patents, copyrights, digital designs)
Virtual goods in gaming ecosystems
Personal data and digital identities
Core properties of digital assets:
Intangibility – Exists only in digital form.
Transferability – Can be exchanged globally within seconds.
Programmability – Assets can be coded with rules (smart contracts).
Security & Scarcity – Blockchain ensures authenticity and prevents duplication.
3. Classifications of Digital Assets
Digital assets can be broadly categorized into the following:
a. Cryptocurrencies
Decentralized digital currencies secured by cryptography, such as Bitcoin, Ethereum, and stablecoins. They serve as mediums of exchange, stores of value, and units of account in the digital economy.
b. Security Tokens
Digitized representations of traditional financial instruments like stocks, bonds, or derivatives. They are regulated and offer investor rights, dividends, and voting power.
c. Utility Tokens
Tokens that grant access to a product or service within a specific blockchain ecosystem. Example: Ether (ETH) is used to pay for transactions on Ethereum.
d. Non-Fungible Tokens (NFTs)
Unique digital certificates of ownership for art, collectibles, music, and other creative assets. They have revolutionized content monetization.
e. Central Bank Digital Currencies (CBDCs)
Digital versions of national currencies issued by central banks. Examples: e-CNY (China), Digital Euro, and India’s e-Rupee.
f. Tokenized Real-World Assets
Fractional ownership of real-world assets (real estate, gold, art) represented digitally, enabling liquidity and global access.
4. Technological Foundations
The rise of digital assets and the digital economy is powered by several foundational technologies:
Blockchain & Distributed Ledger Technology (DLT) – Ensures transparency, immutability, and security in digital asset transactions.
Smart Contracts – Self-executing agreements coded into blockchains, enabling automation of trust.
Artificial Intelligence & Machine Learning – Power predictive analytics, personalized services, and fraud detection.
Cloud Computing – Provides scalability and infrastructure for digital platforms.
Internet of Things (IoT) – Connects devices and enables real-time data-driven economic models.
Cybersecurity – Protects data, digital identities, and financial transactions.
5. Economic Implications of Digital Assets
The integration of digital assets into global markets has profound economic consequences:
Financial Inclusion – Cryptocurrencies and mobile banking provide unbanked populations access to financial services.
New Forms of Value Creation – NFTs empower artists and creators to monetize directly without intermediaries.
Liquidity in Illiquid Markets – Tokenization makes assets like real estate and fine art more accessible and tradable.
Disintermediation – Blockchain eliminates traditional intermediaries (banks, brokers), reducing costs.
Cross-Border Trade – Digital currencies enable instant, low-cost international remittances.
Gig & Creator Economy Expansion – Platforms monetize skills, data, and content more efficiently.
6. Digital Assets as a New Asset Class
Digital assets are increasingly recognized as a distinct asset class in investment portfolios. Institutional adoption is rising, with hedge funds, pension funds, and sovereign wealth funds diversifying into cryptocurrencies and tokenized assets.
Key investment features:
Volatility & High Returns – Cryptocurrencies are volatile but potentially yield high returns.
Correlation Diversification – Digital assets often move differently from traditional equities and bonds.
Hedging Against Inflation – Bitcoin is often termed “digital gold” due to its scarcity.
Programmable Income – DeFi allows investors to earn yield through staking, lending, and liquidity provision.
7. Risks & Challenges
While digital assets promise innovation, they come with risks:
Volatility – Price swings can destabilize portfolios.
Regulatory Uncertainty – Lack of uniform global frameworks creates risks for investors and businesses.
Cybersecurity Threats – Hacks and frauds remain major concerns in exchanges and wallets.
Scalability Issues – Networks like Ethereum face high transaction costs during peak demand.
Environmental Concerns – Proof-of-Work blockchains consume significant energy.
Illicit Use – Cryptocurrencies have been linked to money laundering and dark web activities.
8. Regulation of Digital Assets
Governments worldwide are grappling with regulating digital assets:
United States – The SEC and CFTC regulate cryptocurrencies as securities or commodities depending on classification.
European Union – Introduced MiCA (Markets in Crypto-Assets Regulation) to standardize frameworks.
China – Banned cryptocurrencies but promotes its CBDC, e-CNY.
India – Taxed crypto gains but has yet to establish a comprehensive regulatory law.
Global Organizations – The IMF and BIS advocate for international cooperation on digital currency regulation.
Regulation aims to balance innovation and investor protection, prevent financial crime, and ensure monetary stability.
9. The Digital Economy Ecosystem
The digital economy is composed of multiple interconnected ecosystems:
E-commerce & Digital Platforms – Amazon, Flipkart, and Alibaba dominate online retail.
Digital Finance & Fintech – Payment apps (PayPal, UPI, Stripe) and DeFi platforms.
Gig & Freelance Economy – Platforms like Upwork and Fiverr enable remote work monetization.
Metaverse & Virtual Economies – Virtual real estate, gaming assets, and social experiences.
Data Economy – Data marketplaces and AI-driven businesses monetize personal and enterprise data.
10. Future of Digital Assets & the Digital Economy
Looking ahead, digital assets will continue to reshape economies:
Mainstream Adoption – With regulatory clarity, institutional and retail adoption will surge.
Rise of CBDCs – National digital currencies will modernize monetary systems.
Tokenization of Everything – From cars to carbon credits, all assets may become tradable on blockchains.
Integration with AI & IoT – Smart cities and autonomous economies will emerge.
Decentralized Autonomous Organizations (DAOs) – Communities will govern businesses democratically through tokens.
Sustainable Finance – Shift to energy-efficient blockchain systems.
11. Case Studies
a. Bitcoin’s Role in Inflation-Hedging
During periods of global uncertainty, Bitcoin has been compared to gold as a hedge against inflation. In countries like Venezuela and Turkey, citizens turned to Bitcoin when national currencies collapsed.
b. NFTs in the Creative Industry
Artists like Beeple sold digital art for millions using NFTs, disrupting the traditional art world by eliminating galleries as gatekeepers.
c. China’s e-CNY Experiment
China is pioneering CBDC adoption through pilot programs in cities, with potential to influence cross-border trade settlement systems.
12. Ethical & Social Considerations
Digital assets also raise ethical debates:
Data Privacy – Who owns and monetizes personal data?
Digital Divide – Wealthier nations may dominate digital finance while poorer countries lag.
Speculation vs. Utility – Many crypto projects focus more on speculation than genuine utility.
Sustainability – Transition to green blockchain systems is crucial for climate goals.
Conclusion
The fusion of digital assets and the digital economy represents a fundamental transformation of global finance, trade, and innovation. Digital assets are not merely speculative instruments but new forms of value representation that empower individuals, democratize finance, and reimagine ownership. Meanwhile, the digital economy provides the infrastructure, platforms, and ecosystems where these assets thrive.
However, this transformation is not without risks—volatility, regulation, cybersecurity, and ethical challenges must be addressed to ensure stability and inclusivity. As technology evolves, the future will likely see a convergence of blockchain, AI, IoT, and tokenization, shaping a borderless, data-driven economy.
In essence, understanding the core concepts of digital assets and the digital economy is crucial not only for investors and policymakers but also for individuals and businesses seeking to thrive in an increasingly digital world.
Pops EMA Strat🎯 TE Entry Plan (Pops EMA Framework — Adjusted Given Weak Data)
Because TE’s pre-market range is unclear, this is more speculative. Use caution. But you can still watch for:
Define or wait for a clean PMH / PML once pre-market prints
If TE moves in pre-market, mark high & low before 9:30.
Otherwise, skip pre-market breakout and look for early session action.
Watch for a breakout above PMH or below PML
If price breaks above the (to-be-established) PMH, look for longs.
If it breaks below PML, look for shorts.
2-min EMA pullback for entry
After the breakout, wait for the price to pull back to the 13 EMA on the 2-minute chart.
Enter in the direction of breakout if rejection forms are present.
Place a stop just beyond the pullback.
Targets
Upside: PDH (~$2.03) or above if momentum is strong.
Downside: PDL (~$1.83) if short side triggers.
Risk/bias notes
If TE is in an uptrend or has strong news, the bias leans long.
If no clear pre-market or breakout, skip until levels form.
Because TE is low-priced/volatile, slippages and false breakouts are more common.

Stop Hunts & Fakeouts – The Art of Execution🧠 The Art of Execution – Trading Between Illusion and Precision
You see the zone. Crystal clear.
Your analysis screams: “Long!” or “Short!”
The market comes – you’re ready. Entry set. SL perfect. RR fits.
And then?
Boom. Wick. Stop hit.
Price moves your way – without you.
👉 Welcome to real trading.
The Hunt for Liquidity
The market doesn’t care about fairness – it seeks liquidity.
Your perfect entry is exactly where everyone else places it.
That’s why bots, algos, and smart money know where to strike.
Common traps:
Breakout → Fakeout
Pullback → No confirmation
Pattern → Hope → Liquidity taken
Structure vs. Illusion
The market rewards structure, not ego.
It doesn’t care about your feelings or your hopes.
The first spike isn’t the move – it’s just preparation.
Example:
You short after a breakout.
Price spikes 15 pips higher, takes your SL – and then drops 80 pips in your original direction.
👉 Classic liquidity grab.
Three Types of Traders
🎯 The Sniper – few shots, precise, structured.
🤞 The Hope Trader – strong analysis, poor execution.
💥 The Kamikaze – no plan, all-in, three trades later: margin call.
Mindset is the Key
Most traders don’t fail because they don’t know what to do –
they fail because they can’t execute what they already know.
FOMO, fear of being wrong, and chasing perfection destroy more accounts than bad analysis ever will.
Food for Thought
Every trader has faced the wick, the fakeout, the stop-hunt.
The real question is:
👉 Do you adapt – or do you repeat the same mistake again and again?

How Geopolitical News Impacts Markets and Trade1. Introduction
In an increasingly interconnected world, geopolitical events can have ripple effects across borders, influencing economic activities far removed from the epicenter of the event. The 2025 geopolitical landscape is marked by several significant developments that have already begun to reshape global markets and trade dynamics.
2. Geopolitical Events and Market Reactions
2.1 Stock Markets and Investor Sentiment
Geopolitical tensions often lead to immediate market reactions, particularly in stock markets. Investors, driven by uncertainty, may retreat to safer assets, leading to declines in equity markets. For instance, the escalation of the Russia-Ukraine conflict in early 2022 led to a surge in oil prices and a subsequent dip in global stock markets as investors anticipated economic disruptions.
2.2 Commodity Prices and Supply Chains
Commodities such as oil, gold, and agricultural products are highly sensitive to geopolitical events. The threat of the closure of the Strait of Hormuz in 2025, a critical chokepoint for global oil shipments, caused oil prices to spike, with potential long-term implications for global inflation and energy security.
2.3 Currency Markets and Exchange Rates
Geopolitical instability can lead to fluctuations in currency markets. Safe-haven currencies like the U.S. dollar and Swiss franc often appreciate during times of crisis, while currencies of nations directly involved in conflicts may depreciate. The 2025 U.S.-India trade crisis, marked by the imposition of high tariffs, led to a depreciation of the Indian rupee as investors anticipated economic fallout.
3. Geopolitical Risks and Global Trade
3.1 Trade Disruptions and Tariffs
Trade policies influenced by geopolitical considerations can disrupt established trade flows. The U.S.-China trade tensions, characterized by the imposition of tariffs, have led to shifts in global supply chains as companies seek to mitigate risks associated with trade barriers.
3.2 Sanctions and Their Economic Impact
Economic sanctions are a common tool used in geopolitical strategies. While aimed at pressuring governments, sanctions can have unintended consequences on global markets. For instance, sanctions on Russia have affected global energy markets, leading to price volatility and supply concerns.
3.3 Shifts in Trade Alliances
Geopolitical events can lead to the formation of new trade alliances and the reorientation of existing ones. The 2025 Pakistan–United States trade deal, focusing on energy and mining investments, signifies a strategic partnership that could alter regional trade dynamics.
4. Long-Term Structural Changes
4.1 Decoupling of Economies
The trend toward decoupling, particularly between the U.S. and China, is reshaping global trade. As nations seek to reduce dependence on rival powers, they are diversifying trade partners and supply chains, leading to a more fragmented global trade environment.
4.2 Regionalization of Supply Chains
In response to geopolitical risks, companies are increasingly regionalizing their supply chains to mitigate the impact of global disruptions. This shift is evident in the growing trade activities in regions like Central Asia and Africa, which are becoming vital hubs in emerging trade routes.
4.3 Investment in Resilient Infrastructure
Nations and corporations are investing in infrastructure that enhances resilience to geopolitical shocks. This includes developing alternative energy routes, expanding port capacities, and diversifying trade routes to ensure the continuity of trade in the face of potential disruptions.
5. Policy Responses and Strategic Considerations
5.1 Diversification of Trade Partners
Countries are recognizing the importance of reducing reliance on any single supplier or market. India's advocacy for enhancing South-South trade among Global South nations reflects a strategic move to build resilient supply chains and reduce vulnerabilities to geopolitical tensions.
5.2 Strengthening Multilateral Institutions
In a fragmented geopolitical landscape, multilateral institutions play a crucial role in mediating disputes and promoting cooperative trade practices. Strengthening organizations like the World Trade Organization (WTO) can facilitate dialogue and reduce the likelihood of trade conflicts.
5.3 Strategic Stockpiling and Resource Management
Nations are increasingly focusing on strategic stockpiling of essential resources, such as energy supplies and critical minerals, to ensure economic stability during geopolitical crises. This approach aims to mitigate the impact of supply chain disruptions and maintain economic resilience.
6. Conclusion
The interplay between geopolitical events and global markets and trade is complex and multifaceted. While short-term market reactions are often characterized by volatility and uncertainty, the long-term effects can lead to significant structural changes in global trade patterns and economic alliances. As geopolitical risks continue to evolve, stakeholders must remain vigilant and adaptable, employing strategies that enhance resilience and ensure the stability of global markets and trade networks.

Understanding The OPEC’s Influence on Oil Prices1. Introduction
Oil is one of the most important commodities in the modern world. It powers transportation, fuels industries, and plays a central role in energy generation. Because of this, changes in oil prices can have far-reaching effects on global economies, governments, and households. At the center of the global oil market is the Organization of the Petroleum Exporting Countries (OPEC), an intergovernmental organization formed to coordinate and unify petroleum policies among member nations. This explanation explores the historical context, mechanisms, economic impact, challenges, and future outlook of OPEC’s influence on oil prices.
2. Historical Context and Formation of OPEC
OPEC was established in 1960 by five founding countries: Iran, Iraq, Kuwait, Saudi Arabia, and Venezuela. These countries faced a market dominated by multinational oil companies known as the “Seven Sisters,” which controlled production levels and pricing, often to the detriment of oil-producing nations.
Before OPEC, oil prices were largely dictated by these corporations, and producer nations had minimal influence over their own resources. This led to disparities between the value of the oil sold and the economic benefit received by producing countries. The creation of OPEC was a strategic move to gain collective control, stabilize oil markets, and secure fairer revenues.
Over time, OPEC expanded its membership, including countries from Africa, the Middle East, and South America. This expansion allowed it to consolidate influence over the global oil supply, making it a key player in international energy markets.
3. How OPEC Influences Oil Prices
OPEC primarily influences prices through production quotas. By agreeing on how much oil each member country can produce, OPEC can manage global oil supply and, indirectly, pricing.
Reduction in production: When OPEC cuts production, global oil supply decreases. If demand remains stable or increases, prices rise.
Increase in production: Conversely, raising production can lead to an oversupply in the market, causing prices to fall.
OPEC also influences prices through market signaling. Announcements about production targets, policy changes, or upcoming meetings often lead to immediate reactions in oil futures markets, even before actual production changes occur.
4. OPEC+ and Global Cooperation
In recent years, OPEC has expanded its influence through alliances with non-member countries, forming the OPEC+ group. This includes major producers like Russia. By coordinating production strategies with these countries, OPEC+ strengthens its ability to stabilize markets during periods of volatility.
For example, during the COVID-19 pandemic, global demand for oil dropped sharply. OPEC+ responded with large-scale production cuts, which helped prevent a further collapse in prices and supported oil-dependent economies.
5. OPEC’s Role in the Global Economy
Oil is not just another commodity—it is a strategic economic resource. Changes in oil prices have widespread economic consequences:
Inflation: High oil prices increase transportation and manufacturing costs, driving up prices of goods and services.
Trade balances: Oil-importing countries face higher import bills, affecting their balance of payments, while oil-exporting countries gain higher revenues.
Fiscal stability: Governments of oil-exporting countries rely heavily on oil revenues to fund budgets, infrastructure, and social programs.
OPEC’s decisions, therefore, have direct consequences for millions of people and can even shape economic policies in countries far beyond the Middle East and Africa.
6. Geopolitical Implications
Oil is also a geopolitical tool. OPEC’s decisions can reflect political motives as well as economic ones:
During conflicts or sanctions, OPEC can adjust production to support allies or respond to global pressures.
The 1973 oil embargo demonstrated the power of oil as a political weapon, causing prices to quadruple and triggering economic crises in Western countries.
OPEC’s influence is not just economic; it is also a form of soft power, capable of shaping global politics.
7. Challenges and Criticisms of OPEC
Despite its influence, OPEC faces several challenges:
Internal disagreements: Members have different economic priorities and domestic pressures, which sometimes lead to conflicts over production quotas.
Non-compliance: Some countries may produce more than their agreed quota to meet domestic needs, reducing the effectiveness of collective decisions.
Energy transition: The rise of renewable energy, electric vehicles, and energy efficiency measures reduces global dependence on oil, potentially limiting OPEC’s long-term influence.
Critics also argue that OPEC’s coordinated production decisions can resemble monopolistic behavior, artificially inflating prices to the disadvantage of consumers.
8. Market Perception and Speculation
OPEC’s influence extends beyond physical supply adjustments. Market perception plays a crucial role:
Traders and investors react not just to actual production changes, but to expectations of future actions.
Media statements, public speeches, and even rumors about OPEC decisions can cause significant price fluctuations.
Derivative markets, including futures, options, and swaps, reflect OPEC-related risks, amplifying the impact of both real and perceived actions.
This creates a complex interplay between fundamentals (actual supply and demand) and speculation, making OPEC’s influence both direct and indirect.
9. Case Studies of OPEC’s Impact
1. 1973 Oil Embargo:
Arab members of OPEC imposed an embargo against countries supporting Israel in the Yom Kippur War. Oil prices quadrupled, leading to severe economic disruptions in Western economies, highlighting the organization’s geopolitical and economic power.
2. 1980s Oil Market Adjustments:
OPEC attempted to maintain high prices, but market distortions and non-compliance among members forced production cuts to stabilize prices. This period demonstrated the challenges of maintaining cohesion.
3. COVID-19 Pandemic Response:
OPEC+ coordinated unprecedented production cuts to stabilize global oil markets when demand collapsed due to lockdowns. This helped prevent further price collapse and supported oil-dependent economies.
10. Future Outlook
OPEC’s influence is likely to continue, but the context is changing:
Global energy transition: As renewable energy and electric vehicles grow, oil demand may plateau or decline.
Technological innovation: Advances in energy efficiency and alternative fuels could reduce dependence on OPEC oil.
Geopolitical shifts: OPEC will need to navigate changing alliances and conflicts in global energy politics.
The organization’s ability to adapt to these trends, maintain cohesion among members, and manage expectations will determine its relevance in the coming decades.
11. Conclusion
OPEC remains a central player in global oil markets, capable of influencing prices through production quotas, market signaling, and strategic alliances. Its decisions affect economies worldwide, from inflation rates to national budgets and geopolitical strategies. Understanding OPEC’s influence requires analyzing both actual production decisions and market perceptions, as well as considering historical context and future energy trends.
While challenges exist, OPEC’s coordinated approach ensures that it remains a key driver of global oil prices and a significant actor in international economics and politics.
Types of Sanctions: Economic, Trade, and Diplomatic1. Introduction to Sanctions
Sanctions are restrictive measures imposed by one entity—such as a country, group of countries, or international body—on another. Their purpose is to restrict or alter the actions of the target, which may be a nation-state, corporation, or even individuals. The rationale behind sanctions is that applying pressure can compel behavioral change without resorting to direct military conflict.
Sanctions often arise in response to:
Violations of international law (e.g., territorial aggression).
Human rights abuses (e.g., apartheid in South Africa).
Threats to global peace (e.g., nuclear proliferation).
Terrorism or organized crime (e.g., freezing terrorist assets).
Sanctions can be unilateral (imposed by a single state), multilateral (involving multiple states), or global (authorized by organizations like the United Nations).
Among the many forms of sanctions, three stand out due to their widespread application: economic, trade, and diplomatic sanctions.
2. Economic Sanctions
2.1 Definition
Economic sanctions are financial penalties or restrictions imposed to influence the policies or actions of another state or entity. They usually target banking, investment, currency, or financial transactions to undermine the economic stability of the sanctioned party.
2.2 Mechanisms of Economic Sanctions
Economic sanctions typically involve:
Asset Freezes: Blocking access to bank accounts, properties, and other financial holdings.
Restrictions on Financial Transactions: Prohibiting banks from processing payments linked to sanctioned entities.
Investment Bans: Preventing new investments in specific industries or regions.
Debt Restrictions: Limiting borrowing or access to international credit markets.
Currency Controls: Restricting access to foreign reserves.
2.3 Objectives of Economic Sanctions
Deterring aggression: Make the cost of war or hostile acts prohibitively high.
Limiting capacity: Restrict a nation’s ability to fund military or illicit programs.
Promoting policy change: Push governments to alter domestic or foreign policies.
Punishing violations: Penalize actions that contravene international law or norms.
2.4 Case Studies
Iran: Economic sanctions imposed by the U.S. and EU targeted Iran’s banking and oil industries, aiming to prevent nuclear weapon development. These sanctions severely curtailed Iran’s economy and pressured it into negotiations, resulting in the 2015 Joint Comprehensive Plan of Action (JCPOA).
Russia (2014 and 2022): Following Russia’s annexation of Crimea and later the invasion of Ukraine, sweeping sanctions targeted its financial institutions, reserves, and access to global markets. The aim was to weaken its economy and reduce its ability to sustain military operations.
North Korea: Sanctions restrict Pyongyang’s access to global finance and luxury goods, designed to limit its nuclear program’s funding.
2.5 Effectiveness and Criticisms
While economic sanctions can exert enormous pressure, their effectiveness varies. Sometimes, they succeed in bringing parties to the negotiating table; other times, they push states toward alternative alliances or informal economies. Criticisms include:
Humanitarian impacts: Ordinary citizens often suffer more than ruling elites.
Circumvention: Nations may evade sanctions via smuggling or alternative partners.
Political resistance: Instead of weakening regimes, sanctions may strengthen nationalist sentiments.
3. Trade Sanctions
3.1 Definition
Trade sanctions are restrictions on imports, exports, or access to markets. Unlike broad economic sanctions, trade sanctions specifically target goods, services, or technologies.
3.2 Mechanisms of Trade Sanctions
Export Bans: Prohibiting certain goods or technologies from being exported.
Import Restrictions: Blocking the purchase of goods from the target state.
Tariffs and Quotas: Raising barriers to trade to reduce economic interaction.
Sectoral Restrictions: Targeting industries such as energy, technology, or defense.
Embargoes: Comprehensive bans on all trade with a country.
3.3 Objectives of Trade Sanctions
Reduce economic growth: By cutting off access to international trade.
Limit access to technology: Prevent development of weapons or advanced systems.
Send political messages: Isolate regimes diplomatically through trade exclusion.
Promote human rights: Restrict the export of goods that could enable repression.
3.4 Case Studies
Cuba Embargo: The U.S. imposed a trade embargo on Cuba in 1960 to weaken Fidel Castro’s communist regime. While the embargo isolated Cuba for decades, it did not topple the government, sparking debate about its long-term utility.
South Africa (Apartheid Era): Trade sanctions and boycotts against South Africa in the 1980s targeted its exports, particularly minerals, to pressure the government into ending apartheid. These measures, combined with internal resistance, helped bring reform.
Technology Sanctions on China: Recent sanctions have restricted China’s access to advanced semiconductor technologies, aiming to slow its military and technological advancements.
3.5 Effectiveness and Criticisms
Trade sanctions can be powerful but have mixed results:
Effective when applied multilaterally (e.g., South Africa).
Ineffective when targets find new markets (e.g., Cuba trading with Europe and Asia).
Criticism: Often harm economic growth broadly, with limited influence on ruling elites.
4. Diplomatic Sanctions
4.1 Definition
Diplomatic sanctions involve reducing or severing official diplomatic relations. Unlike economic or trade sanctions, they focus on political isolation rather than financial or commercial restrictions.
4.2 Mechanisms of Diplomatic Sanctions
Expulsion of Diplomats: Declaring diplomats persona non grata.
Suspension of Diplomatic Relations: Downgrading or cutting ties entirely.
Exclusion from International Forums: Preventing participation in organizations (e.g., G8 suspension of Russia in 2014).
Visa Bans: Restricting leaders and officials from traveling abroad.
Symbolic Actions: Boycotting state events or summits.
4.3 Objectives of Diplomatic Sanctions
Signal disapproval: Express international condemnation of actions.
Isolate politically: Reduce legitimacy and influence of governments.
Pressure regimes: Encourage policy changes through political isolation.
Prevent escalation: Use symbolic actions instead of military confrontation.
4.4 Case Studies
Russia’s G8 Suspension (2014): Following the annexation of Crimea, Russia was expelled from the G8, signaling diplomatic condemnation.
Myanmar (Post-2021 Coup): Many countries downgraded diplomatic engagement and excluded Myanmar from ASEAN summits.
Iran (Post-1979 Revolution): The U.S. severed diplomatic ties after the hostage crisis, limiting formal engagement for decades.
4.5 Effectiveness and Criticisms
Diplomatic sanctions are often symbolic but can still have impact:
Effective when combined with economic/trade sanctions.
Symbolic in cases where states already embrace isolation.
Criticism: They limit dialogue, reducing opportunities for peaceful negotiation.
5. The Interconnected Nature of Sanctions
In practice, these sanctions rarely exist in isolation. Governments and international bodies often use them together as part of a broader strategy. For instance, against Russia in 2022, the West imposed:
Economic sanctions (asset freezes, exclusion from SWIFT).
Trade sanctions (bans on oil and technology exports).
Diplomatic sanctions (diplomatic expulsions, exclusion from forums).
Together, these measures amplify impact and present a united front, but they also carry risks such as retaliatory actions, global market disruptions, or long-term geopolitical divides.
6. Global Consequences of Sanctions
Sanctions reshape global politics and economics in multiple ways:
Geopolitical Realignments: Countries under sanctions may seek new alliances (e.g., Russia and China deepening ties).
Impact on Global Trade: Sanctions disrupt supply chains, especially in energy and commodities.
Humanitarian Implications: Civilians often face shortages, inflation, and unemployment.
Technological Fragmentation: Trade restrictions on high-tech goods may create separate technological ecosystems.
Erosion of Multilateralism: Unilateral sanctions sometimes undermine collective international decision-making.
7. Critiques and Ethical Considerations
Sanctions, though non-military, raise important ethical debates:
Do they harm the guilty or the innocent? In many cases, ordinary citizens bear the brunt, while elites remain insulated.
Are sanctions coercion or legitimate pressure? Critics argue sanctions can be instruments of coercion and neo-imperialism.
Do sanctions work long-term? Some argue they harden regimes instead of weakening them.
8. Future of Sanctions
The global landscape suggests sanctions will remain central to international diplomacy. Trends include:
Targeted Sanctions: Focusing on elites and sectors instead of entire populations.
Technological Sanctions: Increasing emphasis on restricting access to AI, semiconductors, and advanced technologies.
Financial Innovation: Cryptocurrencies may help evade sanctions, requiring new regulatory approaches.
Greater Multilateralism: Sanctions are more effective when applied collectively.
Hybrid Sanctions: Combining economic, trade, and diplomatic measures with cyber and informational tools.
Conclusion
Sanctions represent a powerful yet imperfect alternative to military conflict. Economic, trade, and diplomatic sanctions serve different but interconnected purposes: economic sanctions weaken financial capabilities, trade sanctions restrict goods and markets, and diplomatic sanctions isolate states politically.
Their effectiveness depends on global cooperation, the resilience of the targeted state, and the degree to which they align with broader strategic goals. While sanctions can promote peace and discourage aggression, they also risk unintended consequences, particularly humanitarian crises.
Ultimately, sanctions are tools—not solutions. They can pressure, isolate, and punish, but sustainable change requires diplomacy, dialogue, and international consensus. As the global order becomes increasingly multipolar and interconnected, sanctions will continue to evolve as instruments of statecraft—balancing between coercion, persuasion, and the pursuit of stability.

How to Avoid Bear and Bull Traps When Trading BitcoinWhen trading Bitcoin (BTCUSDT), you’ve probably heard of terms like Bear Trap and Bull Trap. These are traps that the market sets to deceive us, causing us to make wrong decisions and suffer losses. Let’s explore how to identify and avoid these traps.
1. What are Bear Trap and Bull Trap?
Bear Trap: This occurs when Bitcoin's price drops significantly, leading us to believe that a downtrend has begun, so we sell. But then, the price suddenly rises sharply. The result? We sell at the wrong time and miss out on potential profits.
Bull Trap: On the other hand, a Bull Trap happens when Bitcoin's price surges, making us think that an uptrend will continue, so we buy. But then, the price reverses and drops sharply, causing us to lose money by buying too early.
2. How to Identify Bear Trap and Bull Trap
Bear Trap: When the price drops but without strong trading volume, and RSI is in the oversold region, but the price does not continue to fall.
Bull Trap: When the price rises but trading volume does not follow suit, and RSI is overbought, but the price fails to maintain the uptrend.
3. How to Avoid Falling Into These Traps
Use Stop-Loss: Set stop-loss orders at key support and resistance levels to protect your account if the market moves against your expectations.
RSI: Use RSI to identify when the market is overbought (Bull Trap) or oversold (Bear Trap), helping you make better decisions.
EMA: Use moving averages like EMA 50 and EMA 200 to determine the main market trend and avoid being misled by “false moves”."
Major Global Soft Commodity Markets1. Understanding Soft Commodities
1.1 Definition and Classification
Soft commodities are raw materials that are cultivated, harvested, and traded for various purposes, including food, feed, fuel, and fiber. Unlike hard commodities such as metals and energy resources, softs are perishable and subject to seasonal cycles. They are typically traded on futures markets, allowing producers to hedge against price fluctuations and investors to speculate on price movements.
1.2 Key Characteristics
Perishability: Most soft commodities have a limited shelf life, requiring efficient storage and transportation systems.
Seasonality: Production cycles are influenced by planting and harvesting seasons, affecting supply and prices.
Geographic Concentration: Certain regions dominate the production of specific soft commodities, making them vulnerable to local disruptions.
Price Volatility: Prices can be highly volatile due to factors like weather events, pests, and geopolitical tensions.
2. Major Soft Commodities and Their Markets
2.1 Coffee
Coffee is one of the world's most traded commodities, with Brazil, Vietnam, and Colombia being the top producers. The market is influenced by factors such as climate conditions, currency fluctuations, and global demand trends. Futures contracts for coffee are traded on exchanges like ICE Futures U.S., providing a benchmark for global prices.
2.2 Cocoa
Cocoa is primarily produced in West Africa, with Ivory Coast and Ghana leading global production. The market has experienced significant price fluctuations due to supply deficits, often caused by adverse weather conditions and political instability in producing countries. The New York Cocoa Exchange, now part of ICE Futures U.S., plays a crucial role in setting global cocoa prices.
2.3 Sugar
Sugar is a staple in the global food industry, with Brazil, India, and China being major producers. The market is influenced by factors such as government policies, biofuel mandates, and global consumption patterns. Futures contracts for sugar are traded on exchanges like ICE Futures U.S., providing transparency and liquidity to the market.
2.4 Cotton
Cotton is essential for the textile industry, with China, India, and the United States being the largest producers. The market is affected by factors like weather conditions, labor costs, and global demand for textiles. Futures contracts for cotton are traded on exchanges such as ICE Futures U.S., offering a platform for price discovery and risk management.
2.5 Corn and Soybeans
Corn and soybeans are vital for food, feed, and biofuel industries. The United States is a leading producer of both crops, with significant exports to countries like China and Mexico. Futures contracts for these commodities are traded on exchanges like the CME Group, providing mechanisms for hedging and speculation.
2.6 Wheat
Wheat is a staple food for billions worldwide, with major producers including Russia, the United States, and China. The market is influenced by factors such as weather conditions, global demand, and trade policies. Futures contracts for wheat are traded on exchanges like the CME Group, offering a platform for price discovery and risk management.
3. Trading and Investment in Soft Commodities
3.1 Futures Markets
Futures markets are central to the trading of soft commodities, allowing producers to hedge against price fluctuations and investors to speculate on price movements. Exchanges like ICE Futures U.S. and the CME Group provide platforms for trading futures contracts, offering transparency and liquidity to the market.
3.2 Exchange-Traded Funds (ETFs)
ETFs provide investors with exposure to soft commodities without the need to directly trade futures contracts. For example, the Teucrium Corn Fund (CORN) and the Teucrium Soybean Fund (SOYB) offer investors a way to invest in these commodities through the stock market.
3.3 Physical Trading
Physical trading involves the buying and selling of actual commodities, often through long-term contracts between producers and consumers. Companies like ECOM Agroindustrial play a significant role in the physical trading of commodities such as coffee, cocoa, and cotton.
4. Factors Influencing Soft Commodity Markets
4.1 Weather and Climate Conditions
Adverse weather events like droughts, floods, and hurricanes can significantly impact the production of soft commodities, leading to supply shortages and price volatility.
4.2 Geopolitical Events
Political instability, trade disputes, and sanctions can disrupt supply chains and affect the prices of soft commodities.
4.3 Economic Policies
Government policies, such as subsidies, tariffs, and biofuel mandates, can influence the production and consumption of soft commodities, impacting their market dynamics.
4.4 Global Demand Trends
Changes in consumer preferences, population growth, and dietary habits can affect the demand for soft commodities, influencing their prices.
5. Challenges and Risks in Soft Commodity Markets
5.1 Price Volatility
Soft commodity markets are characterized by high price volatility due to factors like weather conditions, geopolitical events, and market speculation.
5.2 Supply Chain Disruptions
Natural disasters, transportation issues, and political instability can disrupt supply chains, leading to shortages and price increases.
5.3 Regulatory Uncertainty
Changes in government policies, such as trade restrictions and environmental regulations, can create uncertainty in the market.
6. Outlook for Soft Commodity Markets
6.1 Emerging Markets
Countries in Asia and Africa are becoming increasingly important players in the production and consumption of soft commodities, influencing global market trends.
6.2 Technological Advancements
Innovations in agricultural technology, such as precision farming and biotechnology, have the potential to improve yields and reduce the environmental impact of soft commodity production.
6.3 Sustainability Initiatives
There is a growing emphasis on sustainable practices in the production and trade of soft commodities, driven by consumer demand and regulatory pressures.
7. Conclusion
Soft commodities are integral to the global economy, influencing food security, industrial production, and trade dynamics. Their markets are complex and influenced by a myriad of factors, including weather conditions, geopolitical events, and economic policies. Understanding these markets is crucial for producers, traders, and investors alike to navigate the challenges and opportunities they present.
Cybersecurity in Global Trade1. Introduction
Global trade has been the backbone of economic development, facilitating the exchange of goods, services, and capital across borders. The digital transformation of global trade has enhanced efficiency, reduced costs, and increased connectivity. From electronic trading platforms and automated customs procedures to blockchain-based supply chain management, technology is integral to modern trade. However, this digital integration has also exposed global trade networks to cyber threats.
Cybersecurity in global trade refers to the measures, technologies, policies, and practices aimed at protecting trade-related digital assets, networks, and operations from unauthorized access, data breaches, cyberattacks, and other forms of cyber risk. As trade becomes increasingly digital, cybersecurity is no longer an optional investment but a critical component of economic resilience.
2. The Digital Transformation of Global Trade
2.1 Digitization in Trade
Over the past two decades, international trade has shifted from paper-based documentation to digital processes. Key digital advancements include:
Electronic Data Interchange (EDI): Enables the exchange of trade documents electronically, reducing errors and delays.
Automated Customs and Border Systems: Streamlines import/export procedures through digital submission and tracking of customs declarations.
Blockchain and Distributed Ledger Technology (DLT): Enhances supply chain transparency and traceability.
Internet of Things (IoT): IoT devices track goods in real time, improving logistics efficiency.
While these technologies improve speed and efficiency, they also create new entry points for cybercriminals.
2.2 Benefits of Digital Trade
Efficiency: Reduced paperwork and faster transactions.
Transparency: Real-time tracking of goods and financial flows.
Cost Reduction: Lower operational and administrative costs.
Market Expansion: Easier access to global markets, particularly for SMEs.
However, each digital advancement introduces new cybersecurity vulnerabilities, making global trade more complex to protect.
3. Cyber Threat Landscape in Global Trade
3.1 Types of Cyber Threats
Global trade faces a wide array of cyber threats, including:
Phishing Attacks: Fraudulent emails targeting trade operators to steal credentials.
Ransomware: Attackers encrypt critical trade or supply chain data and demand payment.
Supply Chain Attacks: Compromising a supplier’s systems to infiltrate larger networks.
Malware and Viruses: Disrupting logistics, payment processing, and operational systems.
Denial-of-Service (DoS) Attacks: Disabling e-commerce platforms or trade portals.
3.2 Notable Cybersecurity Incidents in Trade
Several high-profile incidents demonstrate the vulnerability of global trade:
Maersk Shipping Attack (2017): The NotPetya ransomware attack disrupted Maersk’s global operations, costing over $300 million.
Targeted Supply Chain Attacks: Hackers infiltrated logistics providers to steal sensitive trade data.
3.3 Emerging Threats
AI-powered cyberattacks: Advanced attacks using artificial intelligence for phishing, intrusion, and reconnaissance.
IoT vulnerabilities: Insecure IoT devices in shipping and logistics networks can provide gateways for attackers.
Digital currency fraud: Cryptocurrencies used in cross-border trade are susceptible to theft and fraud.
4. Impact of Cybersecurity Risks on Global Trade
4.1 Financial Impact
Cyber incidents can lead to:
Direct financial losses through theft or ransomware payments.
Increased insurance premiums and regulatory fines.
Costly operational disruptions, such as shipment delays or halted production.
4.2 Operational Impact
Interruptions in supply chains can delay the delivery of goods and services.
Reduced visibility in logistics networks due to compromised tracking systems.
Loss of competitive advantage due to intellectual property theft.
4.3 Reputational Impact
Damage to corporate reputation can reduce consumer trust.
Loss of business partnerships due to perceived insecurity.
Long-term decline in investor confidence.
4.4 Strategic Impact
Cyberattacks can influence trade policies and international relations.
Heightened geopolitical tensions may result from state-sponsored cyber intrusions.
Businesses may reconsider expansion into high-risk regions.
5. Key Cybersecurity Challenges in Global Trade
5.1 Complex Supply Chains
Global trade involves multi-tiered supply chains, making it difficult to ensure consistent cybersecurity across all partners. A single weak link can compromise the entire chain.
5.2 Cross-Border Data Regulation
Trade across borders must navigate diverse cybersecurity laws, such as:
General Data Protection Regulation (GDPR) in Europe
Cybersecurity Law in China
Cyber Incident Reporting Requirements in the U.S.
Non-compliance increases legal risks and operational burdens.
5.3 Legacy Systems
Many trade platforms still rely on outdated software vulnerable to cyberattacks. Modernization is costly and complex.
5.4 Lack of Cybersecurity Awareness
SMEs, which play a critical role in global trade, often lack awareness and resources to implement robust cybersecurity measures.
5.5 Emerging Technologies
While technologies like blockchain, AI, and IoT improve efficiency, they also introduce new vulnerabilities requiring constant monitoring and adaptation.
6. Cybersecurity Strategies for Global Trade
6.1 Risk Assessment
Identify and prioritize assets, systems, and processes critical to trade operations.
Evaluate threats from internal and external actors.
Conduct periodic security audits and penetration testing.
6.2 Supply Chain Security
Implement supplier vetting and continuous monitoring.
Establish cybersecurity requirements for partners.
Use blockchain to track goods and verify authenticity.
6.3 Data Protection
Encrypt sensitive trade and financial data.
Implement secure communication protocols.
Adopt robust access controls and identity management.
6.4 Incident Response and Recovery
Develop and test cybersecurity incident response plans.
Establish disaster recovery systems to maintain operations.
Maintain cyber insurance to mitigate financial losses.
6.5 Regulatory Compliance
Stay updated on regional and international cybersecurity regulations.
Conduct audits to ensure compliance with standards like ISO 27001 or NIST frameworks.
6.6 Employee Training
Regular cybersecurity awareness programs for staff and partners.
Phishing simulations and security drills to reinforce best practices.
7. Role of Governments and International Organizations
7.1 Governments
Enact cybersecurity laws for critical trade infrastructure.
Establish national CERTs (Computer Emergency Response Teams) to respond to threats.
Promote public-private partnerships to share threat intelligence.
7.2 International Organizations
World Trade Organization (WTO): Encourages digital trade policies and security standards.
International Maritime Organization (IMO): Provides cybersecurity guidelines for shipping.
International Chamber of Commerce (ICC): Develops best practices for digital trade security.
7.3 Multilateral Cooperation
Information sharing between countries on cyber threats.
Harmonization of standards to reduce cross-border compliance complexity.
Joint exercises to strengthen collective resilience.
8. Technological Solutions for Cybersecurity in Trade
8.1 Blockchain
Enhances transparency and traceability in supply chains.
Reduces fraud and unauthorized access.
8.2 AI and Machine Learning
Detect anomalous patterns indicating cyberattacks.
Automate threat detection and response.
8.3 Encryption and Secure Communication
Protect sensitive trade data during transmission.
Prevent interception of financial transactions.
8.4 IoT Security Solutions
Implement device authentication and network segmentation.
Monitor IoT devices for unusual behavior.
8.5 Cloud Security
Secure cloud platforms hosting trade systems with multi-factor authentication and encryption.
Continuous monitoring and automated threat mitigation.
9. Case Studies in Cybersecurity for Trade
9.1 Maersk Shipping (2017)
NotPetya ransomware attack disrupted global shipping operations.
Highlighted the vulnerability of logistics networks.
Led to investments in cyber resilience and contingency planning.
9.2 SolarWinds Attack
Compromised software used by multiple trade organizations.
Demonstrated risks of supply chain attacks and dependency on third-party software.
9.3 Alibaba and E-commerce Platforms
Implemented AI-based monitoring and anti-fraud measures.
Showcases proactive cybersecurity strategies in digital trade.
10. Future Trends in Cybersecurity for Global Trade
10.1 Increased Automation and AI
Automated threat detection and response will become essential.
Predictive analytics will help anticipate cyberattacks.
10.2 Expansion of Digital Trade
Growing cross-border e-commerce will require stronger cybersecurity frameworks.
Small and medium-sized enterprises will need affordable, scalable security solutions.
10.3 Regulatory Evolution
Governments will tighten cyber compliance requirements for trade.
International harmonization of cybersecurity standards may accelerate.
10.4 Cybersecurity as a Trade Differentiator
Companies with robust cyber defenses will gain trust and competitive advantage.
Cyber insurance and certifications may become prerequisites for global trade partnerships.
11. Conclusion
Cybersecurity is a critical pillar of modern global trade. As trade becomes increasingly digitized, vulnerabilities multiply, and the cost of cyber incidents can be enormous—financially, operationally, and reputationally. Effective cybersecurity in trade requires a multi-layered approach: technological safeguards, regulatory compliance, risk management, supply chain security, and human awareness. Governments, international organizations, and businesses must collaborate to develop resilient, adaptive, and forward-looking cybersecurity strategies.
Investing in cybersecurity is no longer just a technical concern—it is a strategic necessity that ensures the sustainability, efficiency, and trustworthiness of global trade. Organizations that prioritize cybersecurity will not only protect their operations but also contribute to a more secure and resilient global trading ecosystem.
Climate Change as a Global Trade Disruptor1. Climate Change and Global Trade: The Interconnection
Trade depends on geography, climate, and natural resources. Historically, favorable weather and fertile lands enabled agricultural exports, while stable oceans and rivers facilitated shipping routes. Climate change disrupts all three:
Geography: Rising sea levels threaten coastal cities and ports, where nearly 90% of international trade passes through.
Climate: Heatwaves, floods, and droughts directly impact agricultural yields and energy production.
Natural Resources: Water scarcity and declining biodiversity affect commodity supply.
In short, climate change doesn’t just affect the environment—it directly alters the conditions of trade.
2. Extreme Weather Events and Supply Chain Disruptions
One of the most immediate trade-related consequences of climate change is the increase in extreme weather events. Hurricanes, cyclones, floods, and wildfires damage factories, ports, and transport infrastructure.
Hurricane Katrina (2005): Shut down Gulf Coast oil refineries, sending global oil prices soaring.
Thailand floods (2011): Disrupted automotive and electronics supply chains worldwide.
Australia’s bushfires (2019–2020): Reduced coal exports and disrupted agriculture.
Today’s supply chains are highly interdependent and globalized. A single event in one country can delay production worldwide. For example, flooding in Vietnam affects garment exports to Europe, while droughts in Brazil push up global coffee prices.
Climate-induced supply chain shocks are becoming the new normal. This creates price volatility, inflationary pressures, and higher insurance premiums for shipping and logistics.
3. Agriculture and Food Security in Global Trade
Agriculture is one of the most climate-sensitive sectors and a cornerstone of global trade. Crops like wheat, rice, coffee, and cocoa rely on predictable weather patterns. Climate change threatens this balance in multiple ways:
Droughts in Africa: Reduce maize and sorghum yields, raising import dependency.
Heat stress in India: Threatens rice and wheat production, impacting global food markets.
Coffee production in Brazil & Vietnam: Faces declining suitable land due to rising temperatures.
Food security becomes a trade issue when nations impose export bans to protect domestic supply. During the 2008 food crisis, countries like India and Vietnam restricted rice exports, causing prices to spike globally. Similar patterns may repeat more frequently as climate shocks worsen.
This also affects agribusiness trade patterns. Countries that can adapt (through irrigation, genetic crop engineering, or technology) may dominate future food exports, while vulnerable regions face dependency and trade deficits.
4. Maritime Trade and the Impact on Shipping
Around 80–90% of global trade moves by sea. Climate change is disrupting this backbone in several ways:
Rising Sea Levels: Ports in Bangladesh, Miami, Rotterdam, and Shanghai face flooding risks.
Hurricanes & Cyclones: More frequent storms damage ships and delay cargo.
Melting Arctic Ice: While it opens new shipping routes (e.g., Northern Sea Route), it also creates geopolitical tensions and environmental hazards.
Shallow Water Levels: Droughts in rivers like the Rhine (Europe) and Mississippi (U.S.) reduce shipping capacity.
Insurance and shipping costs rise as companies face unpredictable risks. In turn, these higher costs filter down to consumers through inflation in global trade prices.
5. Energy Trade and Transition
Energy is the engine of trade, but climate change is reshaping both supply and demand.
Fossil Fuel Disruption:
Rising storms affect offshore oil rigs.
Droughts limit water needed for cooling in coal and nuclear plants.
Heatwaves reduce energy efficiency in transportation.
Green Energy Transition:
Demand shifts toward renewable energy technologies (solar panels, wind turbines, EV batteries).
Countries rich in critical minerals (lithium, cobalt, rare earths) gain new trade power.
Nations dependent on fossil fuel exports (like Gulf countries) face future trade risks.
Energy trade is entering a transitional phase, with climate change accelerating the shift toward renewables while simultaneously destabilizing fossil fuel-dependent economies.
6. Climate-Induced Migration and Labor Disruptions
Climate change displaces millions of people due to floods, droughts, and rising seas. According to the World Bank, by 2050, over 200 million people may become climate migrants.
This has direct trade implications:
Labor shortages in agriculture and manufacturing.
Shifting consumer bases as populations relocate.
Trade tensions between host and origin countries.
For example, migration from Central America to the U.S. is partly driven by droughts destroying crops. This alters not just migration policies but also regional trade agreements.
7. Geopolitical Tensions and Trade Wars Linked to Climate
Climate change also fuels geopolitical trade disruptions. Nations with scarce resources (water, arable land, minerals) may restrict exports or engage in conflicts.
Water wars: Between India and Pakistan, or Egypt and Ethiopia, may affect food and trade flows.
Carbon tariffs: The EU’s Carbon Border Adjustment Mechanism (CBAM) imposes costs on imports from high-emission industries, creating new trade barriers.
Resource nationalism: Countries with critical minerals (like Chile for lithium, Congo for cobalt) may restrict exports for domestic benefit, disrupting global supply chains.
Climate change is not just an environmental issue—it’s a geo-economic disruptor reshaping trade alliances and policies.
8. Financial Risks and Trade Insurance
Trade finance and insurance are also feeling the impact:
Rising premiums for ships navigating storm-prone routes.
Higher borrowing costs for exporters in climate-vulnerable regions.
Credit risk as companies in flood-prone areas default on loans.
International banks and insurers are now pricing climate risk into trade deals. This makes it more expensive for vulnerable developing countries to participate in global trade.
9. Adaptation Strategies: Business and Government Responses
Despite the risks, nations and corporations are adapting strategies to reduce disruptions:
Diversification of Supply Chains: Companies are sourcing from multiple regions to reduce climate risks.
Resilient Infrastructure: Investments in flood-resistant ports, smart logistics, and renewable energy.
Trade Policy Reforms: WTO and regional trade blocs are incorporating climate clauses into agreements.
Technological Innovations: AI, blockchain, and IoT for supply chain visibility and risk prediction.
Sustainable Shipping: Investments in low-carbon fuels and energy-efficient vessels.
Adaptation is no longer optional—it is becoming central to trade competitiveness.
10. Future Outlook: Trade in a Climate-Disrupted World
Looking ahead, climate change will continue to reshape trade in profound ways:
Winners and Losers: Climate-resilient nations (Nordics, Canada) may gain trade advantages, while vulnerable regions (South Asia, Sub-Saharan Africa) face disruptions.
Regionalization: To reduce risk, companies may shorten supply chains and rely more on regional trade than global trade.
Climate-Linked Trade Agreements: Carbon border taxes and environmental standards will redefine competitiveness.
Innovation-Driven Trade: Renewable energy technologies, carbon-capture products, and climate-adaptation tools will dominate exports.
In short, climate change will not stop trade, but it will transform it.
Conclusion
Climate change is one of the greatest disruptors global trade has ever faced. Unlike temporary crises—such as financial crashes or pandemics—it is a long-term, structural challenge. It reshapes production, transportation, labor, and even the rules of trade itself. From floods that halt factory production to tariffs on carbon-heavy imports, climate risks ripple through every link of the global supply chain.
The future of trade depends on how quickly nations, businesses, and institutions adapt. Those who build resilience, embrace sustainability, and innovate will thrive. Those who delay will face escalating costs, shrinking markets, and geopolitical vulnerabilities.
Ultimately, climate change is not just an environmental problem—it is a trade problem, an economic problem, and a global governance problem. Recognizing it as a trade disruptor is the first step toward building a system that can withstand its impact.