Market Structure Shift (MSS) & Break of Structure (BOS) - GuideIntroduction
Understanding market structure is fundamental to becoming a consistently profitable trader. Two key concepts that Smart Money traders rely on are the Break of Structure (BOS) and the Market Structure Shift (MSS) . While they may seem similar at first glance, they serve different purposes and signal different market intentions.
In this guide, we will break down:
- The difference between BOS and MSS
- When and why they occur
- How to identify them on your charts
- How to trade based on these structures
- Real chart examples for visual clarity
---
Break of Structure (BOS)
A Break of Structure is a continuation signal. It confirms that the current trend remains intact. BOS typically occurs when price breaks a recent swing high or low in the direction of the existing trend .
Key Characteristics:
- Happens with the trend
- Confirms continuation
- Can be used to trail stops or add to positions
Example:
In an uptrend:
- Higher High (HH) and Higher Low (HL) form
- Price breaks above the last HH → BOS to the upside
---
Market Structure Shift (MSS)
Market Structure Shift signals a potential reversal . It occurs when price breaks a significant swing level against the prevailing trend and is often followed by a shift in the internal structure (e.g., lower highs after higher highs).
Key Characteristics:
- Happens against the trend]
- Signals possible trend reversal
- Often occurs after a liquidity grab or stop hunt
- Optional: is created by a displacement candle
Example:
In an uptrend:
- Price takes out a significant high (liquidity grab)
- Then aggressively breaks the most recent HL → MSS to the downside
---
How to Identify BOS and MSS
For BOS:
1. Determine the current trend.
2. Identify swing highs/lows.
3. Look for price breaking past these levels in the same direction as the trend .
For MSS:
1. Look for signs of exhaustion or liquidity grabs near swing highs/lows.
2. Watch for price to break against the trend structure .
3. Confirm with a shift in internal structure (e.g., lower highs start forming in an uptrend).
---
Using BOS and MSS in Your Trading Strategy
With BOS:
- Use it to confirm trend continuation
- Add to your position after a retracement into an OB or FVG
- Trail your stop-loss below the most recent HL or above LH
With MSS:
- Look for confluence (liquidity sweep + MSS = strong signal)
- Use it to spot early reversal entries
- Wait for a confirmation candle or structure shift on LTF (1m, 5m, 15m)
- If the displacement candle is too big you can wait for the retest
---
Common Mistakes to Avoid
- Confusing BOS with MSS
- Ignoring higher timeframe context
- Trading MSS too early without confirmation
- Chasing BOS without waiting for a proper retracement
Pro Tip: Use BOS/MSS with confluences like SMT Divergence, IFVGs, or key session times for higher probability setups.
---
Final Thoughts
Mastering BOS and MSS will give you an edge in understanding price delivery and anticipating market moves. BOS confirms strength in the current trend, while MSS warns of a possible reversal and new trend forming. Combine these with smart money tools, and you’ll be equipped to enter the market like a pro.
Happy Trading!
Harmonic Patterns

RSI-Volume Momentum Signal Score: Trading the Momentum PressureThe indicator used in this chart is an updated version of the RSI-Volume Momentum Score.
The RSI-Volume Momentum Signal Score is a predictive technical indicator designed to identify bullish and bearish momentum shifts by combining volume-based momentum with the Relative Strength Index (RSI). It generates a Signal Score derived from:
• The divergence between short-term and long-term volume (Volume Oscillator), and
• RSI positioning relative to a user-defined threshold. The Signal Score is calculated as follows:
Signal Score = tanh((vo - voThreshold) / scalingFactor) * ((rsiThreshold - rsi) / scalingFactor)
The logic of this formula are as follows:
• If Volume Oscillator >= Volume Threshold and RSI <= RSI Threshold: Bullish Signal (+1 x Scaling Factor)
• If Volume Oscillator >= Volume Threshold and RSI >= (100 – RSI Threshold): Bearish Signal (-1 x Scaling Factor)
• Otherwise: Neutral (0)
The tanh function provides the normalization process. It ensures that the final signal score is bounded between -1 and 1, increases sensitivity to early changes in volume patterns based on RSI conditions, and prevent sudden jumps in signals ensuring smooth and continuous signal line.
This updated version Introduces colored columns (green and red bars) representing momentum pressure directly. These bars:
o Green bars represent bullish pressure when the signal score is +1.
o Red bars represent bearish pressure when the signal score is -1.
o The transition point from one color to another acts as a visual signal of momentum reversal.
LONG SIGNAL: A transition from green bar to red bar indicates that bullish pressure has reached a tipping point—price is likely to rise soon.
SHORT SIGNAL: A transition from red bar to green bar signals bearish pressure is peaking—potential price drop ahead.
These transitions become intuitive signals for bullish or bearish entries, depending on the context.

Inversion Fair Value Gaps (IFVGs) - A Deep Dive Trading GuideIntroduction
Inversion Fair Value Gaps (IFVGs) are an advanced price action concept rooted in Smart Money theory. Unlike standard Fair Value Gaps (FVGs), IFVGs consider the idea of price revisiting inefficiencies from an inverse perspective. When price "respects" a previously violated gap from the opposite side, it creates a powerful confluence for entries or exits.
This guide will cover:
- What an IFVG is
- How it differs from traditional FVGs
- Market context for IFVG setups
- How to trade them effectively
- Real chart examples for clarity
---
What is an IFVG?
An Inversion Fair Value Gap (IFVG) occurs when price trades through a traditional Fair Value Gap and later returns to that area, but instead of continuing in the original direction, it uses the gap as a support or resistance from the other side.
Standard FVG vs. IFVG:
- FVG: Price creates a gap (imbalance), and we expect a return to the gap for mitigation.
- IFVG: Price violates the FVG, but instead of invalidation, it respects it from the other side.
Example Logic: A bullish FVG is formed -> price trades through it -> later, price revisits the FVG from below and uses it as resistance.
---
Structure and Market Context
Understanding structure is key when trading IFVGs. Price must break structure convincingly through a Fair Value Gap. The gap then acts as an inversion zone for future reactions.
Ideal Market Conditions for IFVGs:
1. Market is trending or has recently had a strong impulsive move.
2. A Fair Value Gap is created and violated with displacement .
3. Price retraces back to the FVG from the opposite side .
4. The gap holds as support/resistance, indicating smart money has respected the zone.
---
Types of IFVGs
1. Bullish IFVG: Price trades up through a bearish FVG and later uses it as support.
2. Bearish IFVG: Price trades down through a bullish FVG and later uses it as resistance.
Note: The best IFVGs are often aligned with Order Blocks, liquidity levels, or SMT divergences.
---
How to Trade IFVGs
1. Identify a clear Fair Value Gap in a trending market.
2. Wait for price to break through the FVG with momentum .
3. Mark the original FVG zone on your chart.
4. Monitor for price to revisit the zone from the other side.
5. Look for reaction + market structure shift on lower timeframes.
6. Enter trade with a clear stop loss just beyond the IFVG.
Entry Confluences:
- SMT divergence
- Order Block inside or near the IFVG
- Breaker Blocks
- Time of day (e.g., NY open)
---
Refined Entries & Risk Management
Once the IFVG is identified and price begins to react, refine entries using:
- Lower timeframe market structure shift
- Liquidity sweeps just before tapping the zone
- Candle closures showing rejection
Risk Management Tips:
- Set stop loss just beyond the IFVG opposite wick
- Use partials at 1:2 RR and scale out based on structure
- Don’t chase missed entries—wait for clean setups
---
Common Mistakes to Avoid
- Confusing IFVG with invalidated FVGs
- Trading them in low volume or choppy conditions
- Ignoring market context or structure shifts
- Blindly entering on first touch without confirmation
Tip: Let price prove the level—wait for reaction, not prediction.
---
Final Thoughts
IFVGs are an advanced but powerful tool when used with precision. They highlight how Smart Money uses inefficiencies in both directions, and when combined with other concepts, they can form sniper-like entries.
Practice finding IFVGs on historical charts. Combine them with SMT divergences, OBs, and market structure, and soon you’ll start seeing the market through Smart Money eyes.
Happy Trading!

Futures electronic hoursFutures electronic hours
💡 This idea focuses on trading futures during the electronic trading hours — the periods outside the regular cash session, where unique price behavior often occurs due to lower liquidity and algorithmic dominance.
📊 Core Strategy:
During electronic hours (typically post-market/pre-market), futures like ES, NQ, or CL often show sharp moves driven by global macro news, low-volume liquidity zones, or overnight positioning. These moves can offer high-probability setups when combined with key levels from the regular session.
🧠 How to use it:
1. Mark key support/resistance levels from the previous regular session.
2. During electronic hours (e.g., 6 PM – 9 AM ET), monitor price interaction with these levels.
3. Look for rejection, breakout, or fakeout signals, ideally with volume spikes.
4. Use tight risk management due to increased volatility and spreads.
⏱️ Electronic hours are often overlooked but can offer clean technical setups for experienced traders, especially in quiet news environments or after major macro releases.
📌 Works well with futures contracts like ES, NQ, CL, and GC. Can also be adapted for FX and crypto markets which trade 24/7.

RSI + BB strategy - the strong duo you will ever need to win Hello traders!
This article shares with you a strategy employing two famous indicators that have stood the test of time and used by professionals and amateurs alike. A solid trading plan needs at least one solid strategy which will be your bread and butter. You can always add more strategies or game plans to your repertoire but you need to master one. Trading can be as complicated or simple as you make it. To make sense of it all, you should always try to be realistic and stick to a trading plan which is "simple and stupid" so that you free your mind from overthinking and focus on the market movements instead. A good strategy, along with constant market trend analysis, good risk management, news awareness and emotion control can ultimately transition you to being a consistent profitable trader. Indeed, there are times where the odds will not be in your favour and you will have losing trades. However, the key to success is to think of trading as a game of probability and developing a winning edge that ensures you are profiting more than losing. A 1:2 RRR is the least you have to accept when entering a trade, else sit tight and wait for the next opportunity. As Jesse Livermore quoted, "It never was my thinking that made the big money for me. It always was my sitting. Got that? My sitting tight!".
RSI
Developed by J. Welles Wilder Jr. In 1978, the relative strength index is a momentum indicator that measures the speed and magnitude of price changes. At 70+, RSI is considered overbought and a retracement in price may occur. At 30-, RSI is considered oversold and price may go up. The middle line is the mean of recent prices, usually during a 14 days period.
BB
Developed by John Bollinger much later in the 1980s, BB is a volatility indicator which measures the speed and extent of price changes. A wider band signals high volatility and a narrow band signals low volatility. When price reaches the upper band, the asset is considered overbought and price may retract. When price reaches the lower band, the asset is considered oversold, meaning there are less and less sellers in the market and price may go up. The middle line is usually a simple moving average, showing the mean price across a time period.
RSI + BB strategy
The combination relies, and truthfully so, on the fact that the price of an asset usually hovers around its mean. Unless there are significant macroeconomic changes and news are strong (ultimately forming a new trend), price does not deviate much from its mean. It continues and builds its existing trend and moves up and down the moving average. By meauring both the momentum and volatility of the price, while keeping an eye on the direction of the trend, a trader can place small trades with a minimum 1:2 RRR as the asset moves in a range, an uptrend or a downtrend. The indicators give you insight on where to buy and place your SL and TP.
Trading set ups
- RSI 70+, BB touching upper band, no news, BB horizontal (showing a ranging market), price at major resistance zone - sell because price is likely to move through the moving average towards to lower band
- RSI 30-, BB touching lower band, no news, BB horizontal (showing a ranging market), price at major support zone- buy because price is likely to move through the moving average towards to upper band
- RSI 70+, BB touching upper band (price climbing up the BB ladder), BB moving upwards (uptrend), strong good news - buy because price is in uptrend and trend is likely to continue
- RSI 30-, BB touching lower band (price falling off the BB cliff), strong bad news - sell because price is in downtrend and trend is likely to continue
Sitting tight
-Playing on a 1hr timeframe, there won't be many instances when all these stars align. That is when you sit tight and wait.
- When price is hovering in between the RSI grid and BB band - sit tight and wait because the odds are not in your favour and it is impossible to predict which way price will move. Let the market do its thing, protect your capital and wait for the market to show you what to do next.
Note
- When the conditions are met, always enter the trade as soon as you get confirmation. If you are late in entry, skip the trade and wait
- Place your SL just above the upper BB if selling or just below the lower BB if buying
- TP is essential so you can lock in profits, especially in ranging markets where price quickly touches the BB band and bounces back. If you are in a trade and not able to monitor it, a TP ensures you have closed your trade at your desired and predicted price. TP is placed close to the lower band if selling or close to the upper band if buying
-Ensure that all your other criteria such as news, RRR and emotion control are met to enter a trade. If one is not met, this trade is not for you.
- Familiarise yourself using alerts. You have to be able to be present when the opportunity presents itself. Tradingview's lowest paid plan gives you 20 alerts, which is more than sufficient if you are focusing on 4-5 assets only. Alerts add to your winning edge and enable you to be trading the best set ups when they form.
Please do not hesitate to share your thoughts if you do use RSI and/or BB and have had positive outcomes. :)
GL to all!

Blueprint for Becoming a Successful Forex Trader in 2025🚀 Blueprint to Becoming a Successful Forex Trader in 2025: Leveraging ICT, Automation, and Prop Funding
Here’s a detailed, actionable blueprint designed to position you for success by carefully navigating broker selection, adopting advanced trading strategies, obtaining prop funding, and integrating automation and AI technologies into your trading.
🏦 Broker Selection (Actionable Steps)
🔍 Choose brokers with true ECN/STP execution
⚡ Ensure brokers offer low spreads (0.0-0.2 pip average) and fast execution to maximize ICT precision entries.
🛡️ Prioritize brokers regulated by ASIC, FCA, or FSCA with verified Myfxbook execution reports.
📊 Confirm broker compatibility with MetaTrader 4 (MT4) to seamlessly integrate Expert Advisors (EAs).
💳 Check for flexible withdrawal/deposit methods and swift payouts (Crypto, Wise, Revolut).
🎯 Trading Strategy (ICT Concepts & Supply-Demand Zones)
🧠 Master ICT Concepts: Liquidity sweeps, Order Blocks (OB), Fair Value Gaps (FVG), Market Structure Breaks (MSB).
📍 Combine ICT with Supply-Demand: Identify institutional supply-demand zones aligning with ICT Order Blocks & liquidity areas.
📐 Execute High-Probability Setups: Trade only after liquidity grabs at key daily/weekly ICT points, avoiding retail traps.
📈 Time & Price Theory: Trade London Kill Zones and New York Open exclusively, exploiting predictable ICT volatility.
📆 Weekly Preparation: Annotate D1/H4 charts on weekends marking liquidity points, order blocks, and premium/discount zones clearly.
💰 Getting Prop Funding (Actionable Approach)
🥇 Target reputable prop firms (FTMO, MyForexFunds, The Funded Trader, 8cap, etc) with clear and attainable evaluation objectives.
📑 Use ICT trading style for evaluation: lower-frequency, high-probability trades with clearly defined risks.
🎯 Implement strict risk management rules: never exceed 1% risk per trade, aiming for steady account growth (5-10% monthly target).
📊 Monitor performance closely using provided analytics dashboards (e.g., FTMO Metrics App) and adapt accordingly.
📚 Diversify funded accounts across multiple firms, compounding total available trading capital while reducing firm-specific risk.
⚙️ Automating & Executing Trades (MT4 EA & Bots)
🛠️ Hire experienced MQL4 developers to code custom ICT-based MT4 Expert Advisors
🤖 Develop EAs specifically around ICT logic (Order Block detection, liquidity grabs, market structure shifts) and or supply/demand logic
🤖 use advanced algo based breakout EAs for automation
📌 Automate trade management: EAs should handle entry precision, partial exits, break-even stops, and trail stops.
📡 Set EAs on VPS Hosting (NY4, LD4) for optimal latency and consistent execution (ForexVPS, AccuWeb Hosting).
📈 Regularly perform forward-testing and optimization of EAs on demo accounts before live deployment (at least quarterly optimization).
📲 Integrating Advanced Bots and Technology in 2025
📊 Combine your MT4 EAs with third-party analytics platforms for detailed trade performance insights.
🔮 Incorporate AI-based forecasting tools to refine ICT setups and trade signals.
🔔 Use automated bots for real-time alerts on ICT-based setups via Telegram or Discord channels.
🧑💻 Maintain manual oversight for discretionary ICT decisions—use automation for entry efficiency, not blind reliance.
🔄 Continuously retrain and update your bot’s logic monthly using the most recent trade data, ensuring adaptive execution.
🗓️ Daily Routine for Success
🌅 Pre-session (30 mins): Review annotated charts, ICT concepts (liquidity, OB, FVG), and supply-demand levels.
💻 During trading session: Monitor EA execution, manually adjust positions based on real-time ICT setups.
📝 Post-session (15 mins): Journal trades meticulously in detail, noting ICT reasoning behind wins and losses.
📆 Weekly review: Assess overall ICT & EA performance—adjust EA parameters as needed to match evolving market conditions.
📚 Continuous learning: Keep updated on advanced ICT framework,
supply demand zone trading.
📌 Final Actionable Advice for 2025
🔍 Specialize intensely on ICT & supply-demand concepts rather than multiple strategies—depth over breadth.
🚩 Always adapt and evolve your trading algorithms to ICT methodology—market dynamics continually change.
🧘 Maintain emotional discipline and patience, relying on high-probability setups to steadily compound your account.
💡 Stay ahead by embracing technology: automation, AI-driven forecasting, and custom ICT tools will provide a significant edge in 2025.

What Is an ABCD Pattern, and How Can You Use It in Trading?What Is an ABCD Pattern, and How Can You Use It in Trading?
Are you looking to improve your trading strategy and technical analysis skills? The ABCD trading pattern may be just what you need. This tool may help you identify potential market reversals and decide when to enter a trade. Keep reading to learn more about the ABCD pattern and how to apply it to your trading strategy.
What Is an ABCD Pattern?
The ABCD pattern is one of the basic harmonic patterns. It gives traders an idea of where the market might reverse. Therefore, when combined with other forms of technical analysis, it may be a great addition to your trading arsenal.
The ABCD pattern comprises two legs, AB and CD, and one retracement, BC, with D as an entry point. More specifically, an ABCD can be identified by:
- AB Leg: A trend starts at A and makes a high or low at B.
- BC Retracement: The price retraces from B to C.
- CD Leg: The trend continues from C to D.
- D Entry Point: Once another high or low forms and traders enter at D.
These price movements create the “zig-zag” or “lightning bolt” shapes.
In fact, ABCD patterns are present across every market and every timeframe. The up-down movements in financial assets represent opportunities to identify and trade ABCD patterns.
Why Use the ABCD Pattern in Your Trading Strategy?
Before we move on to identifying and trading the ABCD pattern, it’s worth explaining why you might want to consider using it. Here are a few reasons traders favour the ABCD pattern:
- It’s one of the harmonic patterns suitable for traders of all experience levels.
- It’s versatile and works for stocks, commodities, and cryptocurrencies*, not just forex trading.
- Traders use ABCD patterns to make informed decisions about potential turning points in the market.
- It can form the basis of a working trading strategy if used correctly alongside other forms of technical analysis.
- It provides quite an effective risk/reward ratio if reversals are caught.
How Traders Identify an ABCD Trading Pattern
The first step in finding ABCDs is to look for that classic zig-zag shape. Once you’ve found one, it’s time to apply Fibonacci ratios to confirm the pattern. If you’re struggling, you can consider using pre-made ABCD pattern indicators or scanners to help your eyes get used to spotting them.
The ABCD pattern requires that the BC leg is between a 38.2% to 78.6% retracement of AB, ideally between 61.8% and 78.6%. This means that if you put a Fibonacci retracement tool at A and B, C should be between 0.382 and 0.786.
The second CD leg should be a 127.2% to 161.8% extension of the BC retracement. For extra confirmation, consider specifying that AB is equal to the same length as CD.
While it can be tempting to start trading based on these conditions, you’ll find that, in practice, identifying point D can be trickier than it seems. That’s why traders typically use Fibonacci ratios, key levels, candlestick patterns, and higher timeframe convergence to confirm their entries, which we will touch on shortly.
ABCD Pattern Examples
Now that we understand how to identify the ABCD pattern, we can start applying it to real price action.
Note that the ratios won’t always be perfect, so allowing for slight variability above or below the defined ratios is acceptable.
Bullish ABCD Pattern
For a bullish formation, the following must be present:
- The AB leg should be between the high A and low B.
- The BC bullish retracement should be between the low B and high C, which is below the high A.
- The CD leg should be between the high C and low D.
- BC is a 38.2% to 78.6% retracement of AB, preferably between 61.8% and 78.6%.
- CD is a 127.2% to 161.8% extension of BC.
Additionally, you may look for AB to be an identical or similar length to CD.
Entry: Traders set a buy order at D.
Stop Loss: The theory suggests traders place a stop below a nearby support level or use a set number of pips.
Take profit: Traders place take-profit orders at the 38.2%, 50%, or 61.8% retracement of CD or hold for higher prices if they believe there’s the potential for further bullishness.
Bearish ABCD Pattern
The bearish ABCD chart pattern is essentially the same, just with the reversed highs and lows. As such:
- The AB leg should be between the low A and high B.
- The BC bullish retracement should be between the high B and low C.
- The CD leg should be between the low C and high D.
- BC is a 38.2% to 78.6% retracement of AB, preferably between 61.8% and 78.6%.
- CD is a 127.2% to 161.8% extension of BC.
You can choose to apply the same AB = CD rules in a bearish ABCD pattern if desired.
Entry: Traders typically place a sell order at D.
Stop Loss: A stop may be placed above a nearby resistance level or at a set number of pips.
Take profit: Traders often take profits at the 38.2%, 50%, or 61.8% retracement of CD or hold for lower prices if there’s a bearish trend on a higher timeframe.
ABCD Pattern Strategy
A momentum-based ABCD trading strategy can help traders confirm potential reversals by incorporating indicators like the RSI (Relative Strength Index). This approach often adds an extra layer of confluence.
Entry
- Traders may wait for point D to form and for the RSI to indicate overbought or oversold conditions, typically above 80 or below 20.
- Additional confirmation can be sought if there is a divergence between price and RSI, signalling weakening momentum.
- Once the RSI crosses back into normal territory, it can suggest a reversal, providing an opportunity to enter the market.
Stop Loss
- A stop loss is often placed slightly above or below point D, depending on whether the formation is bearish or bullish, respectively. This helps potentially manage risk in case the reversal doesn’t hold.
Take Profit
- Traders can consider taking profits at Fibonacci retracement levels of leg CD, such as 38.2%, 50%, or 61.8%.
- Another common target is point C, but traders may also hold the position for longer if further price movement is anticipated.
Looking for Additional Confluence
Given that trading the ABCDs usually relies on setting orders at specific reversal points, consider looking for extra confirmation to filter potential losing trades. Below, you’ll find three factors of confluence you can use to confirm your entries.
Key Levels
If your analysis shows that D is projected to be in an area of significant support or resistance, there’s a greater chance that the level will hold and the price will reverse in the way you expect.
ABCD Timeframe Convergence
One technique to potentially enhance the reliability of ABCD chart patterns is to check for multiple timeframes. When you identify the formation on a lower timeframe—say, the 5-minute chart—you can then look to a higher timeframe chart, such as the 30-minute or 1-hour chart to see the overall trend.
If the pattern converges with the longer-term trend, it strengthens the analysis and increases the likelihood of an effective trade.
Candlestick Patterns
Some traders look for particular candlestick patterns to appear. The hammer and shooting star patterns are commonly used by ABCD traders for extra confirmation, as are tweezer tops/bottoms and engulfing candles. You could choose to wait for one of these candlesticks to form before entering with a market order.
Common Mistakes to Avoid When Identifying an ABCD Chart Pattern
Of course, ABCD patterns aren’t a silver bullet when it comes to effective trading. There are several common mistakes made by inexperienced traders when trading these types of patterns, such as:
- Confusing the ABCD with other harmonic patterns, like the Gartley or three-drive pattern.
- Trading every potential ABCD formation they see. It’s preferable to be selective with entries and look for confirmation.
- Not being patient. ABCDs on higher timeframes can take days, even weeks, to play out.
Experienced traders wait for the pattern to develop before making a trading decision.
- Ignoring key levels. Instead, you could allow them to guide your trades and look for the ABCD pattern in these areas.
The Bottom Line
The ABCD pattern is a versatile tool that can enhance a trader’s ability to identify potential market reversals and refine their overall strategy. When combined with other forms of technical analysis, such as momentum indicators, an ABCD trading strategy can be an invaluable addition to your trading arsenal.
For traders looking to apply the ABCD pattern in forex, stock, commodity, and crypto* markets, consider opening an FXOpen account and take advantage of low-cost, high-speed trading across more than 600 assets. Good luck!
FAQ
What Is an ABCD Trading Pattern?
The ABCD trading pattern is a simple harmonic pattern used by traders to identify potential market reversals. It consists of three price movements: the AB leg, BC retracement, and CD leg, with point D marking a potential entry for a reversal trade. It helps identify changes in trend direction.
How Can You Use the ABCD Pattern in Trading?
Traders identify the ABCD pattern by finding the characteristic zig-zag shape and using Fibonacci ratios to confirm it. Entry points are typically placed at point D, with stop losses and profit targets based on the formation’s structure. Confluence with other technical analysis tools improves its reliability.
Is the ABCD Pattern Bearish or Bullish?
The ABCD pattern can be either bearish or bullish. A bullish ABCD indicates a potential upward reversal, while a bearish ABCD suggests a downward reversal. The structure remains the same, but the highs and lows are reversed.
What Is the ABCD Strategy?
The ABCD strategy revolves around identifying trend reversals using the formation and confirming entry points through tools like Fibonacci retracements or momentum indicators like the RSI for added accuracy.
*At FXOpen UK, Cryptocurrency CFDs are only available for trading by those clients categorised as Professional clients under FCA Rules. They are not available for trading by Retail clients.
This article represents the opinion of the Companies operating under the FXOpen brand only. It is not to be construed as an offer, solicitation, or recommendation with respect to products and services provided by the Companies operating under the FXOpen brand, nor is it to be considered financial advice.

Precision Trading – How Our Trade Played Out PerfectlyIntroduction
In trading, precision and patience are everything. We don’t chase trades—we wait for the perfect confluence of technical factors to align. This trade idea followed our systematic approach, utilizing ranges, Fibonacci levels, internal & inducement liquidity, break of structure (BOS), entry confirmation patterns, and harmonics. Here’s a breakdown of how it all unfolded.
1. Identifying the Range
Before executing, we mapped out the market structure to establish a clear range. The price action showed a well-defined consolidation zone, which helped us anticipate liquidity grabs and potential reversal points.
2. Fibonacci Confluence – 78.20% Level
Using the Fibonacci retracement tool, we identified the 78.20% level as a strong reaction point. This aligned with other key technicals, increasing our confidence in the trade setup.
3. Internal & Inducement Liquidity
Liquidity is key in trading. We spotted internal liquidity zones where price was likely to manipulate weak hands before the actual move. Inducement liquidity was also present, providing additional confirmation that price would tap into deeper levels before reversing.
4. Break of Structure (BOS) and Entry Confirmation
Once BOS occurred in alignment with our anticipated liquidity grab, we looked for our **entry pattern**. The market printed a textbook confirmation, allowing us to enter with precision and minimal risk.
5. Harmonic Pattern for Additional Confluence
The final piece of confirmation was a harmonic pattern, further validating our entry. These patterns, when combined with our overall strategy, add an extra layer of probability to our trades.
Trade Outcome
The execution was flawless! 🎯 The price respected our levels, moved in our favor, and hit our target zones with precision. This is the power of structured analysis and disciplined execution.
📉 Key Takeaway:Never trade blindly! Always have a solid confluence of technicals before taking a trade.**
🔎 What’s your go-to confirmation before entering a trade? Let’s discuss in the comments! 📩
#ForexTrader #ForexLifestyle #ForexSignals #DayTrading #TradingMindset #ForexMoney #PipsOnPips #ForexSuccess #ForexMotivation #MillionaireMindset #TradingStrategy #FXMarket #ForexWins #TradeSmart #MarketAnalysis #WealthBuilding #Investing #PriceAction #ChartAnalysis #Scalping #SwingTrading #FinancialFreedom #MakingMoneyMoves #HustleHard #NoDaysOff #MoneyMindset

ICT Concepts for FX and GOLD traders: 2025 edition🔍 ICT (Inner Circle Trader) is a trading methodology developed by Michael J. Huddleston. It focuses on market structure, smart money concepts (SMC), and how institutions manipulate liquidity to trap retail traders.
📚 It's not about indicators or over-complication — it's about reading the price action like a pro, understanding where liquidity is, and trading with the banks, not against them.
📐 1. Market Structure
Understand Highs & Lows: Identify break of structure (BOS) and change of character (CHOCH)
Follow the macro to micro flow: D1 > H4 > M15 for precision entries
🧱 2. Order Blocks (OBs)
An order block is the last bullish or bearish candle before a major price move.
Banks and institutions place large orders here.
Smart traders look for price to return to these areas (mitigation), then enter with tight stop losses.
👉 Think of OBs as institutional footprints on the chart.
💧 3. Liquidity Zones
Equal highs/lows, trendline touches, support/resistance — these are liquidity traps.
ICT teaches that price often hunts liquidity before reversing. That’s why many retail traders get stopped out.
Learn to trade into liquidity, not off it.
🔄 4. Fair Value Gaps (FVGs)
Also called imbalances — when price moves too fast and leaves gaps.
Price often retraces to "fill the gap" — a key entry point for ICT traders.
🥇 ICT for Gold & Forex in 2025
💰 Why It Works for XAUUSD & Majors:
Gold is a highly manipulated asset, perfect for ICT-style trading.
It responds beautifully to liquidity grabs, order blocks, and Asian–London–New York session transitions.
Forex majors (EUR/USD, GBP/USD, etc.) are also ideal since they’re heavily influenced by institutional flow and news-driven liquidity hunts.
🕐 Timing Is Everything
Trade Killzones:
📍 London Killzone: 2AM–5AM EST
📍 New York Killzone: 7AM–10AM EST
These are high-volume sessions where institutions make their moves.
📈 Typical ICT Setup
▪️Spot liquidity zone above or below recent price
▪️Wait for liquidity sweep (stop hunt)
▪️Identify nearby order block or FVG
▪️Enter on a pullback into OB/FVG
▪️Set tight SL just past the recent swing
Target internal range, opposing OB, or next liquidity level
👨💻 Why FX/GOLD Traders Love ICT
✅ It’s clean, no indicators, and highly logical
✅ Great for part-time trading — 1 or 2 trades a day
✅ Feels like "leveling up" your understanding of the market
✅ Perfect for backtesting and journaling on platforms like TradingView or SmartCharts
✅ Easy to integrate into algo-based systems or EAs for semi-automation
If you’re tired of indicators and guessing, and want to trade like the institutions, ICT is a game changer. In 2025, more prop firms and traders are applying ICT concepts to dominate markets like gold, forex, and even crypto.
🧭 Master the method. Understand the logic. Ride with the smart money.
🔥 Welcome to the next level of trading.

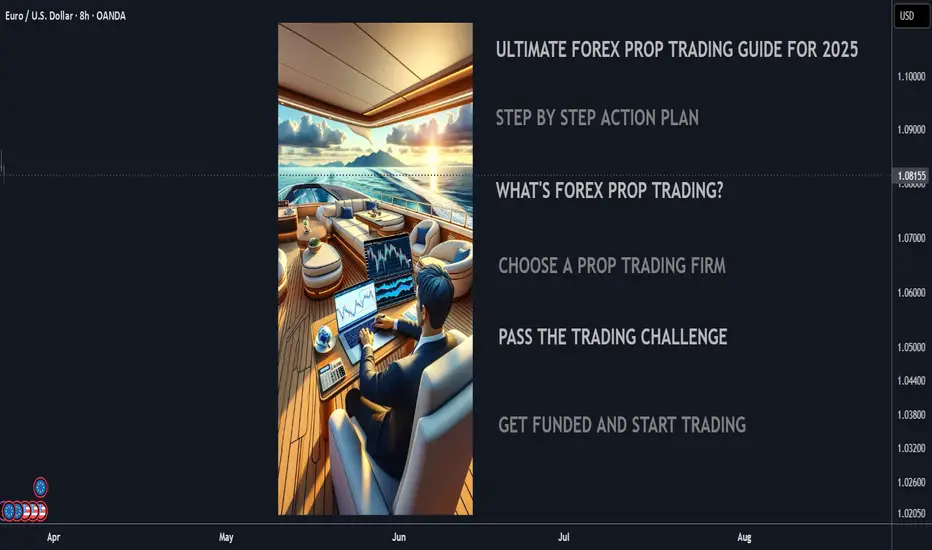
Ultimate 2025 Forex Prop Trading FAQ + Strategy Guide🧠 Forex Prop Trading: What Is It?
Prop trading (proprietary trading) is when a trader uses a firm’s capital to trade the markets (instead of their own), and keeps a share of the profits – usually 70–90%.
✅ Low startup cost
✅ No personal risk (firm takes the loss)
✅ Big upside potential with scaling plans
📋 Step-by-Step Action Plan to Get Started (2025)
🔍 1. Understand the Prop Firm Model
🏦 Prop firms fund skilled traders with $10K to $500K+
🎯 You pass a challenge or evaluation phase to prove your skills
💵 Once funded, you earn a profit split (70%–90%)
🧪 2. Choose a Top Prop Firm (2025)
Look for reliable and regulated firms with transparent rules:
FTMO 🌍 – Trusted globally, up to $400K scaling
MyFundedFX 📊 – Up to 90% profit split, no time limit
E8 Funding ⚡ – Fast scaling and instant funding
FundedNext 💼 – 15% profit share during challenge phase
The Funded Trader 🏰 – Up to $600K with leaderboard bonuses
🔎 Compare features: fees, drawdown limits, trading style freedom
💻 3. Train & Master Your Strategy
🧠 Pick a clear, rule-based strategy (e.g. trend following, breakout, supply/demand)
📅 Backtest over 6–12 months of data
💡 Use AI tools & trade journals like Edgewonk or MyFXBook
🎯 Focus on:
Win rate (above 50–60%)
Risk-reward ratio (1:2 or better)
Consistency, not wild profits
🧪 4. Pass the Evaluation Phase
🔐 Follow risk rules strictly (daily & max drawdown)
⚖️ Use proper risk management (0.5–1% risk per trade)
🧘♂️ Trade calmly, avoid overtrading or revenge trades
📈 Most challenges:
Hit 8–10% profit target
Stay under 5–10% total drawdown
Trade for at least 5–10 days
🧠 Tip: Pass in a demo environment first before going live!
💵 5. Get Funded & Start Earning
🟢 Once approved, you trade real firm capital
💰 You keep up to 90% of profits, with withdrawals every 2 weeks to 1 month
🚀 Many firms offer scaling plans to grow your account over time
💬 FAQ – Prop Trading in 2025
❓ How much can you make?
🔹 Small accounts ($50K): $2K–$8K/month with 4–8% returns
🔹 Large accounts ($200K+): $10K+/month possible for consistent traders
💡 Many traders start part-time and scale as they build trust with the firm
❓ How much do I need to start?
💳 Challenge fees range from:
$100 for $10K
$250–$350 for $50K
$500–$700 for $100K+
⚠️ No need to deposit trade capital – just the challenge fee
❓ What are the risks?
You can lose the challenge fee if you break rules or over-leverage
You won’t owe money to the firm
The biggest risk is psychological – many fail from overtrading or emotional decisions
🚀 Final Tips to Succeed
✅ Trade like a robot, think like a CEO
✅ Journal every trade – self-awareness is key
✅ Avoid over-leveraging and gambling mindset
✅ Stick to one strategy and master it
✅ Focus on consistency over quick wins
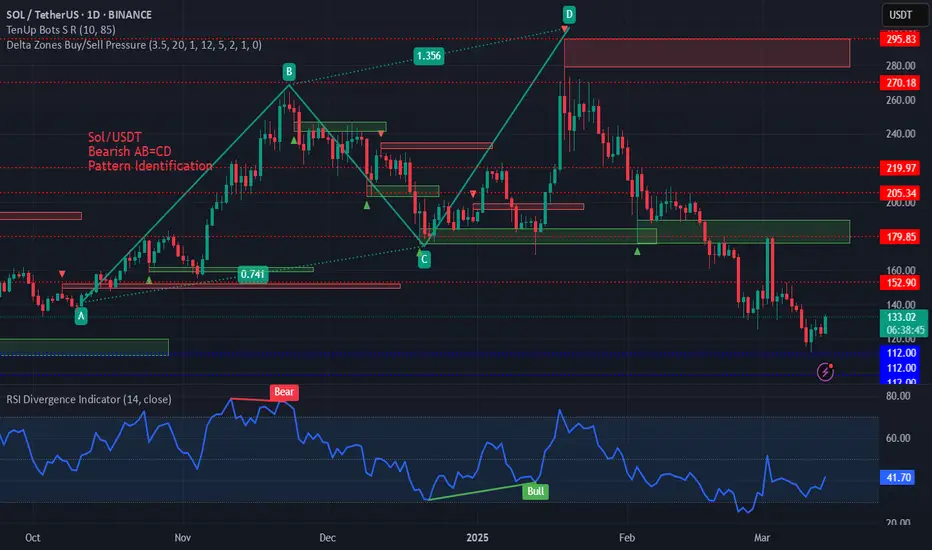
Pattern Identification on SOL/USD AB=CD Pattern on SOL/USDT on daily time frame.
These are harmonic patterns and these can be seen on hourly, 4h, 1day etc. time frames and the trader can take positions in the market according to the trend.
Predicting sell off, 30"++ in advance of a head and shouldersLet's examine how a head and shoulders is usually formed by a wave 4 and 5 and an A & B wave, the C wave is the sell off after the head and shoulders.
I use this pattern to predict a head and shoulders AT THE RIGHT NECKLINE. In this case 90 minutes in advance.. So 6 X 15 minute candles in advance we can predicted a H & S and a selloff, sound valubale?
if you understand this concept please give a thumbs up.
To go over price action again, we are going up on 5 waves. Wave 4 creates the left shoulder. After wave 5 we come down on an A wave, that is the right neckline.
This is where You can predict an B wave UP, and if it doesn't go higher than the previous wave 5, we will get a typical head and shoulder sell off after the wave B up.

Smart Money: Key Zones for Entry and Market RebalancingHello, friends!
Below is my market analysis, where for each key element of the Smart Money concept I use.
1. Premium/Discount zones allow me to quickly identify where capital works most profitably. Using the Fibonacci Correction tool, I find areas that indicate entry opportunities: buying in the discount zone and selling in the premium zone. This helps to form a basic picture of the market balance.
2.OTE helps me find optimal entry points by refining the zones defined by the basic correction. This tool allows me to look at possible entry areas in more detail, making the signals more accurate.
3. When analyzing market movements, I pay attention to FVGs that arise due to a lack of liquidity during impulse movements. Such cavities indicate an imbalance that the market is trying to eliminate, which creates additional opportunities for rebalancing and entering a position.
4.With ImpIMB analysis, I find imbalances where the center candle is significant and its wicks overlap on both sides. This allows me to isolate the zone that signals an aggressive market, giving additional trading clues without revealing all the details.
5.GAP is formed when a cavity appears between the extremes of candles due to a sharp market opening. Using Fibonacci, I outline these areas, because they often become benchmarks for future rebalancing and correction of market dynamics.
Best wishes Mvp_fx_hunter

TOP 5 TRADING SETUPS THAT MAY BE IN THE ARSENAL OF A SKIN TRADERSuccessful trading is not about “guessing the market”, but about clear strategies and discipline. Today I will show you 5 setups that really work and will help you find the entry point with the best risk management.
1️⃣ Breakout & Retest
✅ How I work:
The price breaks through the rhubarb (strong support/support).
Then it turns around, tests this rope and jumps.
🔍 What you need to joke about:
High volume under breakdown (strong impulse).
A clear retest without any deep push back.
Candle pattern confirmation (pin bar, clay, etc.).
📈 De vikoristuvati:
Cryptocurrency
Forex
Stock market
🔸 Example: BTC/USD breaks through $50,000, turns around, tests it as support - and goes up.
🛑 Stop loss: after the breakout (with a small margin).
🎯 Goal: 1:2 or 1:3 for risk management.
2️⃣ False Breakout
✅ How I work:
The price breaks through the rhubarb, but then quickly turns back.
This is a trap for those who “run after the market.”
🔍 What you need to joke about:
Great tail of the candle after breakdown (manipulation).
The volume falls after the breakdown - shows the weakness of the rukh.
Confirming reversal pattern (pin bar, clay).
📈 De vikoristuvati:
Crypt
Forex
NASDAQ, S&P500
🔸 Example: The price of Ethereum breaks through $3,500, but it quickly turns around under this pressure – the witches “took control.”
🛑 Stop loss: beyond the extreme of the fake breakout.
🎯 Purpose: front level of support/support.
3️⃣ Liquidity Grab
✅ How it works:
The price breaks through the level sharply, knocking out stops.
Then returns to the zone and changes direction.
🔍 What to look for:
A strong impulse movement with a sharp pullback.
Knocking out stops (candle tails).
High volume on the return.
📈 Where to use:
Forex
Stock markets
Cryptocurrency
🔸 Example: Before a big drop, BTC makes a sharp jump above $52,000, collects stops of longs - and then falls to $48,000.
🛑 Stop loss: short, following a manipulation move.
🎯 Target: the nearest liquidity zone.
4️⃣ Trendline Bounce
✅ How it works:
Price tests the trendline and bounces.
🔍 What to look for:
Minimum 3 touches of the trendline (it should be strong).
Bounce with confirmation (candlestick patterns, volume).
Previous support or resistance zone.
📈 Where to use:
Any market (crypto, forex, stocks).
🔸 Example: NASDAQ tests the rising trendline, bounces - long entry.
🛑 Stop loss: below the trendline.
🎯 Target: nearest resistance level.
5️⃣ Double Top / Double Bottom
✅ How it works:
The price forms two identical highs (or lows), after which a reversal occurs.
🔍 What to look for:
Symmetrical pattern (two tops/two bottoms).
Reversal signal (bearish or bullish candle).
High volume during the second touch.
📈 Where to use:
Stock market
Forex
Cryptocurrency
🔸 Example: SP500 makes a double peak at 4700 and falls.
🛑 Stop loss: just above the top/bottom.
🎯 Target: 50% or 100% of the figure.
Conclusion:
These setups work in any market if applied correctly! The main thing is not just to see the pattern, but to understand what is behind the price movement.
Subscribe so you don't miss new discussions!

US30 Trading Strategy That’s Been Proven to WorkThis strategy is backtested over trades and works best during the New York session (9:30 AM - 12 PM EST).
Here’s how it works:
Step 1: Identify Key Levels
These are the support & resistance areas where institutions place big orders.
Look for previous highs, lows,
Step 2: Wait for a Liquidity Grab
Banks love to trick retail traders by creating fake breakouts.
We wait for price to break a key level, trap traders, then reverse.
Step 3: Enter on Confirmation
Once we see a liquidity grab, we wait for a strong rejection candle (pin bar, engulfing, etc.).
Entry is placed at the close of the confirmation candle.
Step 4: Set Stop Loss & Take Profit
Stop loss: Just beyond the liquidity grab.
Take profit: At least 2x the stop loss distance for a 1:2 risk-reward ratio.

How to Predict Market Highs - Lows with Gann Astro Trading.How to Predict Market Highs & Lows with Gann Time & Price Theory
Gann Planetary Time Cycles | The Only Proven Way to Predict Market Reversals With 95% Accuracy.
In this in-depth Video, we explore Gann Astro Trading and uncover how Gann’s time and price square techniques can help predict major market reversals. By understanding Gann’s planetary cycles, you’ll learn how planetary movements influence price action and how traders can use this knowledge for precise entry and exit points.
🔹 What You Will Learn in This Video:
✅ How Gann used planetary cycles to forecast market trends
✅ The connection between time and price and how they square for reversals
✅ Identifying market turning points using planetary trend lines
✅ The significance of planetary longitudes and key angles (e.g., 135°, 180°) in trading
✅ Using major planetary pairs (e.g., Mars-Uranus, Saturn-Sun) to find support & resistance
✅ How traders subconsciously react to planetary movements and price levels
✅ The importance of using long-term charts for accurate forecasting
✅ Finding a universal price conversion for a stock, forex pair, or commodity
📈 Why Gann’s Astro Techniques Work:
Gann believed that financial markets move in harmony with planetary cycles. By applying his time cycles and planetary movements, traders can decode price action and anticipate future highs and lows.
Gann Astro Trading | The Secret to Predicting Market Reversals with Planetary Cycles
Gann Astro trading is a highly advanced market forecasting method that combines W.D. Gann’s time and price principles with planetary cycles, astrology, and mathematical timing techniques to predict market movements with unmatched precision. Gann believed that markets are not random but move in cyclical patterns influenced by celestial forces, planetary transits, and natural laws. By decoding these cycles, traders can anticipate highs, lows, reversals, and trend shifts before they happen, gaining a significant edge in forex, stocks, and crypto trading.
This strategy goes beyond conventional technical analysis by integrating astro-financial patterns, Gann angles, the Square of Nine, and harmonic time cycles to identify the exact moments when time and price align. When this happens, explosive market moves occur, creating high-probability trade setups with minimal risk. Whether you are a day trader or a long-term investor, mastering Gann Astro trading can help you forecast major market turning points, trade with confidence, and maximize profits while minimizing uncertainty.
Traders who apply Gann’s planetary time cycles understand how astro-trading indicators, retrogrades, conjunctions, and planetary aspects influence market behavior. Learning this powerful yet hidden method allows you to see what most traders miss, making it one of the most profitable and accurate trading techniques available today.

The Billionaire Trader & His Unlikely MentorWhen we think of legendary traders, Paul Tudor Jones stands out as one of the most successful billionaires in the financial world. But what many traders don’t realize is that behind his extraordinary success, there’s a powerful influence—Tony Robbins. Yes, the world-renowned life coach played a crucial role in shaping Jones’ mindset, ultimately helping him navigate markets and life with unparalleled confidence.
The Turning Point: Paul Tudor Jones Meets Tony Robbins
Paul Tudor Jones is best known for predicting the 1987 stock market crash and making a 200% return during the crisis. However, what truly set him apart from other traders wasn’t just his ability to read the markets—it was his mental game.
Jones has openly credited Tony Robbins for helping him gain a psychological edge. In the late 1980s, when Jones was already a successful trader but searching for deeper fulfillment and consistency, he sought Robbins’ mentorship. Robbins, known for his work in peak performance and psychology, introduced Jones to strategies that reshaped his thinking and emotional resilience.
The Mindset Shift That Changed Everything
So, what did Robbins teach Jones that made such a massive impact?
1. The Power of State Control
Robbins emphasizes that emotions drive decision-making. He taught Jones to manage his emotional state, ensuring that fear, greed, and hesitation didn’t cloud his judgment. This allowed Jones to make high-stakes trading decisions with confidence.
2. Priming and Visualization
One of Robbins’ core techniques is priming—training the mind to focus on success. Jones incorporated this by visualizing successful trades and reinforcing positive beliefs about his abilities. This mental conditioning helped him stay composed even in turbulent markets.
3. Wealth Psychology
Many traders fail because of limiting beliefs about money. Robbins helped Jones develop an abundance mindset, reinforcing that wealth creation is a game of psychology as much as it is about strategy.
4. The Importance of Giving Back
Robbins’ influence extended beyond trading. Jones became one of the biggest philanthropists in the financial world, believing that giving back creates a deeper sense of fulfillment and success. His Robin Hood Foundation has donated billions to fight poverty, something Robbins strongly advocates for in his teachings.
The Result: A Billionaire Trader with Unshakable Confidence
While Paul Tudor Jones had the technical skills of a master trader, Robbins’ mentorship gave him the mental and emotional fortitude to sustain long-term success. His ability to stay focused, disciplined, and resilient in volatile markets is a testament to the power of psychology in trading.
Key Takeaways for Traders
- Mindset is everything: The best trading strategies won’t work if your emotions control you.
- Daily mental conditioning matters: Visualization, priming, and self-belief can dramatically improve trading results.
- Success is holistic: Wealth is not just about money—it’s about impact, discipline, and personal growth.
Paul Tudor Jones’ story proves that trading isn’t just about charts and numbers—it’s about mastering your own psychology. And thanks to Tony Robbins, he became not just a billionaire, but an icon of both financial success and mental resilience.

Measured Moves: Understanding Harmonic SimplicityFew tools in trading are forward-looking and adapt to current volatility, Measured Moves do. Unlike traditional indicators, Measured moves offer a structured way to project price targets and turning points with no lag.
Let’s take a deep dive into the harmonic simplicity of the measure move and look at how it can be applied to real-world market conditions.
What Are Measured Moves?
A measured move is a price projection technique that assumes market swings tend to repeat in a proportional manner. By taking the length of a prior move and projecting it forward, traders can identify potential areas where price might react, either as a turning point or a continuation zone. This makes measured moves one of the few truly predictive tools in technical analysis—offering guidance without the lag that comes with moving averages or oscillators.
Beyond their predictive nature, measured moves are inherently adaptive. Markets move through phases of expansion and contraction, meaning fixed-length indicators can become unreliable when volatility shifts. Measured moves, by definition, adjust to the prevailing market conditions, making them particularly effective in dynamic environments.
Example: DXY Daily Candle Charts Measured Move
DXY Daily Candle Charts: Measured Moves
Past performance is not a reliable indicator of future results
Past performance is not a reliable indicator of future results
Timing Profit-Taking with Measured Moves
One of the most effective uses of measured moves is in setting profit targets. In trending markets, traders often struggle with the decision of when to exit—too early and they leave gains on the table, too late and they risk giving back profits. A measured move provides a logical framework for identifying where price may run out of steam.
The process is straightforward: take the length of a completed impulse move and project it from the swing low (in an uptrend) or swing high (in a downtrend) of a subsequent pullback. If price approaches this level and momentum starts to fade, it suggests a natural area for taking profits. This method ensures that you don’t rely solely on intuition or arbitrary levels but instead use market-driven symmetry to guide exits.
Example: FTSE 100 Breakout on Daily Candle Chart
Past performance is not a reliable indicator of future results
Past performance is not a reliable indicator of future results
Entering Two-Legged Pullbacks
Measured moves are also very useful for timing entries in corrective pullbacks—especially in two-legged retracements, which are common in trending markets. Price rarely moves in a straight line; instead, pullbacks often develop in two distinct waves or A,B,C,D pattern before resuming the dominant trend. This pattern can be frustrating for traders who enter too early, only to see price dip lower before the trend continues.
By measuring the size of the first pullback and projecting it forward, traders can anticipate the likely endpoint of the second leg. When price reaches this level and starts to stabilise, it provides a higher-probability entry for traders looking to trade with the trend. This technique works particularly well when combined with broader support or resistance levels, reinforcing key zones where buying or selling pressure may return.
Example: Gold Daily Candle Chart
Past performance is not a reliable indicator of future results
Past performance is not a reliable indicator of future results
Combining Measured Moves with Candle Patterns
Measured moves provide price-based structure, but confirmation from price action can refine entries and exits even further. Candlestick patterns help traders gauge sentiment at key measured move levels, offering a layer of confirmation before taking action.
For profit-taking, if price reaches a measured move projection and forms a reversal pattern—such as a shooting star in an uptrend or a hammer in a downtrend—it strengthens the case for locking in gains. Conversely, for entries, a two-legged pullback that completes at a measured move level becomes even more compelling when a bullish engulfing pattern or pin bar forms, signalling potential trend continuation.
By combining measured moves with candlestick confirmation, you avoid acting on rigid projections alone. Instead, you can use price action cues to validate measured move levels, improving decision-making and reducing false signals.
Summary:
Measured moves provide a structured, adaptable approach to navigating price action. Whether used for profit-taking or timing pullback entries, their ability to adjust to volatility and offer forward-looking projections makes them a valuable tool in a trader’s arsenal. When combined with candlestick patterns, they become even more effective, offering both precision and confirmation in a market that thrives on uncertainty.
Disclaimer: This is for information and learning purposes only. The information provided does not constitute investment advice nor take into account the individual financial circumstances or objectives of any investor. Any information that may be provided relating to past performance is not a reliable indicator of future results or performance. Social media channels are not relevant for UK residents.
Spread bets and CFDs are complex instruments and come with a high risk of losing money rapidly due to leverage. 83% of retail investor accounts lose money when trading spread bets and CFDs with this provider. You should consider whether you understand how spread bets and CFDs work and whether you can afford to take the high risk of losing your money.

Bullish & Bearish Reversal Divergence Trading in Forex🔍 Bullish & Bearish Reversal Divergence Trading in Forex: A Detailed Overview
Divergence is a powerful concept in technical analysis — it helps spot potential trend reversals and momentum shifts. Let’s dive into the details with clear strategies and some visual flair! 🚀
🧠 What is Divergence?
Divergence happens when price action and a technical indicator (like RSI, MACD, or Stochastic) move in opposite directions. This hints that the current trend is losing strength and a possible reversal is coming.
📈 Types of Divergence
🐂 Bullish Reversal Divergence (Buy Signal)
Price: Makes lower lows ⬇️
Indicator: Makes higher lows ⬆️
Meaning: Sellers are losing momentum; buyers might take over soon.
Signal: Potential uptrend reversal ahead.
🔑 Key Confirmation Tools:
Support zone bounce 🛑
Bullish candlestick patterns (Hammer, Engulfing) 🕯️
Increased buying volume 📊
💡 Example Setup:
RSI makes a higher low while price drops lower — prepare for a long (buy) position.
🐻 Bearish Reversal Divergence (Sell Signal)
Price: Makes higher highs ⬆️
Indicator: Makes lower highs ⬇️
Meaning: Buyers are losing strength; sellers could take control.
Signal: Potential downtrend reversal ahead.
🔑 Key Confirmation Tools:
Resistance zone rejection 🚧
Bearish candlestick patterns (Shooting Star, Engulfing) 🌑
Increased selling volume 📉
💡 Example Setup:
MACD makes a lower high while price pushes higher — prepare for a short (sell) position.
🛠️ Best Indicators for Divergence Trading
RSI (Relative Strength Index) – Tracks overbought/oversold conditions. 📊
MACD (Moving Average Convergence Divergence) – Measures momentum shifts. 💥
Stochastic Oscillator – Identifies trend strength and reversals. 🎢
🎯 Divergence Trading Strategies
1️⃣ Classic Divergence Strategy
Spot bullish or bearish divergence. 🔍
Confirm with support/resistance levels. 🧱
Wait for a reversal candlestick pattern (like a Doji, Engulfing, or Pin Bar). 🕯️
Enter trade with a tight stop loss below support (for buys) or above resistance (for sells). 🎯
2️⃣ Divergence + Trendline Break Strategy
Draw a trendline following the current trend. 📐
Spot divergence as the trend loses strength. 🚨
Wait for a trendline breakout for extra confirmation. 💥
Enter trade on the break and retest of the trendline. 💯
3️⃣ Divergence + Moving Average Strategy
Spot divergence between price and indicator. 📉
Use a moving average (MA) like the 50 EMA or 200 EMA to confirm the trend shift. 📈
Buy when price crosses above the MA after bullish divergence. 💚
Sell when price crosses below the MA after bearish divergence. ❤️
⚠️ Common Mistakes to Avoid
🚫 Ignoring confirmation: Always wait for candle closes or breakouts.
🚫 Forcing divergence: Only trade when divergence is clear.
🚫 Skipping risk management: Use a stop loss and position sizing.
🚫 Overtrading small timeframes: Higher timeframes (4H, Daily) offer more reliable signals.

Understanding ICT’s Framework for Price Delivery | Smart Money 📊 In this video, we break down ICT’s framework for price delivery, explaining how smart money moves price efficiently through liquidity pools and imbalance zones. We cover:
✅ Market structure & liquidity
✅ How price seeks inefficiencies (FVGs & Imbalances)
✅ The role of algorithmic price delivery
✅ How to anticipate price movement using ICT concepts
🔔 Subscribe for more ICT-based analysis!
#ICTTrading #SmartMoneyConcepts #ForexTrading #PriceDelivery
#ICT #Forex #SmartMoneyConcepts #PriceAction #MarketStructure #OrderFlow #Liquidity #TraderMindset #5minwithfriday

"Gann’s Secrets: Time Cycles, Square of 9 & Market Reversals"Gann’s Trading Secrets | Gann Time Cycles, Gann Square of 9, and Predicting Market Reversals
📌 Topics Covered in This Video:
- The Power of Gann 90 in Market Cycles
- Gann Time Cycles & Gann Market Timing
- Gann Fibonacci levels & Gann Price Levels
- Gann Fan & The Billion-Dollar Trade
- Gann Square of 9 & Price Movements
- The 90-Year Gann Market Cycle & Financial Crises
- How to Use Gann’s Methods in Modern Trading
📌 Why You Should Watch This Video:
- Learn how to forecast market tops and bottoms using W.D. Gann’s techniques.
- Understand how Gann time cycles and Gann price action align in market movements.
- See real-world examples of how Gann’s methods predicted historical market crashes and reversals.
- Discover how major traders, including George Soros, unknowingly used Gann's principles to execute billion-dollar trades.
📌 Timestamps: Gann’s Trading Secrets | Gann Time Cycles, Square of 9, and Predicting Market Reversals
00:00 ▶️ Introduction
00:43 ▶️ W.D.Gann
01:35 ▶️ His Contribution to Technical Analysis
02:19 ▶️ Core Principals
04:13 ▶️ Price and Market Cycles
04:52 ▶️ What is Swing Chart?
06:32 ▶️ Gann Square of 9
07:12 ▶️ Gann's Relentless Study of Markets
07:37 ▶️ The Role of Astrology in Market Cycle
08:13 ▶️ Key Natural Market Turning Points
09:12 ▶️ Gann's 50% Rule
09:58 ▶️ The Three Key factors in Gann Trading
10:13 ▶️ The Price
14:07 ▶️ Gann Fan
14:43 ▶️ The Core Concept of Time-Price Balance
19:02 ▶️ The Role of Geometry in Gann's Work
19:41 ▶️ The Power of the Number 3
24:37 ▶️ The 90-Time Cycle in the Market
27:40 ▶️ Famous Trader George Soros
29:52 ▶️ Historical Economic Depression
30:35 ▶️ 2019 as a Key Time Cycle
31:10 ▶️ Economic Conditions

Harmonic Pattern Trading: Ultimate Guide for 2025Harmonic trading is a powerful price action-based strategy that uses Fibonacci ratios to identify high-probability reversal zones. These patterns fall under XABCD structure, meaning they have five key points (X, A, B, C, and D) and rely on Fibonacci retracements and extensions.
By mastering harmonic trading, you can identify trend reversals early and achieve higher win rates compared to traditional technical analysis methods.
🔹 Key Principles of Harmonic Trading
1️⃣ Structure of Harmonic Patterns (XABCD)
All harmonic patterns follow the same five-point structure:
X → A: The initial move.
A → B: The first retracement.
B → C: A counter move.
C → D: The final leg, forming the Potential Reversal Zone (PRZ).
2️⃣ Fibonacci Ratios in Harmonic Patterns
Harmonic trading is Fibonacci-driven, meaning each pattern is defined by specific retracement and extension levels:
Common Fibonacci Retracements: 38.2%, 50%, 61.8%, 78.6%, 88.6%
Common Fibonacci Extensions: 127.2%, 141.4%, 161.8%, 200%, 224%, 261.8%
3️⃣ Potential Reversal Zone (PRZ)
The D-point of the pattern is where price is expected to reverse.
This PRZ zone is validated by Fibonacci confluence, support/resistance, and other confirmation signals (RSI, MACD, divergence, etc.).
Entry: Around D-point reversal confirmation
Stop Loss: Beyond the PRZ invalidation zone
Take Profit: Based on Fibonacci extension levels (often 61.8%, 100%, or 161.8% retracements).
🔷 Primary Harmonic Patterns & Their Structure
1️⃣ Gartley Pattern 🦋
✅ Most popular & reliable harmonic pattern
✅ Predicts trend continuation or reversal
✅ Respects 61.8% Fibonacci retracement from XA
Gartley Pattern Structure:
AB = 61.8% retracement of XA
BC = 38.2% or 88.6% retracement of AB
CD = 78.6% retracement of XA
D-point PRZ → Strong reversal expected
🚀 Trading Tip: Look for confluence with trendlines, supply-demand zones, and RSI/MACD divergence.
2️⃣ Bat Pattern 🦇
✅ High-probability reversal setup
✅ Stronger deep retracement of XA compared to Gartley
✅ Ideal for trend continuation & reversal trades
Bat Pattern Structure:
AB = 38.2% or 50% retracement of XA
BC = 38.2% or 88.6% retracement of AB
CD = 88.6% retracement of XA
D-point PRZ → Expect strong reversal
🚀 Trading Tip: Bat patterns often provide low-risk entries with tight stop losses due to their deep XA retracement.
3️⃣ Butterfly Pattern 🦋
✅ Predicts deep trend reversals
✅ Used for aggressive counter-trend trades
Butterfly Pattern Structure:
AB = 78.6% retracement of XA
BC = 38.2% or 88.6% retracement of AB
CD = 127.2% or 161.8% extension of XA
D-point PRZ → Strong trend reversal expected
🚀 Trading Tip: Butterfly PRZ zones are more extended, so look for price exhaustion & divergence before entering.
4️⃣ Crab Pattern 🦀
✅ The most extended harmonic pattern
✅ Strong 161.8% XA extension creates powerful reversals
Crab Pattern Structure:
AB = 38.2% or 61.8% retracement of XA
BC = 38.2% or 88.6% retracement of AB
CD = 161.8% extension of XA
D-point PRZ → Extreme overextension, likely strong reversal
🚀 Trading Tip: Use confluence with key support/resistance levels & volume analysis to confirm reversals.
5️⃣ Deep Crab Pattern 🦀
✅ More reliable version of the Crab Pattern
✅ D-point extends further for deeper pullbacks
Deep Crab Pattern Structure:
AB = 38.2% or 61.8% retracement of XA
BC = 38.2% or 88.6% retracement of AB
CD = 224% - 261.8% extension of XA
D-point PRZ → Strong reversal expected
🚀 Trading Tip: Similar to the Crab, but requires stronger confirmation signals before entry.
6️⃣ Cypher Pattern 💠
✅ High accuracy harmonic pattern
✅ Faster entries compared to other patterns
Cypher Pattern Structure:
AB = 38.2% to 61.8% retracement of XA
BC = 127.2% to 141.4% extension of AB
CD = 78.6% retracement of XA
D-point PRZ → Price reversal likely
🚀 Trading Tip: Look for RSI/MACD divergence at the D-point for added confirmation.
7️⃣ Shark Pattern 🦈
✅ Newer harmonic pattern variation
✅ Similar to Crab but uses different Fibonacci rules
Shark Pattern Structure:
AB = 113% - 161.8% extension of XA
BC = 113% - 161.8% extension of AB
CD = 88.6% retracement of XA
D-point PRZ → Strong reversal expected
🚀 Trading Tip: Shark patterns often appear before larger trend reversals, so they work well for early trend detection.
🔷 Advanced Harmonic Patterns Overview
📌 3-Drives Pattern
Predicts the end of trends using 3 equal price movements
Each drive follows Fibonacci retracements/extensions
Strong reversal happens after the 3rd drive completes
📌 Alternate Bat Pattern
Similar to Bat but has a deeper B-point retracement (50% of XA instead of 38.2%)
More accurate for identifying trend continuation trades
📌 White Swan & Black Swan
Developed by harmonic trading expert Scott Carney
Similar to the Crab, but focuses on psychological market structure
🚀 How to Trade Harmonic Patterns Successfully
Step 1: Identify the Pattern & PRZ
Use harmonic pattern scanners or manual Fibonacci tools.
Step 2: Wait for Reversal Confirmation
Look for candlestick patterns (pin bars, engulfing candles).
Check RSI, MACD, and volume divergence.
Step 3: Place Your Trade
Entry: Once price reacts at PRZ.
Stop Loss: Beyond PRZ invalidation level.
Take Profit: Fibonacci retracement levels (38.2%, 61.8%, 100%, 161.8%).
🔥 Summary – Why Harmonic Trading Works
✅ High accuracy when Fibonacci ratios are respected
✅ Works across all timeframes (forex, stocks, crypto, indices)
✅ Combines price action, Fibonacci, and confluence factors
If you master these harmonic patterns, you'll consistently spot reversals early, maximize profits, and minimize risks! 🚀📈

Tips & Tricks by CandleStyxI was observing Dogecoin on the 1 HR and came up with all these observations and maybe you can learn some new ways to look at things if you can understand my scribbles.
Some clues I noticed:
1. possible cup n handle formation
2. The arrows are all copy pasta same lengths and time
3. Apart of the big breakout arrow which measures the size of the cup from top to bottom.
4. Look at the date ranges numbers
5. See the Fibonacc Golden Pocket has ideal level for a Handle
6. It would also retest the breakout from the ascending green triangle
7. Target of the Cup and Handle pattern is right into the resistance & liquidity and would be the first deep test of its strength
8. Interesting that the breakout is programmed to be exactly nearby the weekly and 2 week candle close
9. Keeping in Mind the Biweekly Bitcoin crossing macd to downside could it be a failing outbreak?
10. Also they say that if the handle comes deeper than 12% it will most likely fail.
11. Conclusion is to observe if we go lower than 12% as that could be a clue if the outbreak could be a trap or not.
12. Grab this Chartlayout and make it yours!
Tell me in the comments what YOU think will happen and explain why.
More updates might follow.
