Macroeconomics and Investor Psychology Driving Gold PricesFirstly, macroeconomic policies , particularly monetary policy moves by the U.S ., will continue to have a significant impact on gold prices. Specifically, the upcoming decisions by the Federal Reserve (Fed) regarding interest rate cuts are expected to create positive momentum for gold, as investors turn to gold as a safe-haven asset in a low-interest-rate environment.
Secondly, the independence of the Fed is a key factor, not only directly influencing confidence in the USD but also strongly affecting trust in U.S. institutions. The stability and transparency of the Fed's policy decisions will continue to create significant market volatility, directly impacting gold prices.
In addition, gold is becoming increasingly attractive to investors due to the combination of two key factors. First, the increasing national debt in many countries is becoming a major risk, as global fiscal sustainability is in question, making gold a more reliable safe-haven asset. Second, the erosion and weakening of international systems and standards have led to diminishing confidence in financial systems and international approaches. This has further strengthened gold's position as a safe asset in the eyes of investors.
Another important factor influencing gold prices is the psychology of seeking global risk hedging . In the context of concerns about "bubbles" in the AI technology sector , if AI technology proves to be a bubble and bursts, gold and other assets will become even more attractive as strategic safe-haven assets.
With all these factors in play, gold is not only an attractive investment choice but also a strategic asset during times of financial and global economic instability.
Harmonic Patterns

AI in Trading: Hype, Hope, and Hard Truths# TradingView Post: AI in Trading (TradingView Formatting)
"I just made a ChatGPT trading bot that's up 300% in backtests!"
I see this exact post at least 5 times a week. And every time, I know exactly how it ends—blown account, confused trader, and another person convinced that "AI doesn't work in trading."
Here's the uncomfortable truth: AI absolutely works in trading. Just not the way most people think.
The problem isn't the technology—it's that everyone's obsessed with the sexiest part (predicting the next candle) while ignoring the parts that actually make money.
After building dozens of systematic strategies for clients across crypto, forex, and equities, I've learned this: the hard part of trading isn't generating signals. It's managing risk, optimizing execution, and knowing when your edge has disappeared.
Let me show you where AI actually creates alpha—and why your "predictive model" probably won't.
━━━━━━━━━━━━━━━━━━━━━━
The Real Problem With AI Signal Generation
Before we get to what works, let's talk about why most AI trading bots fail:
The Data Problem:
Markets are non-stationary (the game changes constantly)
You need 10,000+ samples for reliable ML models
But market regimes shift every 200-500 bars
You're essentially training on data from a different game
The Overfitting Trap:
Your LSTM "learned" patterns that existed once and may never repeat
95% backtest accuracy? That's usually a red flag, not a green light
Walk-forward testing reveals most models have zero predictive power out-of-sample
The Competition Reality:
Renaissance Technologies has PhDs, decades of data, and billions in infrastructure
Your GPU and 2 years of OHLCV data isn't competing with that
By the time a pattern is obvious enough for simple ML to find, it's arbitraged away
Can pure signal generation work? Yes—but it's the hardest application of AI in trading, not the easiest.
━━━━━━━━━━━━━━━━━━━━━━
Where AI Actually Adds Value (The Unsexy Truth)
Here's what nobody tells you: institutional quant funds use AI heavily, just not for predicting price direction. They use it for the operational advantages that compound over thousands of trades.
1. Position Sizing & Risk Management
Traditional fixed-percentage position sizing (risk 2% per trade) ignores market reality. Sometimes 2% is too aggressive, sometimes it's leaving money on the table.
I've tested reinforcement learning models that dynamically adjust position sizes based on:
Current market volatility regime (VIX, ATR percentiles)
Correlation breakdown between portfolio assets
Recent strategy performance and drawdown depth
Portfolio heat distribution across sectors
Real result from a client system: 23% reduction in maximum drawdown vs. fixed sizing, with nearly identical total returns. The AI wasn't predicting price—it was predicting when the edge was strongest and sizing accordingly.
2. Execution Optimization
This is where prop shops and hedge funds actually deploy ML. Not for signals—for getting better fills.
What ML handles:
Predicting optimal order slicing (VWAP vs. TWAP vs. aggressive IOC)
Detecting liquidity windows in crypto markets (when to place limit orders vs. market orders)
Minimizing slippage on larger positions
Predicting short-term volatility spikes that would hurt execution
Practical example: A simple gradient boosting model analyzing order book depth, bid-ask spread, and recent volume patterns can save 5-15 basis points per trade. On a $100K position, that's $50-150 saved per execution. Over 1,000 trades per year? That's $50K-150K in improved performance.
3. Regime Detection & Strategy Allocation
Stop trying to predict the next candle. Instead, predict the type of market environment you're in.
Use unsupervised learning (K-means clustering, Hidden Markov Models, Gaussian Mixture Models) to identify:
High volatility vs. low volatility regimes
Trending vs. mean-reverting environments
Risk-on vs. risk-off sentiment periods
Correlation expansion/contraction across assets
Why this matters: A moving average crossover that prints money in trending markets will destroy your account in choppy, range-bound conditions. A mean reversion strategy that works beautifully in low volatility will get steamrolled during breakouts.
Implementation: Train an ensemble model on market features (volatility, correlation, volume patterns, momentum indicators). When it detects Regime A, allocate to Strategy Set 1. When it detects Regime B, switch to Strategy Set 2. When confidence is low, reduce exposure across the board.
4. Feature Engineering & Dynamic Signal Weighting
You have 50 technical indicators on your chart. Which ones actually matter right now ?
This changes constantly:
RSI works until the market trends hard, then it's a disaster
Volume patterns matter way more in crypto than traditional equities
Correlation indicators are useless until suddenly they're everything (crisis periods)
Different lookback periods perform differently across volatility regimes
ML solution: Use ensemble methods (Random Forests, XGBoost) to dynamically weight and combine signals based on recent regime and performance.
Instead of: "Buy when RSI < 30"
You get: "Buy when the ensemble model says momentum + volume + volatility features align, weighted by recent regime performance"
Client example: Combined 12 traditional strategies (each with proven edge) with an ML meta-strategy that allocated capital between them. The ML didn't find new edges—it figured out which existing edges to use when. Result: Sharpe ratio improved from 1.1 to 1.7 over 3 years live.
━━━━━━━━━━━━━━━━━━━━━━
The Hybrid Approach That Actually Works
After building systems that survive real markets (not just backtests), here's the architecture that works:
Layer 1 - Core Signals (Traditional Quant):
Mean reversion strategies based on statistical patterns
Momentum breakout systems with volume confirmation
Arbitrage opportunities and structural edges
These are your "alpha generators" with proven statistical edge
Layer 2 - AI Risk Management:
Reinforcement learning for dynamic position sizing
ML models for stop-loss placement and profit-taking
Volatility prediction for exposure adjustment
Layer 3 - AI Strategy Allocation:
Regime detection to switch between strategy sets
Performance-based weighting of different approaches
Correlation analysis for portfolio construction
Layer 4 - AI Execution:
Order optimization based on current liquidity
Slippage prediction and mitigation
Timing of trade execution within the day
Real system I deployed for a crypto client:
Core: 8 different mean reversion + momentum strategies (all traditionally backtested)
AI Layer: Reinforcement learning for position sizing based on volatility regime
ML Layer: Random forest classifier for regime detection (trending vs. ranging vs. high volatility)
Execution: Gradient boosting model for order placement timing
Result: Sharpe ratio improved from 1.2 to 1.8 over 3 years of live trading, max drawdown reduced by 31%
The AI didn't find magic price prediction patterns. It made better decisions about when to trade , how much to risk , and how to execute .
━━━━━━━━━━━━━━━━━━━━━━
What You Should Actually Build
If you're serious about AI in trading, here's my recommendation:
Start here (High ROI, Lower Difficulty):
Build a regime detection system first
Create position sizing rules that adapt to volatility
Optimize your execution (especially in crypto)
Test strategy allocation across different market conditions
Only then consider (High Difficulty, Questionable ROI):
Pure price prediction models
Red flags to avoid:
Any model with >90% backtest accuracy (probably overfit)
Systems that don't account for transaction costs and slippage
Strategies that haven't been walk-forward tested
Anything that can't explain why it should work
━━━━━━━━━━━━━━━━━━━━━━
The Bottom Line
If someone's selling you an AI system that "predicts market direction with 95% accuracy," run away. That's either overfitted garbage or a scam.
If someone's using AI to dynamically manage risk, optimize execution, detect regime changes, and intelligently allocate between proven strategies? That's actually how professionals use it.
The unsexy truth: The best use of AI in trading isn't prediction—it's decision-making around the edges that already exist.
Stop chasing the signal generation hype. Start thinking about the full trading pipeline. That's where the real alpha is hiding.
━━━━━━━━━━━━━━━━━━━━━━
💬 Question for the community: Are you using AI for signal generation or operational optimization? What's been your experience?
🔔 Follow for more quant reality checks—no hype, just data and systems that work in production
📩 Building systematic strategies that need to survive real markets? I specialize in risk-aware ML systems, hybrid quant approaches, and turning backtests into production-ready code. DM me to discuss your project.
━━━━━━━━━━━━━━━━━━━━━━

Types of Trading in the World Market1. Equity Trading (Stock Market Trading)
Overview
Equity trading refers to buying and selling shares of publicly listed companies. It’s one of the oldest and most popular forms of trading, conducted through stock exchanges like the New York Stock Exchange (NYSE), NASDAQ, London Stock Exchange (LSE), Tokyo Stock Exchange (TSE), and National Stock Exchange (NSE) in India.
Types of Equity Trading
Intraday Trading:
Traders buy and sell shares within the same trading day, aiming to profit from short-term price movements. Positions are squared off before market close.
Swing Trading:
Traders hold stocks for a few days or weeks, capitalizing on short- to medium-term price swings based on technical indicators and market structure.
Positional Trading:
This involves holding positions for several months based on long-term trends, earnings growth, or macroeconomic shifts.
Algorithmic & Quantitative Trading:
Computer-driven strategies execute trades based on mathematical models, speed, and efficiency, minimizing human error.
Why It Matters
Equity trading reflects the health of corporate and economic growth. It helps companies raise capital, offers liquidity to investors, and provides traders with opportunities for profit through price fluctuations.
2. Derivatives Trading
Overview
Derivatives are financial contracts whose value is derived from an underlying asset, such as stocks, commodities, interest rates, currencies, or indices. Common derivative instruments include futures, options, swaps, and forwards.
Main Types of Derivative Trading
Futures Trading:
Futures are standardized contracts to buy or sell an asset at a predetermined price on a future date. They are widely used for speculation and hedging — e.g., crude oil futures or Nifty futures.
Options Trading:
Options give traders the right but not the obligation to buy (call) or sell (put) an asset. This flexibility attracts both hedgers and speculators who seek leveraged exposure with limited risk.
Swaps and Forwards:
Forwards are over-the-counter (OTC) contracts with customizable terms.
Swaps involve exchanging cash flows, such as interest rate swaps or currency swaps.
Why It Matters
Derivatives are vital for risk management and price discovery. For instance, airlines hedge against rising fuel costs using crude oil futures, while exporters hedge currency risks via forex options.
3. Commodity Trading
Overview
Commodities are tangible goods like gold, silver, crude oil, natural gas, wheat, or coffee. Commodity trading dates back centuries and today takes place on organized exchanges like the Chicago Mercantile Exchange (CME), London Metal Exchange (LME), and Multi Commodity Exchange (MCX) in India.
Types of Commodity Trading
Hard Commodities:
These include natural resources extracted from the earth — metals (gold, silver, copper) and energy (crude oil, gas, coal).
Soft Commodities:
Agricultural products such as wheat, coffee, sugar, cotton, and soybeans fall under this category.
Spot vs. Futures Market
In the spot market, commodities are traded for immediate delivery.
In the futures market, contracts are traded for future delivery at a pre-agreed price.
Why It Matters
Commodity markets serve as a barometer for global economic health. Prices of oil, gold, and agricultural goods affect inflation, currency values, and even geopolitical stability.
4. Foreign Exchange (Forex) Trading
Overview
The foreign exchange market (Forex or FX) is the world’s largest and most liquid financial market, with daily trading volumes exceeding $7 trillion. It involves trading currency pairs such as EUR/USD, USD/JPY, GBP/INR, and USD/INR.
Types of Forex Trading
Spot Forex:
Currencies are exchanged instantly at the current market rate.
Forward Forex:
Agreements to buy/sell a currency at a future date at a fixed rate.
Currency Futures and Options:
Exchange-traded derivatives based on currency pairs.
Carry Trade:
Traders borrow in low-interest-rate currencies (e.g., JPY) and invest in higher-yielding currencies (e.g., AUD), profiting from the interest rate differential.
Why It Matters
Forex trading impacts global trade, tourism, and investment flows. Central banks, corporations, and investors use it to hedge currency exposure and speculate on macroeconomic trends.
5. Fixed Income (Bond) Trading
Overview
Bond trading involves buying and selling debt securities issued by governments, corporations, or financial institutions. Bonds provide fixed interest income and are considered relatively stable compared to equities.
Types of Bonds Traded
Government Bonds (Sovereign Debt): Issued by national governments (e.g., U.S. Treasuries, Indian G-Secs).
Corporate Bonds: Issued by companies to raise capital.
Municipal Bonds: Issued by local bodies for infrastructure projects.
Bond Market Trading Styles
Primary Market: New bonds are issued and sold directly to investors.
Secondary Market: Existing bonds are traded among investors.
Why It Matters
Bond trading plays a crucial role in interest rate transmission, fiscal policy management, and capital market stability. Institutional investors often rely on bonds for predictable income and risk diversification.
6. Cryptocurrency Trading
Overview
A modern addition to global markets, cryptocurrency trading involves digital assets like Bitcoin (BTC), Ethereum (ETH), and Solana (SOL). These assets trade on decentralized exchanges (DEXs) and centralized platforms (like Binance, Coinbase, or WazirX).
Forms of Crypto Trading
Spot Trading:
Direct buying/selling of cryptocurrencies for immediate settlement.
Margin Trading:
Borrowed funds are used to trade larger positions, amplifying potential gains (and losses).
Futures & Options on Crypto:
Derivative products for hedging or speculation based on future prices of digital assets.
DeFi & Staking:
Traders earn yields by locking assets in decentralized finance protocols.
Why It Matters
Crypto trading represents a new frontier of global finance — decentralized, transparent, and accessible 24/7. Despite volatility, it’s reshaping how traders and institutions view digital value and monetary systems.
7. Exchange-Traded Fund (ETF) Trading
Overview
ETFs are investment funds that track indices, commodities, or sectors and are traded like stocks. Examples include S&P 500 ETFs, Gold ETFs, and sectoral ETFs (like technology or healthcare).
Types of ETF Trading
Index ETFs: Track market indices such as NASDAQ-100 or Nifty 50.
Commodity ETFs: Represent commodities like gold or oil.
Bond ETFs: Mirror fixed income portfolios.
Thematic/Leveraged ETFs: Focus on emerging themes like AI, clean energy, or innovation.
Why It Matters
ETFs combine diversification and liquidity, enabling traders to gain exposure to broad markets or specific themes with minimal effort and cost.
8. Index Trading
Overview
Instead of trading individual stocks, traders can trade indices that represent a group of stocks, such as S&P 500, Dow Jones, FTSE 100, Nikkei 225, or Nifty 50.
Forms of Index Trading
Index Futures: Contracts based on the future value of an index.
Index Options: Options to speculate or hedge based on index movements.
CFDs (Contracts for Difference): Instruments to speculate on index price changes without owning underlying stocks.
Why It Matters
Index trading reflects the broader market trend and is a key tool for institutional investors managing portfolios or hedging systemic risk.
9. Real Estate Investment Trust (REIT) Trading
Overview
REITs are companies that own and operate income-generating real estate — such as office buildings, malls, or warehouses. They are listed and traded like stocks.
Types of REITs
Equity REITs: Own properties and generate rental income.
Mortgage REITs: Invest in real estate debt and earn interest income.
Hybrid REITs: Combine both models.
Why It Matters
REIT trading provides investors access to the real estate market with liquidity and lower capital requirements compared to buying property directly.
10. Environmental and Carbon Credit Trading
Overview
A relatively new type of market, carbon trading involves the buying and selling of carbon credits, which represent the right to emit a certain amount of carbon dioxide.
How It Works
Companies with excess carbon allowances sell them to those exceeding emission limits. Platforms like the EU Emissions Trading System (EU ETS) facilitate this trade.
Why It Matters
Carbon trading incentivizes sustainability and helps nations meet global climate goals, linking environmental policy with financial markets.
11. Proprietary and Institutional Trading
Overview
Beyond retail participation, large financial institutions and hedge funds engage in proprietary trading (prop trading) — using their own capital to generate profits — and institutional trading, which involves massive volumes handled by fund managers.
Key Strategies
Arbitrage: Exploiting price differences across markets.
High-Frequency Trading (HFT): Leveraging algorithms for microsecond trade execution.
Market Making: Providing liquidity by quoting buy/sell prices.
Why It Matters
Institutional trading ensures liquidity and efficiency, while prop trading adds depth and innovation to global markets.
12. Over-the-Counter (OTC) Trading
Overview
OTC trading occurs directly between two parties, outside of formal exchanges. It’s common in currencies, bonds, derivatives, and unlisted equities.
Why It Matters
OTC markets offer flexibility and customization but carry higher counterparty risk due to the lack of centralized regulation.
Conclusion: The Interconnected Trading Ecosystem
The global trading landscape is a dynamic network where every segment — from equities to crypto — contributes to market efficiency and liquidity.
Equity and ETF trading attract retail and institutional investors.
Derivatives and Forex markets manage global risks and currency exposures.
Commodity and carbon trading influence inflation and sustainability.
Crypto and DeFi trading symbolize the digital transformation of finance.
Ultimately, the types of trading in the world market form an integrated system that channels capital, manages risk, and reflects economic sentiment worldwide.
The future of trading lies in data-driven strategies, AI automation, cross-border integration, and sustainable finance, all of which will redefine how participants interact in this ever-evolving global marketplace.
Instruments for Global Trading1. Overview of Global Trading Instruments
Global trading instruments are financial assets that can be traded across international markets. They represent ownership, debt obligations, or rights to future cash flows. Their purpose is to provide liquidity, facilitate capital allocation, and enable risk management. From traditional stocks to complex derivatives and cryptocurrencies, these instruments reflect the diversity and innovation in global finance.
International investors utilize these instruments to gain exposure to various regions, sectors, and asset classes, often balancing returns against risk. For instance, a U.S. investor may hold Japanese equities, European bonds, and oil futures simultaneously to diversify globally.
2. Equities (Stocks)
Equities are one of the most popular global trading instruments. They represent ownership in a company, giving shareholders rights to profits through dividends and capital appreciation.
Types of Equities:
Common Shares: Provide voting rights and dividends.
Preferred Shares: Offer fixed dividends but usually no voting rights.
Depository Receipts: Instruments like ADRs (American Depository Receipts) and GDRs (Global Depository Receipts) allow investors to trade shares of foreign companies on domestic exchanges.
Global Equity Markets:
Leading equity markets include the New York Stock Exchange (NYSE), NASDAQ, London Stock Exchange (LSE), Tokyo Stock Exchange (TSE), and Euronext. Emerging markets such as India’s NSE and BSE, China’s Shanghai Stock Exchange, and Brazil’s B3 also play major roles.
Importance:
Equities enable companies to raise capital globally while offering investors growth potential. Through ETFs and index funds, investors can access diversified global equity portfolios.
3. Fixed Income Securities (Bonds)
Bonds are debt instruments that allow entities—governments, corporations, or institutions—to raise funds by borrowing from investors. Bondholders receive periodic interest payments (coupons) and principal repayment at maturity.
Types of Bonds:
Government Bonds: Issued by national governments (e.g., U.S. Treasuries, UK Gilts, Indian Government Securities).
Corporate Bonds: Issued by companies to finance operations or expansions.
Municipal Bonds: Issued by local governments.
Sovereign and Eurobonds: Traded internationally, often denominated in a foreign currency.
Global Bond Markets:
The bond market is much larger than the stock market in total value. Major trading hubs include the U.S. Treasury market, European government bond markets, and Asian bond markets such as Japan’s JGBs.
Role in Global Finance:
Bonds provide stability and predictable returns, making them essential for conservative investors and institutional portfolios. Global bond ETFs also allow diversification across regions and credit qualities.
4. Derivatives
Derivatives are financial instruments whose value is derived from underlying assets such as stocks, bonds, currencies, interest rates, or commodities. They are used for hedging, speculation, and arbitrage in global markets.
Types of Derivatives:
Futures: Standardized contracts to buy or sell assets at a future date and price.
Options: Provide the right, but not the obligation, to buy (call) or sell (put) an asset.
Swaps: Agreements to exchange cash flows, such as interest rate swaps or currency swaps.
Forwards: Customized contracts similar to futures but traded over-the-counter (OTC).
Global Derivatives Exchanges:
Major exchanges include the Chicago Mercantile Exchange (CME), Intercontinental Exchange (ICE), Eurex, and Singapore Exchange (SGX).
Significance:
Derivatives enhance liquidity and help manage risk. For instance, a European importer can hedge against currency fluctuations through forex futures. Similarly, investors hedge equity portfolios using index options or volatility derivatives.
5. Foreign Exchange (Forex)
The foreign exchange market is the largest and most liquid financial market in the world, with a daily trading volume exceeding $7 trillion. It involves the exchange of one currency for another, allowing international trade and investment to function smoothly.
Major Currency Pairs:
Major pairs: EUR/USD, USD/JPY, GBP/USD, USD/CHF
Minor pairs: EUR/GBP, AUD/NZD, etc.
Exotic pairs: USD/INR, USD/TRY, etc.
Participants:
Central banks, commercial banks, hedge funds, corporations, and retail traders participate in forex trading.
Instruments in Forex Trading:
Spot Transactions: Immediate exchange of currencies.
Forward Contracts: Agreements to exchange currencies at a future date.
Currency Swaps and Options: For managing exposure and speculation.
Importance:
Forex trading facilitates global commerce, cross-border investments, and monetary policy execution. It also allows investors to profit from exchange rate fluctuations.
6. Commodities
Commodities are tangible goods such as metals, energy resources, and agricultural products traded globally. Commodity markets are crucial for price discovery and risk management.
Types of Commodities:
Energy: Crude oil, natural gas, coal.
Metals: Gold, silver, copper, aluminum.
Agricultural: Wheat, coffee, sugar, soybeans.
Commodity Exchanges:
Global trading platforms include Chicago Board of Trade (CBOT), New York Mercantile Exchange (NYMEX), London Metal Exchange (LME), and Multi Commodity Exchange (MCX) in India.
Investment Methods:
Investors can trade commodities through futures contracts, ETFs, or commodity-focused mutual funds. For example, gold ETFs allow exposure without physical ownership.
Global Impact:
Commodity prices influence inflation, trade balances, and economic policies. For instance, oil price fluctuations affect energy-importing nations differently from exporters.
7. Exchange-Traded Funds (ETFs) and Mutual Funds
ETFs and mutual funds pool investor money to invest in diversified portfolios of stocks, bonds, or commodities.
ETFs: Traded on exchanges like stocks, ETFs offer liquidity and real-time pricing.
Mutual Funds: Professionally managed funds priced once daily based on net asset value (NAV).
Global ETFs track indices such as the MSCI World Index or S&P 500, giving investors exposure to multiple countries and sectors with low costs. They are among the most accessible tools for global diversification.
8. Cryptocurrencies and Digital Assets
In recent years, cryptocurrencies have emerged as a new class of global trading instruments. Digital assets like Bitcoin, Ethereum, and stablecoins operate on decentralized blockchain networks and trade 24/7 across international platforms.
Advantages: Transparency, borderless transactions, and diversification.
Risks: High volatility, regulatory uncertainty, and cybersecurity concerns.
Global Platforms: Binance, Coinbase, and Kraken facilitate crypto trading.
Institutional interest is growing, with the development of Bitcoin ETFs and central bank digital currencies (CBDCs).
9. Hybrid and Alternative Instruments
The global market also includes hybrid instruments that combine features of equity and debt, such as convertible bonds and preference shares. Additionally, real estate investment trusts (REITs) and private equity funds provide access to alternative assets beyond traditional markets.
These instruments allow investors to tailor portfolios for income, growth, or inflation protection.
10. Conclusion
Global trading instruments form the backbone of the international financial ecosystem. From stocks and bonds to currencies and commodities, they enable investors to diversify, manage risk, and seek profit across borders. The ongoing integration of financial markets, technological advancement, and innovation in products—such as ETFs and digital assets—continue to expand the range and accessibility of these instruments.
For global investors, understanding how each instrument functions, interacts, and responds to economic trends is essential. The right mix of instruments, aligned with market conditions and individual risk tolerance, helps build a balanced and resilient global portfolio—one that can thrive in the ever-evolving world of international finance.
Global IPO Trends: Understanding the IPO Landscape1. Introduction
An IPO is the process through which a private company offers its shares to the public for the first time. This helps the company raise capital to fund expansion, repay debt, or improve brand visibility. Investors, in return, get an opportunity to own a piece of a growing company and benefit from its future success.
The global IPO market is cyclical—it often flourishes during periods of strong economic growth, low-interest rates, and bullish investor sentiment, but slows down during times of uncertainty or market volatility. Therefore, tracking IPO activity provides insights into the broader financial climate.
2. Post-Pandemic Recovery and Market Volatility
The global IPO market witnessed significant turbulence between 2020 and 2023. After the pandemic shock of 2020, IPO activity surged in 2021 due to record-low interest rates, strong liquidity, and high investor enthusiasm for technology and digital transformation stories. According to EY’s Global IPO Trends report, 2021 was one of the strongest years for IPOs globally, with over 2,600 listings raising more than USD 600 billion.
However, this momentum cooled sharply in 2022 and 2023 as inflation spiked, central banks raised interest rates, and fears of a global recession grew. The U.S. Federal Reserve’s aggressive tightening cycle dampened investor risk appetite, leading to valuation corrections across equity markets, especially in high-growth sectors like technology and biotech. Many companies postponed or canceled planned IPOs due to uncertain market conditions.
3. Regional Trends
a. United States
The U.S. remains one of the largest IPO markets, dominated by the NASDAQ and the NYSE. 2021 saw a record wave of IPOs, including prominent listings like Rivian, Robinhood, and Coinbase. However, activity slowed significantly in 2022–2023. The SEC’s stricter scrutiny of SPACs (Special Purpose Acquisition Companies) also reduced the boom in blank-check listings.
In 2024 and 2025, U.S. IPOs began showing signs of revival, especially in AI, semiconductors, renewable energy, and healthcare sectors. Companies are now focusing more on profitability and stable growth rather than hyper-expansion, reflecting a more disciplined IPO environment.
b. Asia-Pacific
The Asia-Pacific (APAC) region continues to be a global leader in IPO volume. Mainland China, Hong Kong, India, and South Korea dominate the listings landscape.
China and Hong Kong: Despite regulatory headwinds and a slowdown in global investor demand, Chinese exchanges like Shanghai’s STAR Market and Shenzhen’s ChiNext remain active. These markets focus on high-tech and innovation-driven companies. Hong Kong, once a top global listing venue, faced challenges due to political tensions and competition from mainland exchanges.
India: India has emerged as one of the most vibrant IPO markets globally. Post-2021, the country saw successful listings from companies like Zomato, Nykaa, Paytm, and LIC. Favorable demographics, strong domestic investor participation, and economic reforms have positioned India as a long-term IPO hotspot.
Japan and South Korea: Both countries have seen steady IPO activity, particularly in tech, gaming, and renewable sectors. South Korea’s IPO of LG Energy Solution in 2022 was one of Asia’s biggest.
c. Europe and the Middle East
Europe’s IPO market has faced headwinds from geopolitical issues like the Russia-Ukraine conflict, inflation, and economic slowdown. However, niche markets like the London Stock Exchange and Euronext have seen a few strong debuts in renewable energy, fintech, and healthcare.
In contrast, the Middle East—especially Saudi Arabia and the UAE—has become a rising IPO hub. Driven by economic diversification programs under Vision 2030, companies like Aramco, Americana Restaurants, and ADNOC subsidiaries have attracted global investor interest. The region’s IPO pipeline remains strong, supported by high oil revenues and capital market reforms.
4. Sectoral Shifts
Technology and AI
Tech companies continue to dominate global IPOs, but investor priorities have shifted. In 2021, many loss-making tech startups were able to raise massive valuations. Now, investors prefer firms with solid earnings, scalable business models, and clear paths to profitability. Artificial Intelligence, cloud computing, cybersecurity, and semiconductor firms are among the most attractive sectors for IPOs in 2024–2025.
Renewable Energy and ESG
The global push toward sustainability has made clean energy and ESG-focused firms popular IPO candidates. Solar, electric vehicle, and green hydrogen companies are attracting capital across Europe, India, and North America. Investors increasingly evaluate companies based on environmental, social, and governance performance.
Healthcare and Biotechnology
Post-pandemic, healthcare IPOs remain in focus. Pharmaceutical innovation, telemedicine, and biotechnology continue to draw attention, though valuations have moderated after the 2021 highs.
Consumer and Financial Services
With global consumption patterns recovering, retail, fintech, and e-commerce IPOs are resurging. Digital payment firms and neobanks, especially from India, Southeast Asia, and Latin America, are tapping public markets.
5. The Rise of Alternative Listing Routes
The traditional IPO process is being complemented—and in some cases, challenged—by alternative routes:
SPACs (Special Purpose Acquisition Companies): SPACs boomed in 2020–2021 but declined after regulatory tightening in the U.S. and weak post-merger performance. However, they continue to play a role in Asia and the Middle East.
Direct Listings: Some large firms, particularly in the tech sector, prefer direct listings to avoid underpricing and large underwriting fees.
Dual Listings: Many companies now seek listings in multiple exchanges (e.g., New York and Hong Kong) to diversify investor bases and improve liquidity.
6. Investor Sentiment and Valuation Trends
Valuations have become more conservative in recent IPOs as investors demand profitability and transparency. The days of excessive hype and overvaluation—typical during the 2021 bull market—have waned. Institutional investors now focus on fundamentals, free cash flow, and governance.
Retail investor participation, however, remains robust in markets like India and Southeast Asia, supported by digital trading platforms and mutual fund inflows.
7. Challenges in the Global IPO Market
The IPO market faces several headwinds:
Rising Interest Rates: Higher borrowing costs make growth capital more expensive and reduce investor appetite for risk assets.
Regulatory Uncertainty: Changes in listing norms and disclosure rules—especially for tech firms—add compliance burdens.
Geopolitical Risks: Conflicts, supply chain disruptions, and trade tensions impact global sentiment.
Market Volatility: Global equity markets remain sensitive to central bank actions and macroeconomic data, influencing IPO timing.
8. The Road Ahead: 2025 and Beyond
As of 2025, optimism is slowly returning to global equity markets. Economic stabilization, cooling inflation, and expectations of rate cuts are improving IPO pipelines. Companies that delayed their public listings in 2022–2023 are now reconsidering market entry.
Key themes likely to dominate upcoming IPO cycles include:
AI and Deep Tech – fueled by rapid innovation and enterprise adoption.
Sustainability and Green Energy – aligning with global decarbonization goals.
Digital Finance – fintech, digital payments, and blockchain-driven platforms.
Emerging Market Expansion – especially India, the Middle East, and Southeast Asia.
9. Conclusion
Global IPO trends mirror the pulse of the global economy. While the pandemic era saw record-breaking issuance, the following correction restored balance and discipline to public markets. The resurgence of IPO activity in 2024–2025 signals renewed investor confidence, stronger corporate fundamentals, and diversified regional growth.
In the coming years, the IPO landscape will be shaped by technological innovation, sustainability imperatives, and evolving investor behavior. Companies that demonstrate resilience, transparency, and long-term value creation are likely to lead the next wave of global IPOs.

Global Market Analysis: 1. Introduction to the Global Market
The global market is an integrated system where goods, services, capital, and labor move freely across borders. This system connects developed, emerging, and developing economies through trade, investment, and financial flows. The rise of globalization, technological advancements, and digital platforms has accelerated this integration, making economic activities more interdependent than ever before.
In today’s context, no economy operates in isolation. Events in one country—like a policy change in the U.S. Federal Reserve, geopolitical tensions in the Middle East, or a supply chain disruption in China—can ripple through global financial markets, influencing exchange rates, stock prices, and commodity values worldwide.
2. Key Components of Global Market Analysis
To understand global markets, analysts focus on several major components:
a. Economic Indicators
Economic indicators provide quantitative data to assess the health and direction of economies. Important metrics include:
GDP growth rate: Measures overall economic performance.
Inflation rate: Indicates changes in purchasing power.
Employment/unemployment rates: Reflect labor market conditions.
Trade balance: Shows exports versus imports.
Interest rates: Affect borrowing costs and capital flows.
These indicators help compare economic strengths across regions and anticipate future market movements.
b. Currency and Forex Markets
Currency markets play a vital role in global trade. Exchange rate movements influence import-export competitiveness, multinational earnings, and inflation. For instance, a stronger U.S. dollar often weakens emerging-market currencies, impacting their trade balances and foreign debt servicing.
c. Global Stock Markets
Equity markets reflect investor sentiment toward corporate profitability and economic growth. Major indices such as the S&P 500 (U.S.), FTSE 100 (U.K.), Nikkei 225 (Japan), and Nifty 50 (India) provide insights into global equity performance. Global investors diversify across markets to hedge risks and capture growth opportunities in different regions.
d. Commodity Markets
Commodities—like oil, gold, copper, and agricultural products—are essential to global trade. Commodity prices are influenced by supply-demand dynamics, geopolitical tensions, weather patterns, and currency fluctuations. For example, rising oil prices often lead to inflationary pressures worldwide, affecting consumer spending and industrial production.
e. Global Bond Markets
The bond market reflects government and corporate borrowing trends. It plays a key role in determining interest rate movements and investor confidence. U.S. Treasury yields, for example, are closely monitored as a global benchmark for risk-free returns.
3. Regional Market Insights
Global market analysis often breaks down by region to understand varying growth patterns:
a. North America
The U.S. dominates global finance, technology, and innovation. Its economic data and Federal Reserve policies have worldwide implications. Canada and Mexico, integrated through the USMCA, also play vital roles in trade and manufacturing.
b. Europe
The European Union forms one of the world’s largest single markets. However, it faces challenges like energy dependency, aging demographics, and political divisions. The European Central Bank’s policies significantly influence global liquidity and currency markets.
c. Asia-Pacific
Asia drives global growth, led by China and India. China remains a manufacturing powerhouse, while India’s expanding services and digital economy are attracting global investors. Japan, South Korea, and Southeast Asian nations contribute through technology and trade integration.
d. Middle East and Africa
This region is rich in natural resources, particularly oil and gas. The Middle East’s economic diversification efforts, like Saudi Arabia’s Vision 2030, and Africa’s emerging consumer markets are reshaping the investment landscape.
e. Latin America
Latin America presents opportunities in commodities, agriculture, and renewable energy, though political instability and inflation risks often deter investors.
4. Major Drivers of Global Market Trends
a. Globalization and Trade Liberalization
Globalization encourages free movement of goods and services, promoting efficiency and innovation. Trade agreements like RCEP, USMCA, and EU single market policies have strengthened cross-border trade links.
b. Technological Advancements
Technology has transformed global markets through automation, AI, blockchain, and fintech. E-commerce and digital payments have expanded international trade access, while data-driven decision-making enhances market analysis precision.
c. Monetary Policies
Central banks worldwide—especially the U.S. Federal Reserve, ECB, and Bank of Japan—play a crucial role in determining liquidity and interest rates. Rate hikes or cuts can trigger capital flows between developed and emerging markets.
d. Geopolitical Factors
Wars, trade disputes, and political instability disrupt global supply chains and affect investor sentiment. For example, tensions in the South China Sea or sanctions on Russia can alter energy and commodity prices globally.
e. Climate and Sustainability
Sustainability and ESG (Environmental, Social, Governance) investing are now integral to global market analysis. Investors prefer green bonds and climate-friendly projects, reshaping capital allocation.
5. Emerging Global Market Trends
a. Digital Finance and Cryptocurrencies
Blockchain technology and cryptocurrencies like Bitcoin and Ethereum are reshaping financial systems. Central banks are exploring digital currencies (CBDCs) to modernize payment infrastructure.
b. Shift in Global Supply Chains
Post-pandemic disruptions have pushed companies to diversify manufacturing bases from China to countries like India, Vietnam, and Mexico—creating new trade corridors.
c. Green Energy Transition
The global shift from fossil fuels to renewable energy is transforming investment patterns. Solar, wind, and hydrogen industries are attracting long-term capital flows.
d. Rising Role of Emerging Markets
Emerging economies are projected to drive most of the world’s GDP growth over the next decade, with growing middle classes and rapid urbanization fueling demand.
6. Tools and Methods of Global Market Analysis
Analysts use a mix of quantitative and qualitative methods, including:
Fundamental Analysis: Evaluating economic data, interest rates, and corporate earnings.
Technical Analysis: Studying price charts, trends, and volume patterns.
Sentiment Analysis: Gauging investor mood via surveys, news flow, or social media.
Comparative Studies: Cross-country analysis of fiscal and monetary policies.
Software tools such as Bloomberg Terminal, Reuters Eikon, and TradingView help analysts interpret live data and identify trading opportunities.
7. Risks and Challenges
Despite growth potential, global markets face several challenges:
Inflation and interest rate volatility reducing liquidity.
Geopolitical conflicts leading to uncertainty and trade restrictions.
Currency fluctuations affecting multinational profits.
Climate change risks impacting agriculture and infrastructure.
Technological disruptions threatening traditional industries.
Effective risk management—through diversification, hedging, and adaptive strategies—is essential for global investors.
8. Conclusion
Global market analysis is not merely about tracking numbers—it’s about understanding how economies interact in an interconnected ecosystem. From macroeconomic indicators to micro-level trade patterns, it provides insights into where opportunities lie and what risks to anticipate.
In a world shaped by technological evolution, geopolitical shifts, and environmental priorities, staying informed through thorough market analysis is crucial for policymakers, corporations, and investors alike. Those who can interpret global trends with precision and agility will remain best positioned to succeed in the dynamic landscape of the 21st-century global economy.
Risks and Opportunities in the Global Market1. Introduction: The Global Market Landscape
The global market is a dynamic system where goods, services, and capital flow freely across national borders. This system thrives on globalization — the process of increasing interdependence among nations through trade, investment, technology, and finance. Over the last few decades, international trade agreements, technological advancements, and digital transformation have made global markets more accessible.
However, with this increased connectivity comes vulnerability. A crisis in one country can ripple across continents, as seen during the 2008 financial crisis or the COVID-19 pandemic. Thus, participants in the global market must constantly balance risk management and opportunity recognition.
2. Major Risks in the Global Market
a. Economic and Financial Risks
Economic fluctuations, inflation, and interest rate volatility are among the biggest risks in the global market. For instance, a sudden rise in U.S. interest rates can trigger capital outflows from emerging markets, leading to currency depreciation and financial instability.
Global recessions or slowdowns also reduce demand for exports, affecting developing economies reliant on trade. Moreover, the interconnected nature of financial markets means that a crisis in one major economy often spreads rapidly worldwide.
b. Geopolitical Risks
Political instability, trade wars, sanctions, and conflicts can disrupt global supply chains and impact investor sentiment. Recent examples include the Russia-Ukraine war and tensions in the Middle East, both of which caused oil price volatility and uncertainty in global energy markets.
Geopolitical risks can also lead to protectionism — where countries impose tariffs or restrict trade to protect domestic industries, slowing global commerce and increasing costs.
c. Currency and Exchange Rate Risks
In global business, currency fluctuations can significantly affect profits. When a company operates across multiple countries, it earns revenue in different currencies. If one currency weakens, it can reduce the company’s overall earnings when converted back to the home currency.
For instance, exporters from Japan or Europe often face profit declines when their local currency strengthens against the U.S. dollar. Managing this risk often requires complex hedging strategies.
d. Supply Chain Disruptions
Global supply chains have become more fragile due to over-dependence on certain regions for manufacturing and raw materials. Events like natural disasters, pandemics, or geopolitical tensions can halt production and raise costs. The COVID-19 pandemic exposed how vulnerable global supply networks are, leading many companies to rethink their sourcing strategies and focus on supply chain diversification.
e. Technological and Cybersecurity Risks
While technology drives globalization, it also introduces cyber threats and data privacy issues. Hackers and cybercriminals target multinational companies, leading to financial losses and reputational damage.
Moreover, as automation and artificial intelligence (AI) reshape industries, there’s a risk of job displacement and unequal technological adoption between countries, which can widen global inequality.
f. Environmental and Regulatory Risks
Climate change and environmental degradation are becoming major global concerns. Governments worldwide are enforcing stricter environmental laws and carbon regulations. Businesses that fail to adopt sustainable practices face penalties, reputational harm, or exclusion from eco-conscious markets.
At the same time, frequent natural disasters and changing weather patterns threaten agricultural output, infrastructure, and supply stability.
3. Key Opportunities in the Global Market
a. Expansion of Emerging Markets
Emerging economies like India, Indonesia, Vietnam, and several African nations are projected to lead global growth in the coming decades. These regions have young populations, expanding middle classes, and growing consumer demand.
For investors and multinational companies, emerging markets offer new avenues for trade, infrastructure development, and technology adoption. Global brands can tap into these markets by offering affordable, localized products and services.
b. Technological Innovation and Digital Transformation
Digital technologies — from AI to blockchain and 5G — are revolutionizing how businesses operate globally. E-commerce, fintech, and cloud computing have reduced entry barriers for small and medium enterprises (SMEs) to reach international customers.
Companies that embrace digital transformation gain efficiency, lower costs, and can compete globally. Moreover, digital finance and cryptocurrencies are opening new frontiers for cross-border transactions.
c. Sustainability and Green Investments
The global shift toward sustainability presents enormous opportunities. Clean energy, electric vehicles, and carbon-neutral products are attracting massive investment. Governments and institutions are pushing for green finance and environmental, social, and governance (ESG) compliance.
Investors who focus on sustainable assets are likely to benefit as the world transitions to a low-carbon economy. This creates new markets in renewable energy, waste management, and sustainable agriculture.
d. Diversification and Strategic Alliances
Globalization allows companies to diversify their production, investment, and sourcing strategies. Instead of depending on a single region, businesses can build strategic alliances and joint ventures across countries.
For example, technology partnerships between Western and Asian firms allow access to new technologies and talent pools, enhancing innovation and competitiveness.
e. Global Talent and Knowledge Sharing
The digital era has made it possible for organizations to tap into global talent pools. Remote work and cross-border collaboration have become common, allowing firms to recruit the best minds from anywhere in the world.
Knowledge sharing across borders fosters innovation, research, and cultural exchange, enriching global productivity and creativity.
f. Rising Global Consumer Base
The global middle class is expanding rapidly — especially in Asia and Africa. This surge in purchasing power offers companies a vast consumer market. Industries like e-commerce, entertainment, finance, and healthcare are seeing strong growth due to changing lifestyles and increasing digital adoption.
4. Balancing Risks and Opportunities
To succeed in the global market, companies and investors must skillfully balance risk management with opportunity pursuit.
Some effective strategies include:
Diversification: Investing across countries, sectors, and currencies to reduce exposure to regional risks.
Hedging: Using financial instruments like futures, options, and swaps to mitigate currency and interest rate risks.
Scenario Planning: Preparing for multiple future possibilities by forecasting economic, political, and technological shifts.
Sustainability Integration: Adopting green practices not only reduces risk but also attracts conscious investors and customers.
Agile Operations: Building flexible supply chains and digital infrastructure to adapt quickly to global disruptions.
5. Conclusion
The global market is a double-edged sword — filled with unprecedented opportunities but also heightened risks. Businesses that understand this balance and adapt proactively are best positioned to thrive.
While risks such as economic volatility, geopolitical conflicts, and regulatory challenges cannot be fully eliminated, they can be managed through strategic planning and diversification.
At the same time, opportunities arising from digital transformation, sustainability, and emerging markets provide pathways to long-term growth and profitability.
In the evolving global landscape, success will depend not just on expansion but on resilience, adaptability, and foresight — the ability to navigate uncertainty while seizing the immense potential the global market offers.

International Finance TransformedThe Evolution of Global Financial Systems
International finance — the study and management of monetary interactions between countries — has undergone a remarkable transformation over the past century. From the gold standard era to digital currencies and globalized capital markets, the way money moves across borders today looks vastly different from what it once was. The evolution of technology, policy frameworks, and global institutions has reshaped how nations trade, borrow, invest, and respond to crises. Let’s explore how international finance has transformed and what it means for the modern global economy.
1. The Foundations of International Finance
In its early form, international finance revolved around trade settlements between nations. During the 19th and early 20th centuries, the gold standard was the dominant system. Under it, each country’s currency was backed by a fixed amount of gold, providing stability in exchange rates. This predictability helped global trade flourish but also limited monetary flexibility — countries couldn’t print more money without gold reserves.
World War I disrupted the gold standard, and the Great Depression further weakened it. Nations realized that rigid monetary systems could not sustain economic stability during global crises. By the mid-20th century, international finance needed a new architecture — one that balanced stability with flexibility.
2. The Bretton Woods Era: Building a New Global Order
The Bretton Woods Conference of 1944 marked the beginning of a new financial era. The world’s major economies gathered to design a framework that would rebuild war-torn economies and promote financial cooperation. Two key institutions were born:
The International Monetary Fund (IMF): tasked with maintaining exchange rate stability and providing short-term financial assistance to countries in crisis.
The World Bank: focused on long-term development loans and post-war reconstruction.
Under Bretton Woods, currencies were pegged to the U.S. dollar, which was itself convertible to gold at $35 per ounce. This created a semi-fixed exchange rate system. For nearly three decades, this arrangement promoted trade growth and investment stability.
However, by the late 1960s, the system began to strain. The U.S. faced mounting inflation and fiscal deficits from the Vietnam War and social spending. Other countries started demanding gold for their dollar reserves, leading to a confidence crisis. In 1971, President Richard Nixon ended the dollar’s convertibility into gold, effectively dismantling the Bretton Woods system.
3. The Era of Floating Exchange Rates and Financial Liberalization
The 1970s ushered in the floating exchange rate system, where market forces determined currency values. This was a major transformation — currencies could now fluctuate freely based on demand, supply, and economic fundamentals.
Simultaneously, the world witnessed financial liberalization. Capital controls were gradually lifted, allowing funds to move across borders with fewer restrictions. Multinational corporations expanded globally, and banks began to operate internationally, facilitating massive flows of capital, credit, and investment.
Technological innovation also played a vital role. The rise of computerization, electronic trading systems, and later the internet revolutionized financial transactions. The creation of derivatives markets allowed investors to hedge against currency risks, while global bond markets provided new financing avenues for governments and corporations alike.
4. Globalization and the Rise of Emerging Markets
By the 1990s, globalization became the defining force of international finance. Emerging economies in Asia and Latin America opened their markets to foreign investment. Institutions like the World Trade Organization (WTO) encouraged trade liberalization, while financial integration deepened.
However, the increased interdependence also brought vulnerabilities. The Asian Financial Crisis (1997) and the Russian Debt Default (1998) exposed how rapid capital inflows and outflows could destabilize economies. Speculative attacks on currencies and sudden capital flight became new risks in the global financial landscape.
Despite these challenges, emerging markets continued to grow rapidly, attracting foreign investors with high returns. China’s rise as a manufacturing and financial powerhouse transformed global supply chains and trade balances. The world’s economic center of gravity began shifting eastward.
5. The 2008 Global Financial Crisis: A Turning Point
The 2008 Global Financial Crisis (GFC) marked another historic transformation in international finance. Triggered by the collapse of the U.S. housing bubble and excessive risk-taking in financial markets, it exposed the fragility of the global banking system.
Within months, credit markets froze, stock markets crashed, and major banks faced insolvency. Because of financial globalization, the crisis quickly spread worldwide. Institutions like Lehman Brothers collapsed, while governments in the U.S. and Europe had to bail out their financial sectors.
In response, global policymakers introduced new frameworks:
Basel III Regulations strengthened bank capital and liquidity requirements.
Central banks like the U.S. Federal Reserve, European Central Bank, and Bank of Japan coordinated monetary easing programs (quantitative easing).
The G20 emerged as a key platform for global economic coordination.
The crisis taught the world that interconnected financial systems required equally coordinated oversight. It also fueled debates over income inequality, corporate accountability, and the risks of excessive deregulation.
6. Digital Revolution and Fintech Transformation
The last decade has seen an extraordinary digital transformation in international finance. Technology is now at the heart of global money flows, reshaping banking, payments, and investments.
Fintech (Financial Technology) has revolutionized how people send, borrow, and invest money. Startups have introduced mobile banking, peer-to-peer lending, and decentralized finance (DeFi) platforms.
Cryptocurrencies like Bitcoin and Ethereum emerged as alternatives to traditional money, challenging central banks and governments.
Blockchain technology offers secure, transparent cross-border transactions, potentially reducing costs and intermediaries.
Central Bank Digital Currencies (CBDCs) are now being explored by many nations to modernize payment systems and maintain control over monetary policy.
This digital shift has made international finance faster and more inclusive — allowing individuals and small businesses in developing countries to participate directly in global markets. However, it also raises regulatory challenges, cybersecurity risks, and concerns over financial surveillance.
7. Sustainable Finance and Geopolitical Shifts
In recent years, sustainability has become a defining theme in global finance. Investors and governments are increasingly prioritizing ESG (Environmental, Social, and Governance) factors. Green bonds, climate funds, and carbon markets are reshaping investment flows, directing capital toward sustainable projects.
At the same time, geopolitical tensions — such as U.S.-China trade disputes, the Russia-Ukraine war, and supply chain disruptions — have redefined financial alignments. Countries are reassessing their currency reserves, trade dependencies, and energy security. The concept of “de-dollarization” — diversifying away from the U.S. dollar — has gained traction among nations seeking financial independence.
These dynamics are creating a multipolar financial order, where regional powers like China, India, and the EU are asserting greater influence over global finance. Institutions like the BRICS Bank (New Development Bank) represent alternatives to Western-dominated systems.
8. The Future of International Finance
Looking ahead, international finance will continue to evolve along several key dimensions:
Digital Integration: Cross-border digital payments will become seamless, supported by blockchain and AI-driven systems.
Regulation and Stability: Policymakers will balance innovation with oversight to prevent future crises.
Green Transformation: Climate finance will become central to global capital allocation.
Inclusive Growth: Efforts to bridge the financial gap between developed and developing economies will intensify.
The challenge will be maintaining global cooperation in an era of economic nationalism, technological disruption, and environmental urgency.
Conclusion
The transformation of international finance reflects humanity’s constant quest for balance — between stability and innovation, national interests and global cooperation. From gold-backed currencies to blockchain-based transactions, each era has redefined how nations and individuals engage in the global financial system.
Today, as technology, geopolitics, and sustainability reshape the global order, international finance stands at a new crossroads. The next chapter will be written not just by central banks and corporations, but by digital platforms, emerging economies, and ordinary citizens participating in a truly interconnected world.
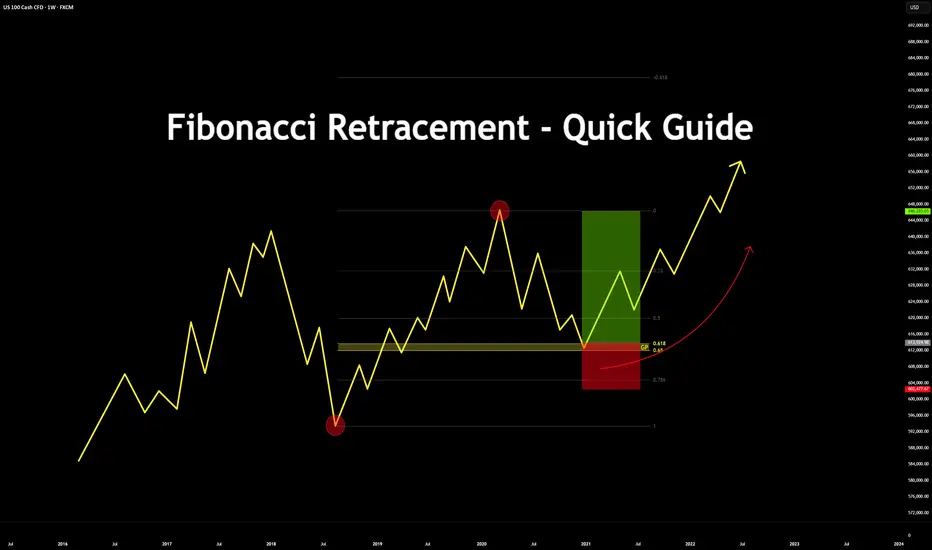
Fibonacci Retracement - Quick Guide in 5 StepsTrading the Fibonacci Retracement - Quick Guide in 5 Steps.
What is the Fibonacci tool?
The Fib Retracement Tool is a tool used widely across many charts. From crypto to stocks.
It assists in identifying the Golden Pocket, along with any potential Support and Resistance zones based on the sequence in Fibonacci.
Investors & Traders draw it from a previous high/low or low/high.
On a chart, each key level shows where price might pause or reverse during a pull back, before it continues the trend.
In this guide you will learn how to use the Fibonacci tool in 5 steps.
1. Configurations
Open up your Fib Retracement Tool's settings, apply the below configurations.
(You can change the color to your choice)
2. Identify High/Low's
Identify, recent highs and lows of your current chart/pair.
3. Applying Fib Retracement
Select your Fib Retracement tool. Place it on your chart starting from the swing low to the swing high.
4. Once completed
Highlight the Golden Pocket Field in the zone (0.65-0.618)
5. Review Entry
Price will eventually make it's way back down to the Golden Pocket to retest and reverse.
SL Placement would be on a previous low or key level, TP placement would be at a previous high or key level.
Bonus:
See the real time example below:
Please like, comment and follow if this guide was useful to you.
If you have any requests on analysis or tutorial requests, let me know and I'll be happy to make one!
Case study : completing tasks ,both with and without the assistGeneral idea. For a new shore aimed at a specific market or sports is understand,be creative and give at least 10 idea
2) pick the best idea and explain why so that your boss and other manager can understand your think
3) describe a potential prototype shoe in vivib detail in one paragraph three to four sentencesd
4) come up with a list of step needed to launch the product be concise but comprehensive
5) come up with name for the product consider at least four name , write them down and explain the you picked
6)use your knowledge to segment the footwear Industry market by use keep it general and do not focus yet on you specific target and customer group
7) list the initial segment you might consider (do not consider more than three)
LIST the presumed needs of each of these segments explain you assessment
8) divide which segment is must important explain your assessment
10)come up with a marketing slogans of each of the segment your
11) suggest three way testing whether your marketing slogans work well with the customer you have identity

Global Payments RevolutionizedThe Transformation of Money Movement in the Modern Era
The global payments industry has undergone a remarkable transformation in recent decades. Once dominated by cash, checks, and manual bank transfers, today’s payment systems have evolved into fast, secure, and borderless networks driven by innovation, technology, and globalization. The shift from traditional to digital transactions has redefined how individuals, businesses, and governments interact financially. This revolution has not only simplified commerce but also expanded financial inclusion, improved transparency, and accelerated economic growth across the world.
1. The Historical Context of Global Payments
For centuries, global trade relied heavily on physical currency and paper-based systems. International trade payments involved cumbersome processes such as letters of credit, telegraphic transfers, and intermediary banks, often taking days or even weeks to complete. These systems were expensive, slow, and prone to fraud and error. As globalization intensified in the late 20th century, the need for more efficient, standardized, and secure payment systems became evident.
The introduction of credit cards, electronic fund transfers (EFT), and the SWIFT (Society for Worldwide Interbank Financial Telecommunication) network in the 1970s marked the first wave of modernization. SWIFT allowed banks to communicate securely about international payments, while card networks like Visa and Mastercard made cross-border consumer transactions simpler. However, true transformation came with the rise of the internet and digital technologies in the 21st century.
2. Digital Transformation and Fintech Disruption
The emergence of financial technology (fintech) startups in the 2000s redefined the payments ecosystem. Traditional banks faced competition from nimble, tech-driven firms offering faster, cheaper, and user-friendly payment solutions. Companies like PayPal, Stripe, and Square introduced digital payment systems that allowed seamless online transactions, transforming e-commerce globally.
Mobile payment platforms, such as Apple Pay, Google Pay, and Samsung Pay, enabled consumers to make purchases with just a tap of their smartphones. Peer-to-peer (P2P) transfer apps like Venmo, Cash App, and Revolut made splitting bills or sending money internationally almost instant.
Fintech innovation has also driven down transaction costs and improved accessibility. Through digital wallets, even unbanked populations in developing regions can participate in the global economy. For example, M-Pesa in Kenya revolutionized financial inclusion by enabling millions to send, receive, and save money via mobile phones without traditional bank accounts.
3. Rise of Real-Time Payment Systems
One of the most significant advances in modern payments has been the adoption of real-time payment (RTP) systems. Unlike traditional bank transfers that may take days, RTP enables instant fund settlement, 24/7. Countries like the U.K. (with Faster Payments), India (with UPI – Unified Payments Interface), and Brazil (with Pix) have set global benchmarks for efficient domestic payment systems.
India’s UPI, launched in 2016, has become a global model for digital transactions. It allows users to transfer money instantly across different banks using a mobile device, supporting billions of monthly transactions. The success of such systems has inspired other nations to modernize their infrastructure, leading to initiatives like the European Union’s SEPA Instant and the U.S. FedNow system.
These innovations have also enhanced cross-border payment efficiency, allowing businesses to settle invoices, pay suppliers, and manage global operations with unprecedented speed.
4. Blockchain and Cryptocurrency: The Next Frontier
The emergence of blockchain technology and cryptocurrencies such as Bitcoin, Ethereum, and stablecoins has redefined the meaning of global payments. Blockchain’s decentralized ledger allows transactions to be verified and recorded without intermediaries, reducing costs and increasing transparency.
Cryptocurrencies enable near-instant cross-border transfers, bypassing traditional banking channels that often charge high fees. Stablecoins, digital tokens pegged to fiat currencies, provide the stability needed for practical payment use.
Moreover, central bank digital currencies (CBDCs) are being developed globally as a government-backed alternative to private cryptocurrencies. China’s Digital Yuan, the European Union’s Digital Euro, and India’s Digital Rupee are examples of how national monetary authorities are embracing blockchain to modernize payment systems. These initiatives could further enhance financial inclusion and make international payments more secure and efficient.
5. E-commerce and the Rise of Global Payment Gateways
The global e-commerce boom has accelerated the demand for seamless international payment solutions. Platforms like PayPal, Stripe, and Adyen have made it possible for businesses to accept payments in multiple currencies while complying with local regulations.
Additionally, buy-now-pay-later (BNPL) services such as Klarna and Afterpay have transformed consumer behavior by allowing flexible payments without traditional credit cards. These digital solutions have expanded global consumer bases for businesses, enabling cross-border trade like never before.
In parallel, marketplaces such as Amazon, Alibaba, and Shopify have integrated payment gateways into their platforms, ensuring that sellers and buyers worldwide can transact effortlessly.
6. Security, Regulation, and Trust
With the expansion of digital payments comes the challenge of cybersecurity and regulatory compliance. Fraud, data breaches, and money laundering risks have increased, prompting governments and financial institutions to strengthen digital identity verification, encryption, and anti-money laundering (AML) measures.
Frameworks like PSD2 (Payment Services Directive 2) in Europe mandate strong customer authentication and promote open banking. Open banking allows third-party developers to build financial services around consumer data, further promoting innovation while maintaining security standards.
Consumer trust remains crucial, and innovations such as biometric authentication, tokenization, and AI-based fraud detection have made digital payments safer than ever.
7. Financial Inclusion and Socioeconomic Impact
One of the most profound impacts of the payment revolution is the expansion of financial inclusion. Digital payment platforms have brought millions of people—especially in Africa, Asia, and Latin America—into the formal financial system.
For small businesses and entrepreneurs, access to digital payments means access to credit, savings, and investment opportunities. Governments are also using digital payment infrastructure to deliver subsidies, pensions, and social welfare programs directly to citizens, reducing corruption and inefficiency.
The democratization of payments has empowered women, rural communities, and informal workers by giving them control over their finances, thus contributing to overall economic development.
8. The Future of Global Payments
The next decade of payments will likely focus on interoperability, sustainability, and AI-driven automation. Efforts are underway to connect domestic real-time systems globally through initiatives like the Bank for International Settlements (BIS) Project Nexus, which aims to create seamless cross-border payment corridors.
Artificial Intelligence and machine learning will continue to optimize fraud detection, customer experience, and transaction processing. Meanwhile, sustainability is gaining importance—digital payments reduce the carbon footprint associated with cash production and transportation.
Moreover, embedded finance, where payment capabilities are integrated directly into apps, vehicles, or devices, will make payments invisible and frictionless. For instance, electric vehicles might automatically pay for charging, or smart refrigerators could reorder groceries autonomously.
9. Challenges Ahead
Despite rapid progress, challenges persist. Many developing countries still face digital infrastructure gaps, internet connectivity issues, and limited financial literacy. Additionally, regulatory differences between countries complicate global payment interoperability.
There is also an ongoing debate about privacy and surveillance in digital payments, especially concerning CBDCs and data sharing. Balancing innovation, efficiency, and individual rights will be crucial as global payments continue to evolve.
10. Conclusion
The revolution in global payments represents far more than technological advancement—it symbolizes a transformation in how humanity exchanges value. From the days of barter and coins to instant digital transfers and decentralized currencies, payment systems have continuously adapted to the needs of global commerce and society.
Today’s payment revolution is breaking down economic barriers, fostering inclusion, and enabling a truly connected global economy. As technology continues to evolve—powered by blockchain, artificial intelligence, and open banking—the future of global payments promises to be faster, more inclusive, and more intelligent than ever before.
In essence, money is no longer just a medium of exchange—it has become a dynamic, digital ecosystem driving the next phase of global economic growth.

Commodity Futures in World Trading1. Understanding Commodity Futures
A commodity future is a standardized legal contract to buy or sell a specific quantity of a commodity at a predetermined price on a future date. Commodities can be broadly classified into hard commodities—such as crude oil, gold, and natural gas—and soft commodities like wheat, coffee, sugar, and cotton. These contracts are traded on regulated exchanges like the Chicago Mercantile Exchange (CME), London Metal Exchange (LME), Intercontinental Exchange (ICE), and the Multi Commodity Exchange (MCX) in India.
Futures differ from spot trading because they involve agreements for future delivery, though in most cases, contracts are settled financially rather than through physical delivery. Traders use futures to hedge against risk or to profit from anticipated price changes.
2. Historical Background of Commodity Futures
The origin of commodity futures can be traced back to the 17th century Japanese rice markets, where merchants and samurai used forward contracts to lock in rice prices. However, the modern system began in 1848 with the establishment of the Chicago Board of Trade (CBOT), which formalized futures trading for agricultural commodities like corn and wheat. Over time, the system expanded to include metals, energy, and financial instruments, transforming commodity futures into a sophisticated tool of global finance.
3. Key Players in the Commodity Futures Market
The commodity futures market involves several participants, each playing a distinct role:
Hedgers: Producers and consumers who use futures to protect themselves from adverse price movements. For example, an oil producer may sell crude oil futures to lock in prices, while an airline might buy fuel futures to stabilize costs.
Speculators: Traders and investors who take positions to profit from price fluctuations. They provide liquidity to the market.
Arbitrageurs: Professionals who exploit price differences across markets to earn risk-free profits.
Clearing Houses: Entities that guarantee contract performance and minimize counterparty risk.
Exchanges and Regulators: Institutions that oversee trading and ensure transparency and fairness.
4. How Commodity Futures Work
When two parties agree on a futures contract, they commit to buy or sell a commodity at a set price on a specific date. Each contract specifies:
Quantity and quality of the commodity
Delivery date and location
Standardized terms set by the exchange
Traders must deposit an initial margin, a small percentage of the contract value, as a performance guarantee. Prices are marked to market daily—profits and losses are settled based on daily price changes. This ensures that both parties maintain sufficient capital to cover their positions.
At expiration, the contract is either settled by physical delivery (actual exchange of goods) or cash settlement, where differences between the contract and market prices are paid.
5. Importance of Commodity Futures in Global Trade
Commodity futures are indispensable in global trade for several reasons:
a. Price Discovery
Futures markets provide a transparent mechanism for determining global commodity prices. Since prices are driven by collective expectations of traders worldwide, they reflect real-time supply and demand conditions.
b. Risk Management
Producers, exporters, and importers use futures to hedge against price volatility. For instance, a farmer can lock in the price of wheat before harvest, ensuring stable income despite market fluctuations.
c. Market Liquidity
Speculators and institutional traders bring liquidity to the market, enabling quick transactions without major price disruptions.
d. Global Economic Stability
By mitigating price risks and ensuring consistent supply chains, futures contribute to macroeconomic stability, especially in energy and food sectors.
e. Investment Diversification
Commodity futures allow investors to diversify portfolios beyond traditional assets like equities and bonds. Commodities often move differently from stock markets, providing a hedge during inflationary periods.
6. Major Commodity Exchanges Around the World
Several global exchanges facilitate commodity futures trading:
Chicago Mercantile Exchange (CME) – The largest futures exchange, trading in energy, metals, and agricultural commodities.
Intercontinental Exchange (ICE) – Known for energy products like crude oil and natural gas.
London Metal Exchange (LME) – Specializes in base metals like copper, aluminum, and zinc.
Tokyo Commodity Exchange (TOCOM) – Trades energy, metals, and rubber.
Multi Commodity Exchange (MCX), India – A leading exchange for gold, crude oil, and agricultural commodities in Asia.
These exchanges operate electronically, ensuring efficiency, transparency, and real-time global access.
7. Major Commodities Traded in Futures Markets
Commodity futures span across several categories:
Energy: Crude oil, natural gas, heating oil, gasoline
Metals: Gold, silver, platinum, copper, aluminum, zinc
Agriculture: Corn, wheat, soybeans, coffee, sugar, cotton
Livestock: Cattle, hogs, and poultry
Energy and metals are especially crucial to industrial economies, while agricultural futures influence food prices worldwide.
8. Economic Impact of Commodity Futures
Commodity futures influence global trade and economic policy in profound ways:
Inflation Indicator: Rising commodity prices often signal inflationary pressures.
Foreign Exchange Impact: Commodity-exporting nations’ currencies (like Canada, Australia, and Russia) often correlate with commodity prices.
Investment Tool: Institutional investors use commodity indices (like Bloomberg Commodity Index) to gain exposure to global resources.
Supply Chain Efficiency: Futures stabilize business planning for industries dependent on raw materials, ensuring smoother global supply chains.
9. Risks and Challenges in Commodity Futures
Despite their benefits, commodity futures carry inherent risks:
Price Volatility: Sharp market swings can lead to heavy losses for unhedged or speculative positions.
Leverage Risk: Since futures require only margin deposits, losses can exceed initial investments.
Market Manipulation: Large players may attempt to corner markets, influencing prices unfairly.
Regulatory Differences: Diverse rules across countries can create barriers to efficient global trading.
Geopolitical Uncertainty: Wars, sanctions, and trade disputes can disrupt global supply and impact futures prices dramatically.
10. The Future of Commodity Futures Trading
The landscape of commodity futures is evolving rapidly with technology, sustainability, and global economic shifts.
Digital Transformation: Algorithmic trading, AI-based analytics, and blockchain technology are revolutionizing trade execution and settlement processes.
Environmental Commodities: New futures contracts for carbon credits and renewable energy are emerging as sustainability becomes central to global policy.
Emerging Market Participation: Countries like India, Brazil, and China are becoming major players in commodity futures, increasing global liquidity.
Integration with Financial Markets: Commodity futures are increasingly intertwined with financial instruments, enabling broader participation from institutional investors.
Conclusion
Commodity futures are the lifeblood of the global trading system, balancing the interests of producers, consumers, and investors. They not only stabilize prices but also enable efficient allocation of resources and capital across economies. As markets evolve, driven by technology, environmental concerns, and geopolitical shifts, the role of commodity futures will become even more integral to ensuring transparency, liquidity, and resilience in world trade. For businesses, policymakers, and investors alike, understanding and leveraging commodity futures is essential for navigating the complexities of the modern global economy.

Venture capital’s impact on the global trade marketHow VC affects global trade: the mechanisms
Financing innovation that changes traded goods and services.
VC funds back high-growth firms that commercialize new technologies — cloud computing, advanced manufacturing, fintech, biotech, logistics automation, and more. When those firms scale, they create new tradable goods and services (SaaS, precision-manufactured components, platform-enabled logistics). This changes the composition of trade: more intangible flows (software, data services, algorithms) and more niche high-value physical goods replace or complement traditional commodity exports.
Accelerating cross-border platformization.
Many VC-backed companies are platforms (marketplaces, payment networks, cloud providers) whose value increases rapidly with scale and cross-border adoption. Platforms reduce transaction costs for international trade — matching buyers and sellers, enabling payments, providing reputational signals, and coordinating logistics. As platforms spread, they lower entry barriers for SMEs to sell abroad, boosting smaller-scale cross-border commerce and diversifying trade flows.
Transforming supply chains and logistics.
VC funds startups that digitize procurement, inventory, freight matching, customs compliance, and last-mile delivery. Innovations such as real-time tracking, AI-driven demand forecasting, and digital freight marketplaces make supply chains more responsive and efficient, enabling just-in-time and cross-border manufacturing models that wouldn’t be feasible earlier. This increases the volume and complexity of trade while reducing friction and cost.
Enabling services trade and digital exports.
VC concentrates in sectors with low marginal-cost reproduction (software, digital media, professional services delivered online). This encourages countries and firms to export services rather than only goods. Digital exports scale quickly and change balance-of-trade dynamics: countries with strong VC ecosystems often become net exporters of digital services, platform access, and intellectual property.
Shifting where value is captured.
VC incentives — fast growth, winner-take-most dynamics — tend to cluster value capture into a handful of global hubs (Silicon Valley, Shenzhen, Berlin, Bengaluru). This concentration affects trade patterns: components and raw inputs might be sourced globally, but design, IP, and high-margin services concentrate in VC hubs, shifting where trade-related revenue accrues.
Mobilizing global capital and cross-border investment.
VC syndicates, limited partners, and crossover investors operate internationally. Cross-border VC flows channel capital into emerging markets, enabling local firms to scale for export and import substitution. Conversely, outbound VC by multinationals can seed ecosystems abroad that later integrate into global production networks.
Regional patterns and asymmetries
VC’s trade effects are uneven. Advanced economies with deep VC ecosystems tend to export high-value services, software, and specialized capital goods, while importing raw materials and standardized manufactured goods. Emerging markets often receive VC that helps them move up the value chain (e.g., fintech in Africa enabling cross-border remittances, or manufacturing startups in Southeast Asia adding localized tech to global supply chains). However, the scale and type of VC differ: early-stage consumer apps proliferate in populous markets, while deep-tech VC concentrates where research and IP protection exist.
Risks, distortions, and unintended consequences
Concentration and monopoly power.
VC’s “go big fast” model favors market concentration. Dominant platforms can extract rents, distort trade by locking sellers into their ecosystems, and raise barriers for competitors from other countries.
Short-termism and fragility.
Chasing growth sometimes prioritizes market share over sustainable trade relationships or resilient supply chains. VC-backed firms that expand rapidly but lack stable unit economics can fail, disrupting cross-border networks they had come to enable.
Uneven benefits and inequality.
Regions without VC access may be relegated to low-value segments of global value chains. Even within countries, VC-backed growth can widen gaps between digitally integrated exporters and traditional exporters.
Regulatory arbitrage and data flows.
VC-backed platforms often operate across jurisdictions with differing data, privacy, and competition rules. This can create regulatory tensions that affect trade in digital services and cross-border data transfers.
Overreliance on external capital.
Countries that depend on foreign VC inflows for digital export growth may be vulnerable to cyclical capital flows. A sudden retrenchment in global VC can stall export-oriented startups and compress trade.
Policy implications and responses
Invest in complementary assets.
Governments wanting to maximize trade benefits from VC should strengthen research institutions, IP frameworks, digital infrastructure, and skills training. These make local startups more likely to scale into export-capable firms.
Support inclusive access to VC and alternatives.
Programs to broaden investor access (local LPs, public co-investment, blended finance) can reduce regional disparities and keep value capture local. Supporting later-stage finance domestically helps startups mature without forced early exits.
Regulate to preserve competition and resilience.
Antitrust and data-governance policies should balance innovation incentives with prevention of monopolistic platform dominance that can distort trade. Similarly, policies encouraging supply-chain diversification and transparency improve resilience against startup failures.
Promote standards and cross-border agreements.
Trade agreements and harmonized digital regulations (data portability, e-invoicing, digital ID) reduce friction for VC-enabled cross-border services and platforms.
Mitigate risks of capital volatility.
Macroprudential tools, sovereign wealth participation in funds, or public venture vehicles can dampen boom-bust cycles that otherwise cascade into trade disruptions.
Conclusion
Venture capital significantly reconfigures global trade by financing innovations that change what is traded, how trade is organized, and who captures its value. Its power to accelerate platformization, digitization, and supply-chain optimization brings opportunities for growth, diversification, and inclusion — but it also concentrates value, introduces fragility, and can amplify inequalities without careful policy design. For countries and firms, the goal should be to harness VC’s dynamism while building institutions, regulations, and financing structures that spread benefits, preserve competition, and shore up the resilience of the global trade networks VC helps create.

Forex Trading Secrets: The Hidden Keys of the Currency Market 1. Understanding the Core Mechanics of Forex
Before diving into strategies, it’s crucial to grasp how Forex truly works. Currencies trade in pairs, such as EUR/USD or USD/JPY, where one currency is bought while the other is sold. The movement of these pairs is driven by supply and demand, interest rate differentials, economic strength, and global political events.
Professional traders understand that the Forex market is not random — it responds to global economic forces and liquidity flows. The key secret is recognizing that Forex is a relative market — success depends not on whether a single economy is strong or weak, but how one performs relative to another.
2. The Power of Institutional Footprints
Retail traders often forget that big banks and institutions control 80% of Forex volume. These institutions move markets through large orders and sophisticated algorithms. They use tactics like stop-hunting, liquidity grabbing, and false breakouts to trap smaller traders.
A smart trader learns to read institutional footprints — areas where price repeatedly reverses or consolidates are often zones where large players enter positions. Watching for liquidity pools near major support and resistance levels can reveal where “smart money” is accumulating or distributing.
3. Mastering Technical Analysis — But With Simplicity
Most traders clutter their charts with too many indicators. Successful Forex traders rely on price action — the pure movement of price — rather than indicator overload.
Candlestick patterns, trendlines, and moving averages remain powerful tools when used wisely. The secret is to use confluence, or the alignment of multiple signals, before taking a trade. For example, if a bullish engulfing pattern appears at a long-term support zone along with an oversold RSI, that’s a higher-probability trade setup.
In short, simplicity beats complexity. The best traders use clear, minimal charts and focus on market structure, not prediction.
4. The Role of Fundamental Forces
Forex is heavily influenced by macroeconomic data such as inflation, GDP growth, interest rates, and employment figures. Central banks — especially the Federal Reserve, ECB, Bank of Japan, and Bank of England — play a dominant role in shaping currency direction.
The “secret” is to trade fundamental momentum, not news headlines. For instance, if the U.S. economy shows consistent strength and the Fed is hiking interest rates, the U.S. dollar tends to appreciate for months — not just during the news release.
Smart traders don’t chase volatility; they position themselves with the macro trend and ride long-term moves based on global monetary cycles.
5. The Secret of Risk Management
Risk management is perhaps the most guarded secret of professional trading. The best traders don’t win every trade; they protect capital so they can stay in the game.
Here are core risk rules:
Never risk more than 1–2% of your account on a single trade.
Always use a stop-loss to cap potential losses.
Calculate your risk-to-reward ratio — aim for at least 1:2, meaning you risk $1 to make $2.
Avoid overleveraging; high leverage can destroy an account quickly.
Remember: Forex success isn’t about being right all the time — it’s about making more on winners than you lose on losers.
6. Psychological Discipline — The Real Edge
Even with perfect analysis, traders often fail due to emotional trading. Fear, greed, and impatience are the true enemies of profit.
Winning traders cultivate discipline and emotional control. They follow their trading plan strictly, never revenge trade after losses, and avoid overconfidence after wins.
Keeping a trading journal is a secret weapon for developing discipline — it helps identify emotional patterns, bad habits, and areas for improvement.
In Forex, your mindset determines your success more than your strategy. As the saying goes, “Trading is 10% strategy and 90% psychology.”
7. The Power of Trading Plans and Backtesting
Every professional trader operates with a clear trading plan — a blueprint defining when to enter, exit, and manage trades. This plan includes:
Entry conditions (technical or fundamental signals)
Exit rules (take profit and stop loss)
Risk parameters
Market conditions to avoid (e.g., major news events)
Before going live, experts backtest their strategies using historical data to assess profitability. This process filters out weak setups and builds confidence. The secret here is consistency — following one well-tested method instead of jumping between strategies after every loss.
8. Liquidity Timing and Session Secrets
The Forex market operates across three main sessions: Asian, European, and U.S. Each has unique volatility and behavior.
The Asian session is typically slower and range-bound.
The London session brings high liquidity and strong trends.
The New York session overlaps with London, creating the most volatile moves of the day.
Seasoned traders know that the London-New York overlap (about 12:30 PM to 3:30 PM IST) offers the best opportunities for strong, sustained moves. Additionally, institutional traders often enter or exit positions around session opens — understanding these patterns can greatly improve timing.
9. Avoiding the Common Retail Traps
Most retail traders fail due to predictable mistakes:
Overtrading and using high leverage
Ignoring stop-losses
Trading during low-liquidity hours
Following social media “gurus” or random signals
Lacking patience for long-term growth
The secret is to trade like a business, not a lottery. Treat capital as inventory, risk as cost, and profits as sustainable growth. Focus on consistency, not overnight success.
10. Continuous Learning and Adaptation
The final secret of Forex mastery is lifelong learning. The market evolves as economies, technology, and monetary policies change. Even the best traders constantly adapt their systems.
Follow economic news, study macroeconomic trends, and refine strategies through experience. Many professionals also use algorithmic tools or AI-driven indicators to enhance precision — but they still rely on human judgment for execution.
The best traders stay students of the market forever. They don’t seek shortcuts; they seek understanding.
Conclusion: The Real Secret Behind Forex Success
In truth, there are no “magic” Forex secrets — only disciplined principles practiced consistently. Success comes from combining technical clarity, macro awareness, emotional discipline, and risk control.
The world’s top traders don’t predict the market — they react intelligently to what it shows. They know when to trade, when to wait, and when to walk away.
The real secret is patience and mastery of self. Once you control your emotions, respect risk, and understand market behavior, the Forex market becomes not a mystery — but a mirror reflecting your own discipline and intelligence.
In the end, Forex trading is not about beating the market — it’s about mastering yourself within it.
Why Traders Get Wiped Out in the First 30 MinutesIf you’ve been trading Forex for a while, you’ve probably heard this saying:
___“Don’t jump into a trade right when the London session opens.”
And that advice is absolutely true.
The first 30 minutes of the London session are where most retail traders get burned out.
Not because they’re unlucky - but because that’s how the market works.
1. London Open: Liquidity Surges – Chaos Begins
When London opens , the Asian session is winding down.
This overlap creates a burst of liquidity , leading to sharp volatility.
Banks, hedge funds, and institutions begin positioning their orders.
Dozens of pending orders are triggered at once.
The result?
Price moves like a wild beast - violent spikes, fake breakouts, and sudden reversals.
Retail traders see the strong moves, get excited, jump in…
and get wiped out before the real trend even starts.
2. The Trap Called “Early Breakout”
One of the classic London session traps is the false breakout.
You see price breaking a key level, think: “That’s it! A clear signal!”, and you enter.
But minutes later, the market reverses — and your trade vanishes with it.
This isn’t random.
Smart money players intentionally create these fake breakouts to trigger the crowd’s orders — buys above resistance, sells below support — then reverse to accumulate positions at better prices.
An old trick, but still brutally effective — and every morning, retail traders keep falling for it.
3. FOMO – The Silent Account Killer
Nothing messes with a trader’s mind like seeing a massive candle explode right after the open.
You feel like you’re missing the move of the day.
That’s when FOMO (Fear of Missing Out) takes control — and discipline disappears.
But here’s the truth:
The first 30 minutes aren’t for making money — they’re for reading the market.
Professional traders don’t chase candles; they wait and watch to see which side truly dominates.
Retail traders, on the other hand, trade on emotion — and the market always punishes emotion.
4. So, What Should You Do?
Simple: Do nothing.
Let the chaos settle.
Watch who takes control — the buyers or the sellers.
Wait for the post-fakeout structure to form — that’s where the real opportunities appear.
Many professional traders use what’s called the “London Fakeout Strategy.”
They don’t fight the fakeout — they wait for the reaction after the fakeout to trade with the real direction of the market.
Because the real edge isn’t in prediction — it’s in patience.
💡 Coming Soon:
Would you like me to write Part 2: “The London Strategy Playbook” — a detailed guide on how to trade after the first 30 minutes of the London session,
with real examples and clear strategies?

Understanding the Concept of Exotic OptionsIntroduction: Beyond the Vanilla Options
In the world of derivatives trading, options are among the most powerful instruments available to investors. Traditional or “vanilla” options—such as calls and puts—are already versatile tools for hedging and speculation. However, as financial markets evolved, traders and institutions began to seek more sophisticated instruments that could offer customized payoffs, align with complex risk management needs, or exploit specific market views. This need gave birth to a more advanced class of derivatives known as exotic options.
Exotic options go beyond the standard payoff structure of vanilla options. They can depend on multiple underlying assets, trigger conditions, time periods, or paths that prices follow. These options have become integral in structured products, risk management, and tailored investment strategies, particularly in global forex, commodity, and equity-linked markets.
This essay explores the concept, types, valuation, applications, advantages, and risks of exotic options—providing a comprehensive understanding of how these instruments work in modern finance.
1. What Are Exotic Options?
Exotic options are non-standard derivative contracts that have complex features differentiating them from traditional options. While vanilla options grant the right to buy (call) or sell (put) an asset at a predetermined strike price before or at expiration, exotic options can alter how and when payoffs are determined.
They may:
Depend on the path of the underlying asset’s price, not just its final value.
Have multiple exercise or settlement dates.
Involve different underlying assets or currencies.
Include barriers, averages, or digital features that modify payouts.
For instance, a barrier option may only become active (“knock-in”) or inactive (“knock-out”) if the underlying price crosses a specified level. Similarly, an Asian option’s payoff depends on the average price of the underlying over time, reducing volatility effects.
Exotic options are thus tailored to specific investor needs—allowing hedgers or speculators to fine-tune their exposure to price movements, volatility, and time decay.
2. Evolution and Market Use
The development of exotic options traces back to the late 1970s and 1980s, when financial innovation surged alongside advances in computing and quantitative finance. Early forms appeared in the foreign exchange and commodity markets, where traders needed customized hedging tools to manage complex exposures.
By the 1990s, exotic options became a cornerstone of structured finance, used by investment banks to create tailor-made products for corporate clients and high-net-worth investors.
Today, exotic options are found across:
Currency markets (FX options): Commonly used for hedging exchange rate risks.
Commodity markets: To manage exposure to volatile prices.
Equity-linked notes and structured products: For customized return profiles tied to indices or stock baskets.
Interest rate and credit derivatives: To hedge rate movements or credit events.
Exotic options have thus evolved from niche instruments into mainstream financial engineering tools—allowing traders to achieve precise risk-return outcomes that vanilla options cannot offer.
3. Key Characteristics of Exotic Options
Exotic options differ from vanilla options through unique features such as:
a. Path Dependency
In vanilla options, only the final price of the underlying asset matters. In exotic options, however, the entire price path may influence the payoff.
Example: In an Asian option, the payoff depends on the average price over time, not the terminal price at expiration.
b. Conditional Payoffs
Many exotic options include “if-and-only-if” conditions. For instance:
Barrier options activate or deactivate based on price thresholds.
Lookback options depend on the maximum or minimum price achieved during the option’s life.
c. Multi-Asset Dependence
Some exotic options depend on more than one underlying, such as currency pairs, indices, or stock baskets.
Example: A basket option may be based on the average performance of multiple assets.
d. Complex Exercise Rules
Unlike American or European options, some exotics allow customized exercise schedules or partial exercises tied to specific market events.
e. Tailored Payout Structures
Payoffs can be linear, binary, capped, or floored—allowing unique risk-reward combinations suited to specific strategies.
4. Major Types of Exotic Options
There are numerous exotic options, but the following categories are among the most common and important:
a. Barrier Options
Barrier options are activated or extinguished when the underlying asset hits a certain level.
Types include:
Knock-in options: Become active only if the price crosses the barrier.
Knock-out options: Become void if the barrier is breached.
Double-barrier options: Have both upper and lower thresholds.
These are popular in currency and commodity markets due to their cost-effectiveness and targeted exposure.
b. Asian Options
Also known as average options, these derive their value from the average price of the underlying over a period.
They are used to smooth out volatility and reduce the impact of short-term price swings—ideal for commodities or volatile assets.
c. Lookback Options
Lookback options allow the holder to “look back” over the life of the option to determine the optimal strike or payoff.
For instance, the holder of a lookback call can buy at the lowest price observed during the option period.
These are valuable for volatility trading and performance-linked bonuses, but are more expensive due to the flexibility they provide.
d. Binary (Digital) Options
Binary options provide all-or-nothing payouts. If a condition is met (for example, the asset price exceeds the strike), a fixed amount is paid; otherwise, nothing is received.
They are used in speculative trading and hedging against specific events (like rate announcements or price thresholds).
e. Compound Options
A compound option is an option on another option. There can be four variants—call on call, call on put, put on call, and put on put.
These are primarily used by institutional investors managing portfolios of options or structured exposures.
f. Chooser Options
These allow the holder to decide, at a future date, whether the option will be a call or put.
They are ideal for hedging uncertainty, especially in situations where the future direction of prices is unclear.
g. Rainbow or Basket Options
These depend on multiple underlying assets. The payoff may be linked to the best or worst performer, or an average of all.
Used widely in equity-linked structured products to diversify exposure.
h. Barrier-Rebate and Range Options
In these, the payoff depends on whether the price stays within a certain range or hits a barrier, sometimes offering a rebate if deactivated.
5. Pricing and Valuation Challenges
Pricing exotic options is more complex than pricing vanilla ones because of path dependency and non-linear payoffs. Traditional Black-Scholes models are insufficient for many exotics. Instead, advanced methods such as:
Monte Carlo simulation (for path-dependent options),
Binomial or trinomial tree models (for barrier options),
Finite difference methods (for solving partial differential equations),
are used for accurate valuation.
Moreover, the valuation must incorporate:
Volatility skew and smile effects,
Interest rate differentials (especially in FX exotics),
Time decay and path volatility, and
Counterparty credit risks.
Due to these complexities, exotic option trading is typically limited to institutional investors and quantitative traders with access to robust pricing models and computing power.
6. Strategic Applications in Markets
Exotic options play several strategic roles in modern finance:
a. Risk Management
Corporations use them to hedge specific exposures that vanilla options cannot cover efficiently. For example:
A company importing oil may use an Asian call to hedge against the average price rather than the spot price.
Exporters use barrier options to hedge currency risks only if extreme price movements occur.
b. Yield Enhancement
Investors seeking higher returns may purchase structured products embedding exotic options (like range accrual notes) that provide enhanced coupons tied to certain price conditions.
c. Speculation and Arbitrage
Traders exploit exotic options to speculate on volatility, correlations, or price ranges rather than pure direction.
For instance, digital options allow bets on whether a price will surpass a level by expiration.
d. Structured Product Design
Exotic options form the building blocks of many structured investment products—such as equity-linked notes, autocallables, and principal-protected instruments—allowing issuers to customize payoffs.
7. Advantages of Exotic Options
Customization: Can be precisely structured to match unique market views or hedge specific risks.
Cost Efficiency: Often cheaper than vanilla options offering similar exposures due to conditional triggers.
Strategic Flexibility: Allow exposure to volatility, time, or correlation rather than simple price direction.
Diversification: Multi-asset or path-based structures provide diversification benefits.
Creative Payoffs: Enable innovative investment products appealing to both retail and institutional investors.
8. Risks and Limitations
While attractive, exotic options carry significant risks:
a. Complexity Risk
The intricate payoff structures make them hard to value or understand, leading to potential mispricing.
b. Liquidity Risk
Most exotic options are over-the-counter (OTC) products, not exchange-traded, hence low liquidity and wider bid-ask spreads.
c. Counterparty Risk
Since many trades are bilateral, there is always the possibility of default by the counterparty.
d. Model Risk
Valuation depends on complex models and assumptions about volatility, correlation, and interest rates. Incorrect assumptions can lead to misestimation of fair value.
e. Regulatory and Transparency Issues
Post-2008, regulators have tightened rules around complex derivatives, requiring greater disclosure and collateralization. Yet, transparency remains limited compared to exchange-traded instruments.
9. Real-World Examples
Currency Knock-Out Options: Commonly used by multinational corporations to hedge FX exposure cost-effectively.
Asian Options in Oil Markets: Used by airlines to manage jet fuel price volatility.
Autocallable Notes: Retail structured products embedding digital and barrier options that offer enhanced coupons but risk early termination.
These examples show how exotic options have integrated into mainstream hedging and investment frameworks, providing flexibility and innovation.
10. The Future of Exotic Options
With the rise of AI, quantitative finance, and data-driven analytics, the design and pricing of exotic options are becoming increasingly sophisticated. Innovations in machine learning, stochastic volatility models, and blockchain-based smart derivatives promise to make exotic options more transparent and accessible.
However, the challenge remains balancing complexity with clarity. Regulators and financial educators are emphasizing the need for greater transparency and investor awareness to prevent misuse or misunderstanding of such instruments.
Conclusion
Exotic options represent the pinnacle of financial innovation—a class of derivatives that blend mathematics, creativity, and risk management into one. They extend beyond the simplicity of vanilla options, allowing investors to capture nuanced market scenarios, hedge complex exposures, or design innovative return profiles.
However, their sophistication also brings inherent risks—especially in valuation, liquidity, and counterparty exposure. As global markets evolve, the role of exotic options continues to expand, bridging the gap between customized investment strategies and advanced financial engineering.
In essence, understanding exotic options is not merely about mastering a financial product—it’s about appreciating how modern finance tailors risk, reward, and imagination into instruments that shape the dynamics of the global derivatives market.
Risks and Limitations of ETF and Index Trading1. Market Risk: The Core Challenge
ETFs and index funds are designed to track the performance of a specific index, such as the Nifty 50, S&P 500, or NASDAQ-100. This means that if the underlying market declines, the ETF or index fund will also lose value.
Example:
During the 2020 pandemic crash, the Nifty 50 ETF lost over 35% of its value in a matter of weeks. Investors holding the ETF had no protection against this decline because ETFs are market-linked instruments.
Key takeaway:
ETFs are not immune to market downturns. While diversification helps reduce company-specific risks, systemic or market-wide risks cannot be avoided.
2. Tracking Error Risk
One of the most important limitations of ETFs and index funds is tracking error—the difference between the ETF’s performance and its benchmark index.
Causes of tracking error include:
Management fees: Even a 0.2% expense ratio can add up over time.
Dividends and cash holdings: If the ETF manager holds cash instead of being fully invested, returns will lag.
Rebalancing frequency: Delays or inefficiencies in adjusting to index changes can cause mismatches.
Transaction costs: Buying and selling underlying assets incur brokerage and spread costs.
Impact:
For instance, if the Nifty 50 gives a 10% return in a year but the ETF delivers only 9.6%, the 0.4% difference represents a tracking error.
Investor note:
While small tracking errors are normal, persistent or large deviations indicate poor fund management or structural inefficiencies.
3. Liquidity Risk
Liquidity plays a vital role in ETF and index trading. It refers to how easily you can buy or sell an ETF without significantly affecting its price.
Types of liquidity:
Primary liquidity: Based on the liquidity of the underlying securities.
Secondary liquidity: Based on the trading volume of the ETF itself.
The risk:
Some ETFs, especially thematic or sectoral ones, have low trading volumes. This means:
Wider bid-ask spreads.
Price gaps between the ETF and its net asset value (NAV).
Difficulty exiting positions during market stress.
Example:
During volatile market conditions, ETFs linked to small-cap indices or niche sectors may see spreads widen sharply, leading to losses even when the underlying index hasn’t fallen as much.
4. Counterparty Risk in Synthetic ETFs
Certain ETFs—known as synthetic ETFs—do not hold the actual securities of the index. Instead, they use derivatives (like swaps) to replicate performance. This introduces counterparty risk, meaning if the derivative provider defaults, investors may face losses.
Example:
If a European bank issues a swap-based ETF on the NASDAQ-100 and later faces financial distress, the ETF might fail to deliver accurate returns, even if the U.S. index performs well.
Lesson:
Always check whether an ETF is physical (holds real securities) or synthetic (uses swaps). Physical ETFs are generally safer for long-term investors.
5. Over-Concentration in Certain Sectors or Stocks
While ETFs offer diversification, index concentration remains a key limitation. Many indices are market-cap weighted, meaning larger companies dominate performance.
Example:
In the Nifty 50, the top five companies—Reliance Industries, HDFC Bank, ICICI Bank, Infosys, and TCS—often account for over 50% of the index weight.
So, if these few companies underperform, the entire index (and related ETFs) suffers, regardless of how other constituents perform.
Implication:
Investors mistakenly believe ETFs provide balanced diversification, but in practice, they may be overexposed to a handful of large-cap stocks or sectors, such as technology or banking.
6. Limited Upside Potential
ETFs and index funds are passive investment vehicles. They mirror the index and do not attempt to outperform it. Therefore, investors miss out on potential alpha generation that skilled active fund managers might deliver.
Scenario:
If a fund manager identifies high-growth small-cap stocks before they are included in an index, active portfolios may outperform. Meanwhile, index ETFs will only benefit once the stock becomes large enough to enter the index—by which time much of the growth may already be priced in.
Key understanding:
ETFs are ideal for steady, market-level returns, not for those seeking high, alpha-driven profits.
7. Volatility and Short-Term Fluctuations
ETFs are traded intraday, just like stocks. While this provides flexibility, it also introduces short-term volatility risk.
Risks include:
Sudden price swings during high volatility periods.
Emotional trading decisions due to frequent price visibility.
Potential divergence between ETF price and actual NAV.
Example:
During sharp market corrections, ETFs can trade temporarily below their NAV as panic selling sets in—known as price dislocation. Investors who sell at such times may lock in unnecessary losses.
8. Management and Operational Risk
Despite being “passive,” ETFs are not fully automated. They require management oversight, creation and redemption processes, and operational execution.
Any failure in these processes can harm investors.
Risks include:
Error in replication: Wrong index tracking or delayed rebalancing.
System failures: Trading halts or delayed settlements.
Custodian issues: Safekeeping errors in underlying assets.
Example:
If a fund fails to rebalance after an index change (say, replacing a stock in the Nifty 50), the ETF may not accurately reflect index performance, leading to return mismatches.
9. Currency Risk in International ETFs
When investors buy international or global ETFs (such as U.S. ETFs listed in India), currency fluctuations can significantly affect returns.
Example:
If an Indian investor buys an S&P 500 ETF and the U.S. dollar weakens against the Indian rupee, the investor’s return in INR terms will decline—even if the S&P 500 index itself rises.
Key takeaway:
Investors must consider currency hedging strategies or accept that forex volatility can amplify or reduce total returns.
10. Taxation Complexity
ETF taxation depends on the asset class—equity or debt—and the jurisdiction of the fund.
Investors often underestimate how tax treatment can affect net returns.
Example (India):
Equity ETFs: Short-term capital gains (STCG) taxed at 15%, long-term at 10% (beyond ₹1 lakh).
Debt ETFs: Taxed at slab rates, with no indexation benefit after 2023 tax law changes.
This can make debt-based ETFs less tax-efficient, particularly for short-term investors.
Lesson:
Taxation is not always straightforward, especially with international ETFs that may also face withholding taxes on dividends.
11. The Illusion of Safety and Simplicity
Many investors treat ETFs as inherently “safe” because they represent diversified indices. However, ETFs can carry hidden risks, such as:
Exposure to overheated sectors.
Dependence on market sentiment.
Herd behavior leading to bubbles.
Example:
During 2021–2022, heavy inflows into technology ETFs led to inflated valuations in the NASDAQ. When tech stocks corrected, investors faced double-digit losses despite believing ETFs were low-risk instruments.
12. Structural Risks in Leveraged and Inverse ETFs
Some ETFs use leverage (2x, 3x) or inverse strategies (profit from declines). These products are meant for short-term trading, not long-term investment.
Risks include:
Compounding effect: Over time, leveraged ETFs can diverge significantly from expected returns.
Decay in value: Rebalancing daily magnifies losses in volatile markets.
Example:
A 2x leveraged ETF on the NASDAQ might gain 20% if the index rises 10% in a day. But if the index falls 10% the next day, the ETF’s loss will exceed 20%, leading to long-term erosion even if the index later recovers.
13. Systemic and Contagion Risks
ETFs have grown to represent a large portion of total market capitalization globally. Some analysts worry that ETFs could amplify systemic risks during market stress.
How it happens:
Heavy ETF redemptions can trigger mass selling of underlying assets.
Algorithmic rebalancing can worsen volatility.
Liquidity mismatches between ETFs and underlying securities can lead to market distortions.
Example:
During the March 2020 market panic, corporate bond ETFs traded at steep discounts to their NAVs, highlighting liquidity mismatches and systemic vulnerabilities.
14. Behavioral Risks: Investor Misuse
One of the less-discussed limitations of ETFs is not structural—but behavioral. Many retail investors use ETFs incorrectly:
Overtrading due to intraday availability.
Chasing momentum during bull runs.
Ignoring long-term compounding benefits by switching ETFs frequently.
Example:
An investor repeatedly switching between sectoral ETFs (banking, IT, pharma) based on short-term news may end up losing more to timing errors than they gain from diversification.
15. Regulatory and Structural Limitations
ETFs operate under specific market regulations. Sudden rule changes or restrictions can impact trading or returns.
Examples include:
Restrictions on foreign ETFs or limits on overseas investment by Indian investors.
Changes in capital gain taxation.
Trading halts due to market circuit breakers.
Such regulatory interventions, while rare, can disrupt ETF trading or temporarily distort pricing.
16. Over-Diversification and Diluted Returns
While diversification reduces risk, too much diversification can dilute returns. Index ETFs often hold hundreds of stocks, many of which contribute little to performance.
Example:
In a broad global ETF tracking 1,000+ companies, top performers’ impact gets diluted by hundreds of underperforming or stagnant ones—resulting in “average” returns.
Conclusion:
Diversification helps stability, but excessive breadth can limit meaningful gains.
Conclusion: Balancing Opportunity with Awareness
ETFs and index trading have democratized investing, providing easy access to global markets, diversified exposure, and transparent pricing. Yet, investors must remember that “simple does not mean risk-free.”
From market and tracking errors to liquidity, counterparty, and behavioral risks, each factor can impact returns differently depending on market conditions and investor behavior.
The key to success in ETF and index investing lies in understanding these risks and managing them wisely:
Choose ETFs with high liquidity and low tracking error.
Diversify across asset classes and regions—not just within one index.
Avoid leveraged or complex ETFs unless you understand their mechanics.
Stay disciplined—ETFs reward long-term consistency, not short-term speculation.
In short, ETFs and index trading are powerful tools—but like any tool, they require knowledge, caution, and strategy to use effectively.
Investors who respect these limitations and plan accordingly can enjoy stable, sustainable returns while minimizing unnecessary risks.
Historical Perspective: Previous Commodity Supercycles and Their1. Understanding the Concept of Commodity Supercycles
Before diving into history, it’s important to define what a commodity supercycle is. Unlike short-term price spikes caused by supply disruptions or speculative behavior, supercycles are long-duration upward trends in commodity prices — typically lasting 20 to 30 years — driven by massive structural demand changes.
These cycles reflect the interplay between:
Industrial demand (from large-scale urbanization and industrial growth)
Supply constraints (due to underinvestment in production)
Global economic transitions (such as post-war reconstruction or technological revolutions)
During the upward phase, rapid industrialization boosts demand for raw materials like oil, copper, steel, and agricultural goods. As prices rise, producers expand capacity — often overshooting — which eventually leads to a long-term correction and a downcycle.
2. The 19th Century: The First Modern Commodity Supercycle (1815–1873)
The earliest known commodity supercycle occurred during the Industrial Revolution of the 19th century. Following the Napoleonic Wars (1803–1815), Europe entered a period of peace and rapid industrial expansion, setting the stage for the first global surge in commodity demand.
Key Triggers:
Industrialization in Britain and Western Europe:
Britain’s industrial revolution accelerated demand for coal, iron, and steel. The invention of the steam engine and expansion of railways required massive quantities of these resources.
Urbanization and Infrastructure Development:
Rapid urban growth and the construction of factories, bridges, and transportation networks fueled consumption of metals, timber, and coal.
Global Trade Expansion:
The 19th century saw an unprecedented globalization of trade, driven by colonial expansion and improvements in shipping technology. This increased both the supply and the reach of commodities.
Outcome:
From the 1820s to the 1860s, prices for key commodities such as iron, copper, and coal rose sharply. However, the cycle ended around 1873, coinciding with the Long Depression, as supply caught up with demand and economic growth slowed. Nonetheless, this period laid the foundation for modern industrial economies and global commodity markets.
3. The Early 20th Century Supercycle (1899–1939)
The next significant supercycle unfolded between 1899 and 1939, overlapping with major historical events — including World War I, the Great Depression, and the early stages of the Second Industrial Revolution.
Key Triggers:
Technological Innovations and the Second Industrial Revolution:
Advances in electricity, the internal combustion engine, and chemical manufacturing spurred enormous demand for copper (for wiring), oil (for engines), and steel (for infrastructure and weapons).
Global Urbanization and the Automobile Era:
The rise of automobiles created a new and massive demand for oil and rubber. Countries like the U.S. became both producers and consumers of these resources at unprecedented scales.
World War I (1914–1918):
The war generated extreme demand for metals, food, and energy. Governments mobilized vast industrial capacity to supply military needs, creating temporary price booms.
Post-War Reconstruction:
After the war, Europe required significant rebuilding, further pushing up commodity prices in the early 1920s.
Outcome:
The 1920s witnessed strong commodity prices, but the Great Depression (1929–1939) brought the supercycle to a crashing halt. Overproduction, financial instability, and protectionist policies caused global trade to collapse, sending prices plummeting. This cycle demonstrated how financial crises and overcapacity could abruptly end periods of prosperity.
4. The Post-World War II Supercycle (1946–1973)
After the devastation of World War II, the world embarked on a massive phase of reconstruction and modernization, which fueled one of the most well-documented commodity supercycles.
Key Triggers:
Post-War Reconstruction (Marshall Plan):
Europe and Japan undertook extensive rebuilding efforts financed by the United States through the Marshall Plan (1948–1952). This drove global demand for steel, cement, copper, and machinery.
The Rise of Consumer Economies:
The mid-20th century saw the emergence of middle-class consumption in Western economies. Automobiles, housing, and appliances required vast amounts of raw materials and energy.
Decolonization and Global Integration:
Newly independent nations began industrializing, expanding agricultural and mining activities, and increasing trade participation.
Oil Demand and Energy Expansion:
The oil industry experienced explosive growth during this period. Petroleum became the lifeblood of modern economies, fueling transport, industry, and electricity generation.
Outcome:
This supercycle peaked in the early 1970s, when strong global growth and tight oil supply culminated in the 1973 Oil Crisis. The OPEC oil embargo sent prices skyrocketing, marking both the climax and the collapse of the post-war boom. The subsequent stagflation of the late 1970s and early 1980s signaled the end of this cycle. Yet, it transformed the global energy landscape and established oil as the most strategically vital commodity.
5. The 2000s Supercycle: The China-Led Boom (2000–2014)
The most recent and perhaps most influential supercycle in modern memory began around 2000 and lasted until roughly 2014. It was primarily driven by the rapid industrialization and urbanization of China, along with strong growth across emerging markets.
Key Triggers:
China’s Industrial Expansion:
China’s entry into the World Trade Organization (WTO) in 2001 catalyzed a historic wave of manufacturing and infrastructure investment. The country became the world’s largest consumer of steel, copper, coal, and cement.
Urbanization Across Emerging Economies:
Beyond China, countries like India, Brazil, and Indonesia experienced rising urbanization, boosting demand for construction materials and energy.
Financialization of Commodities:
The early 2000s saw increased investor participation in commodity markets through ETFs and futures. Commodities became a mainstream asset class, amplifying price movements.
Energy Demand and the Rise of Oil Prices:
Oil prices surged from around $20 per barrel in 2000 to over $140 per barrel in 2008, driven by strong global demand and geopolitical tensions in the Middle East.
Underinvestment in Supply:
The previous two decades of low commodity prices had discouraged exploration and investment. When demand spiked, supply was unable to keep pace, intensifying the price surge.
Outcome:
The 2008 Global Financial Crisis temporarily interrupted the supercycle, but prices rebounded quickly due to China’s massive stimulus package and infrastructure spending. However, by 2014, oversupply — especially in oil and metals — combined with slowing Chinese growth, ended the cycle. This period reshaped the global commodity market, making China the central player in global demand dynamics.
6. Common Triggers and Patterns Across Supercycles
While each supercycle is unique, historical analysis reveals recurring themes and triggers:
Industrialization and Urbanization:
Every major supercycle coincided with rapid industrial expansion — whether in 19th-century Europe, post-war America, or 21st-century China.
Technological Transformation:
Breakthroughs like steam power, electricity, and automobiles dramatically shifted commodity usage and demand profiles.
Demographic and Economic Expansion:
Population growth and income rises fuel demand for housing, transport, and consumer goods — all resource-intensive sectors.
Supply Lag and Investment Cycles:
Commodity supply responds slowly due to long project lead times in mining, energy, and agriculture. This delay amplifies the effects of demand surges.
Geopolitical and Military Events:
Wars, embargoes, and trade disruptions often accelerate price booms by constraining supply and increasing uncertainty.
Financialization and Speculation:
In modern times, increased participation by institutional investors has made commodity markets more sensitive to financial sentiment.
7. Lessons from Historical Supercycles
A. The Role of Structural Demand Shifts
Sustained demand growth — not temporary shocks — is essential for a true supercycle. Industrial revolutions and global reconstruction phases have consistently been the key demand drivers.
B. The Danger of Overinvestment
Each boom phase has historically been followed by a glut as producers overexpand capacity. This overinvestment eventually depresses prices and leads to prolonged downturns.
C. The Importance of Policy and Global Coordination
Government policy, trade agreements, and geopolitical stability can either extend or shorten a supercycle. For example, the Bretton Woods system and post-war cooperation helped sustain the 1950s–1970s boom.
D. The Cyclical Nature of Commodities
Despite new technologies and financial instruments, the commodity market remains inherently cyclical. Prices eventually revert as supply catches up and demand matures.
8. Could We Be Entering a New Supercycle?
Many analysts argue that the 2020s could mark the beginning of a new commodity supercycle, driven by factors reminiscent of past booms but adapted to modern realities:
Green Energy Transition: Demand for lithium, copper, nickel, and rare earth elements is soaring due to renewable energy technologies and electric vehicles.
Infrastructure Stimulus: Governments worldwide are investing heavily in post-pandemic recovery and infrastructure modernization.
Supply Constraints: Years of underinvestment in mining and oil exploration could limit supply just as demand accelerates.
Geopolitical Realignments: Conflicts, trade tensions, and resource nationalism are reshaping supply chains and commodity flows.
If history is a guide, the combination of these structural forces suggests that another long-term uptrend in commodities may be emerging — though, as always, the balance between supply and demand will ultimately determine its longevity.
Conclusion
The history of commodity supercycles is, in essence, the story of human progress — from steam engines to skyscrapers, from oil booms to electric revolutions. Each supercycle reflects a period when global society undergoes transformative change, demanding vast quantities of raw materials to fuel development.
From the 19th-century Industrial Revolution to the China-led boom of the early 21st century, the triggers have remained consistent: industrial growth, technological innovation, and demographic expansion. Yet, each cycle has also taught hard lessons about overproduction, economic imbalance, and the limits of natural resources.
As the world moves toward a low-carbon, technology-driven future, the next supercycle may look very different — centered around green commodities and sustainable growth — but it will still be governed by the same fundamental forces that have shaped markets for over two centuries.
The Booming Era of the Trading Market1. The Evolution of Trading: From Open Outcry to Algorithmic Intelligence
The trading market has evolved far beyond its traditional roots. A few decades ago, stock trading primarily occurred in noisy exchange floors where traders used hand signals and shouted bids and offers — the famous “open outcry” system. Today, most of the trading volume globally is executed electronically within milliseconds.
Digital transformation has been the key catalyst. With the introduction of online brokerage platforms in the early 2000s and the integration of high-speed internet, trading became faster, cheaper, and more transparent. Now, with the advent of algorithmic and AI-based trading, markets operate almost continuously with unmatched precision.
Moreover, retail traders — ordinary individuals — have entered the scene in unprecedented numbers. Armed with smartphones, access to real-time data, and social platforms like X (formerly Twitter), YouTube, and Reddit, retail investors are influencing trends once dominated by institutional giants.
This shift marks a true democratization of financial markets, setting the foundation for this booming era.
2. The Expansion of Global Participation
One of the defining traits of today’s trading boom is the global participation in markets. Millions of new investors from India, Southeast Asia, Africa, and Latin America have joined global financial systems.
For instance, India’s stock market participation has witnessed an explosion in the last five years — with Demat accounts surpassing 150 million, and daily trading volumes hitting record highs across exchanges like NSE and BSE. The United States continues to lead in global liquidity, but emerging markets are becoming hotbeds of new capital and innovation.
This participation is driven by a few major factors:
Financial Literacy & Awareness: Global campaigns, social media, and financial influencers have simplified complex trading concepts.
Ease of Access: Mobile-based apps like Zerodha, Robinhood, and eToro have removed barriers to entry.
Low Brokerage Costs: Zero-commission trading has opened doors for small investors.
Global Connectivity: Investors can now trade U.S. stocks from India or crypto assets from anywhere in the world.
This democratization means that the markets are no longer controlled by a few — they reflect the collective psychology of millions of investors worldwide.
3. The Technology Revolution: AI, Blockchain, and Beyond
Technology is the engine that drives the modern trading market. Over the past decade, artificial intelligence (AI) and machine learning (ML) have fundamentally changed how trades are executed, analyzed, and managed.
AI-powered systems can now scan market data, detect hidden patterns, and predict short-term movements far faster than human traders. These tools have increased efficiency, liquidity, and accuracy — but they’ve also created new challenges in terms of volatility and fairness.
Simultaneously, blockchain technology has introduced decentralized trading — most notably through cryptocurrencies and tokenized assets. Decentralized exchanges (DEXs) like Uniswap and PancakeSwap allow peer-to-peer trading without intermediaries, reflecting a shift toward transparent, open systems.
Automation, cloud computing, and real-time analytics have made it possible for retail traders to use advanced tools once reserved for hedge funds. As a result, today’s markets are more interconnected, data-driven, and intelligent than ever before.
4. The Rise of Retail Investors
Perhaps no force has been as transformative in this boom as the rise of retail investors. The pandemic years (2020–2022) served as a turning point — when millions of individuals began trading from home, often encouraged by stimulus measures, social media discussions, and free time during lockdowns.
Retail traders now account for a significant share of daily trading volume in markets like India, the U.S., and China. Platforms like Zerodha, Groww, and Upstox in India, and Robinhood in the U.S., have completely changed the investment landscape.
Retail investors’ growing influence has made markets more sentiment-driven, leading to rapid movements around trending stocks, meme stocks, and thematic investments like EVs, renewable energy, and AI-driven companies.
This retail revolution has reshaped market psychology — adding new layers of momentum, emotion, and community-driven trading.
5. The Rise of Alternative Assets
Another hallmark of the booming trading era is the diversification of investment instruments. Beyond equities, traders now have access to derivatives, commodities, forex, ETFs, mutual funds, cryptocurrencies, and even tokenized real estate.
These diverse instruments have broadened both risk and opportunity:
Cryptocurrencies: Digital assets like Bitcoin and Ethereum have become global trading instruments, influencing investor sentiment and institutional strategy alike.
Commodities: The post-pandemic period has revived interest in gold, oil, and agricultural products as inflation hedges.
Derivatives and Options: Retail interest in options and futures has surged due to the potential for quick profits and hedging flexibility.
Exchange-Traded Funds (ETFs): ETFs have made it easier for retail investors to access diversified portfolios with a single click.
This diversification has made markets more resilient but also more interconnected — meaning that movements in one segment (say crypto) can ripple through global equities or commodities.
6. The Policy and Regulatory Environment
A booming trading market also depends on a strong regulatory foundation. Governments and central banks have taken crucial steps to stabilize markets and encourage participation, especially after crises like the 2008 financial meltdown and the COVID-19 shock.
Regulators such as the SEBI (India), SEC (U.S.), and ESMA (Europe) are actively implementing frameworks for investor protection, transparency, and fair market practices. Meanwhile, new policies on digital assets, ESG investing, and data security are shaping the future of financial ecosystems.
At the same time, monetary policies — including low-interest environments and liquidity infusions — have historically fueled market expansions. However, as inflation and rate hikes reemerge, markets are learning to balance growth with caution.
The ability of policymakers to maintain equilibrium between innovation and regulation will determine how sustainable this boom truly is.
7. The Impact of Globalization and Interconnected Economies
In the 21st century, no market exists in isolation. Events in one part of the world — a rate hike in the U.S., a geopolitical tension in the Middle East, or a policy shift in China — can ripple instantly across continents.
This interconnectedness has turned global markets into a web of opportunity and risk. For traders, this means constant vigilance, as currencies, commodities, and equity indices now move in tandem more than ever.
Global trade agreements, digital payment systems, and cross-border platforms are strengthening this integration further. The result is a world where capital moves freely, and traders can access opportunities that were once geographically limited.
8. Behavioral Shifts: From Long-Term Investing to Active Trading
Investor behavior has evolved dramatically in the booming trading era. Earlier generations preferred long-term investing — holding blue-chip stocks or mutual funds for decades. Today’s traders are far more active, agile, and data-driven.
With real-time price updates, social media-driven narratives, and algorithmic strategies, short-term trading has gained immense popularity. Swing trading, scalping, and intraday strategies now dominate daily volumes.
This shift reflects a generational change — where financial markets are viewed not just as wealth creators but as dynamic ecosystems for daily income, learning, and community participation.
However, this hyperactive behavior also increases exposure to volatility and emotional decision-making — making education and discipline more vital than ever.
9. Emerging Markets: The Next Growth Frontier
Emerging markets, especially in Asia and Africa, are leading this trading revolution. India, in particular, has become one of the fastest-growing equity markets globally, with record-breaking IPOs, SME listings, and FII inflows.
Countries like Vietnam, Indonesia, and Nigeria are also seeing surges in retail participation and fintech innovation. As domestic consumption rises and economies digitalize, local capital markets are set to play a larger role in global wealth creation.
This regional diversification ensures that the trading boom is not limited to Wall Street or London, but is instead becoming a truly global phenomenon.
10. Challenges and Risks in the Booming Market
Despite the optimism, the booming era of trading is not without challenges. The very factors driving growth — speed, technology, and retail participation — also introduce new risks.
Key concerns include:
Volatility: Rapid movements can lead to flash crashes or panic-driven selloffs.
Speculation: Over-leveraged traders often face severe losses.
Cybersecurity: As more trading shifts online, data breaches and scams rise.
Regulatory Gaps: Fast innovation sometimes outpaces regulation, especially in crypto and AI trading.
The sustainability of the boom depends on balancing enthusiasm with prudence — ensuring that innovation does not lead to instability.
11. The Future Outlook: Intelligent, Inclusive, and Sustainable
Looking ahead, the trading market’s next chapter will likely be defined by intelligence, inclusion, and sustainability.
Intelligent Trading: AI, predictive analytics, and quantum computing will refine strategies and risk management.
Inclusive Growth: Financial inclusion will deepen as more people gain access to low-cost trading and investment tools.
Sustainable Finance: ESG investing, green bonds, and socially responsible portfolios will shape investor preferences.
Markets will increasingly reflect not only financial goals but also societal and environmental consciousness. As technology advances and access broadens, the line between traditional investing and modern trading will continue to blur.
Conclusion: The Golden Age of Global Trading
The current era marks a golden age of trading — one where technology, innovation, and participation are converging to create limitless possibilities. From Wall Street to Dalal Street, from cryptocurrencies to commodities, markets are more alive and dynamic than ever.
This boom is not merely a product of capital flows; it is a reflection of human ambition, digital transformation, and the universal desire for financial empowerment.
However, sustaining this growth will depend on balance — between innovation and regulation, risk and reward, speed and stability.
If guided wisely, the booming era of trading will not only create wealth but also redefine the global financial landscape for decades to come.

Understanding Reserve Currency and Its Global RoleIntroduction: The Foundation of Global Financial Stability
In the intricate web of international finance, few concepts hold as much influence as the reserve currency. It is the lifeblood of global trade, the benchmark for economic stability, and a powerful symbol of national economic strength. A reserve currency is not merely a means of exchange—it is a cornerstone of global confidence. Countries around the world hold large quantities of certain currencies in their foreign exchange reserves to manage international trade, stabilize their domestic currencies, and meet external obligations.
Today, the U.S. dollar stands as the dominant reserve currency, though history has witnessed transitions—from the British pound sterling’s supremacy during the 19th and early 20th centuries to the dollar’s reign after World War II. However, with the world moving toward a multipolar economic system and technological innovations such as digital currencies reshaping finance, the concept and dominance of reserve currencies are being re-examined.
What Is a Reserve Currency?
A reserve currency is a foreign currency held by central banks and major financial institutions as part of their foreign exchange reserves. It is used to settle international transactions, influence exchange rates, and maintain financial stability. When a nation imports goods or services, settles debt, or intervenes in the forex market, it often uses a globally accepted currency like the U.S. dollar or the euro.
In simpler terms, it’s the currency other countries trust enough to use for global trade and as a store of value. A reserve currency must be stable, liquid (easy to buy and sell), and backed by a strong and credible economy.
Key examples of reserve currencies today include:
U.S. Dollar (USD)
Euro (EUR)
Japanese Yen (JPY)
British Pound Sterling (GBP)
Chinese Yuan (CNY) (gradually increasing in share)
Historical Evolution of Reserve Currencies
The evolution of reserve currencies mirrors global power shifts:
The British Pound Era (19th Century to Early 20th Century):
During the 1800s, the British Empire was at the height of its global influence. The pound sterling, backed by the gold standard and the vast colonial trade network, became the world’s primary reserve currency. It was trusted for its convertibility and Britain’s robust financial system.
The U.S. Dollar Ascendancy (Post-World War II):
After World War II, the Bretton Woods Agreement (1944) established the U.S. dollar as the central pillar of the global monetary system. The dollar was pegged to gold, and other currencies were pegged to the dollar. The U.S. economy’s post-war strength and stability made the dollar the most reliable global asset.
The End of the Gold Standard (1971):
In 1971, President Richard Nixon ended the dollar’s convertibility into gold—creating the modern fiat currency system. Despite this, the dollar maintained its dominance due to the size of the U.S. economy, military power, and the global acceptance of dollar-denominated assets such as U.S. Treasury bonds.
Emerging Competition (21st Century):
Over the past two decades, the euro and Chinese yuan have made gradual gains. However, no currency has yet displaced the dollar’s dominance, which remains unmatched in terms of global liquidity, trust, and network effects.
Why Reserve Currencies Matter
A reserve currency serves multiple purposes in global economics:
Facilitating International Trade:
Global trade is mostly conducted in reserve currencies. For instance, commodities like oil and gold are priced in U.S. dollars. This common currency standard simplifies transactions between countries and reduces exchange rate risk.
Store of Value for Central Banks:
Central banks hold reserve currencies to safeguard their economies from volatility. These reserves act as a financial cushion during crises—allowing countries to stabilize their currencies or pay for imports when domestic conditions are unstable.
Debt and Investment:
Governments and corporations issue bonds in reserve currencies, attracting global investors. This access to global capital reduces borrowing costs for countries whose currencies are considered stable.
Influence and Power Projection:
The nation issuing a reserve currency gains significant geopolitical leverage. The U.S., for example, can impose financial sanctions effectively because global trade and finance depend on dollar transactions.
The U.S. Dollar: The Reigning Reserve Currency
As of 2025, the U.S. dollar accounts for roughly 58–60% of global foreign exchange reserves, according to the International Monetary Fund (IMF). This dominance stems from several key factors:
Economic Strength:
The United States has the world’s largest economy, making the dollar a natural choice for trade and investment.
Deep and Liquid Financial Markets:
U.S. Treasury bonds are considered among the safest and most liquid assets in the world. Central banks and investors can buy and sell them easily, which increases confidence in the dollar.
Network Effect:
The more widely the dollar is used, the more attractive it becomes. This creates a self-reinforcing cycle that cements its dominance.
Military and Political Stability:
The U.S. government’s stability and global influence enhance trust in its currency, even in times of global uncertainty.
However, this dominance is not without challenges. The dollar’s centrality means that U.S. monetary policy—such as interest rate changes by the Federal Reserve—has global ripple effects, impacting borrowing costs, inflation, and trade balances worldwide.
The Euro and Other Contenders
The euro, introduced in 1999, was designed to rival the dollar’s supremacy. It represents a large economic bloc with a strong regulatory framework and deep capital markets. However, internal divisions among European Union members and debt crises in the region have limited its rise.
The Japanese yen and British pound remain important but secondary reserve currencies. Meanwhile, the Chinese yuan (renminbi) is gradually growing in use—thanks to China’s massive trade network and initiatives like the Belt and Road Initiative and the Asian Infrastructure Investment Bank (AIIB).
However, the yuan’s international acceptance is still constrained by capital controls, lack of full convertibility, and limited transparency in China’s financial markets.
Benefits for a Reserve Currency Issuing Nation
Holding the world’s reserve currency provides significant advantages to the issuing country:
Lower Borrowing Costs:
Global demand for U.S. Treasury securities allows the U.S. government to borrow at lower interest rates.
Trade Advantages:
The U.S. can purchase imports using its own currency, essentially creating demand for its dollars without needing foreign reserves.
Geopolitical Power:
The ability to impose sanctions, freeze assets, or cut off nations from the global dollar-based system gives the U.S. extraordinary influence in international affairs.
Financial Stability:
During crises, global investors often seek safety in dollar assets, reinforcing the U.S. financial system’s resilience.
Challenges and Criticisms of Reserve Currency Dominance
While being a reserve currency issuer has benefits, it also brings challenges:
The Triffin Dilemma:
Economist Robert Triffin highlighted that to supply the world with dollars, the U.S. must run trade deficits—exporting more dollars than it imports. However, persistent deficits can undermine confidence in the dollar’s long-term value.
Global Dependence on U.S. Policy:
When the Federal Reserve raises interest rates, capital often flows from emerging markets to the U.S., causing volatility and currency depreciation in those countries.
Weaponization of Finance:
The U.S. has increasingly used its control over the dollar-based system for sanctions. While effective politically, this has prompted other nations to seek alternative payment systems.
Emerging De-Dollarization Efforts:
Countries like China, Russia, and members of BRICS are actively exploring ways to reduce dependence on the U.S. dollar—such as bilateral trade in local currencies or creating shared digital currency systems.
The Rise of “De-Dollarization”
“De-dollarization” refers to the global movement to reduce reliance on the U.S. dollar for trade, finance, and reserves. This trend gained momentum after the U.S. imposed sweeping sanctions on Russia in 2022, freezing its dollar assets. In response, several nations began exploring alternative systems.
China and Russia have increased trade settlements in yuan and rubles.
India has initiated rupee-based trade mechanisms with select partners.
BRICS countries are discussing a potential common currency for trade and investment.
While these moves indicate gradual diversification, replacing the dollar entirely remains highly challenging due to its entrenched role in global finance and the lack of a fully equivalent alternative.
Digital Currencies and the Future of Reserve Systems
The next chapter in global currency evolution may be shaped by digital innovation. Central Bank Digital Currencies (CBDCs)—such as China’s Digital Yuan (e-CNY) and the potential Digital Euro—are being explored as tools for more efficient cross-border settlements.
These digital versions of national currencies could challenge traditional reserve systems by enabling direct international payments without intermediaries like SWIFT. If widely adopted, they could gradually reduce the dominance of traditional reserve currencies.
However, for digital currencies to serve as global reserves, they must ensure stability, convertibility, and global trust—conditions that currently remain under development.
A Multipolar Reserve Currency World
The global economy is slowly moving toward multipolarity, where several currencies share reserve roles instead of one dominant currency. This could enhance global stability by reducing overreliance on a single nation’s policies.
In such a system:
The U.S. dollar may remain dominant but with reduced share.
The euro and yuan could gain influence in regional trade.
Digital and commodity-backed currencies may emerge as alternative reserves.
However, such a transition would require decades of trust-building, regulatory cooperation, and geopolitical stability.
Conclusion: The Future of Global Monetary Balance
The concept of a reserve currency lies at the heart of global financial order. From the pound sterling’s imperial dominance to the U.S. dollar’s current reign, it has always reflected economic might, trust, and political influence.
Today, as globalization deepens and digital transformation accelerates, the future of reserve currencies may evolve beyond traditional boundaries. While the dollar’s supremacy remains intact for now, the push toward diversification, regional alternatives, and digital finance signals the dawn of a more balanced, interconnected, and resilient global monetary system.
The coming decades may not witness the fall of the dollar—but rather the rise of a more pluralistic reserve world, where power is shared, trust is distributed, and financial sovereignty becomes more evenly spread across nations.

Understanding Currency Derivatives: The Basics ExplainedIntroduction: The Global Dance of Currencies
In today’s interconnected world, where goods, services, and capital flow across borders in milliseconds, currencies have become the lifeblood of global commerce. Yet, the value of currencies doesn’t stand still — it moves constantly due to economic events, interest rate decisions, inflation data, and geopolitical developments.
For multinational corporations, importers, exporters, investors, and even governments, this constant movement brings both opportunity and risk. A small change in exchange rates can dramatically affect profits, pricing, and competitiveness. To manage this uncertainty, financial markets offer powerful instruments known as currency derivatives — contracts whose value is derived from underlying currencies or currency pairs.
Currency derivatives allow market participants to hedge against currency risk, speculate on currency movements, or even arbitrage price differences between markets. Whether you’re a trader on Dalal Street or a treasurer at an export company, understanding currency derivatives is essential for navigating the modern financial ecosystem.
1. What Are Currency Derivatives?
A currency derivative is a financial contract whose value depends on the exchange rate of one currency relative to another.
For instance, if you agree to buy US dollars (USD) against Indian rupees (INR) at a future date, the value of that contract will rise or fall depending on how the USD/INR exchange rate moves.
In simpler terms:
Currency derivatives are tools used to lock in, speculate on, or manage exposure to future movements in foreign exchange rates.
They are widely used in foreign exchange markets (Forex), which are among the largest and most liquid markets in the world — with over $7 trillion traded daily, according to BIS (Bank for International Settlements) data.
2. Why Are Currency Derivatives Needed?
Currency values fluctuate due to a range of factors:
Changes in interest rates
Inflation differentials between countries
Trade balances and current account deficits
Political instability or economic data releases
Central bank policies
These movements can pose serious challenges for:
Exporters, who receive payments in foreign currency but have domestic expenses
Importers, who need to pay foreign suppliers in other currencies
Investors, who hold foreign assets
Travelers or students abroad, who are exposed to exchange rate swings
Let’s take an example:
An Indian exporter signs a deal to sell software to a U.S. company for $1 million, payment due in three months. If the current USD/INR rate is ₹83, the expected receipt is ₹8.3 crore.
But if the rupee strengthens to ₹81 in three months, the exporter would receive only ₹8.1 crore — losing ₹20 lakh due to exchange rate fluctuation.
To avoid such losses, the exporter can enter into a currency derivative contract to lock the exchange rate at ₹83, securing profits and eliminating uncertainty.
3. Types of Currency Derivatives
Currency derivatives come in several forms, each with distinct characteristics, uses, and risk profiles. The four most common types are:
A. Currency Futures
A currency future is a standardized contract traded on an exchange (like NSE or BSE in India) to buy or sell a specific amount of currency at a fixed exchange rate on a specified future date.
Key features:
Traded on regulated exchanges
Standardized contract size (e.g., $1,000 or $10,000 per lot)
Daily mark-to-market settlement
Requires a margin deposit
Example:
An importer expects to pay $100,000 to a U.S. supplier in one month. To hedge against a possible rise in USD/INR, they can buy USD-INR futures. If the dollar strengthens, the profit from the futures position offsets the higher cost of payment.
Advantages: Transparent, regulated, and liquid.
Disadvantages: Less flexible than forwards (due to fixed contract sizes and dates).
B. Currency Forwards
A currency forward is a customized over-the-counter (OTC) contract between two parties to buy or sell a currency at a pre-agreed rate on a specific future date.
Example:
An Indian importer and a bank agree to buy $1 million in 90 days at ₹83.5 per dollar. No money changes hands until the settlement date.
Key characteristics:
Customized contract (amount, date, rate can all be negotiated)
Not traded on exchange (OTC)
Carry counterparty risk (since one party could default)
Advantages: High flexibility and tailored to business needs.
Disadvantages: Lack of transparency and potential credit risk.
C. Currency Options
A currency option gives the holder the right, but not the obligation, to buy or sell a currency at a predetermined exchange rate on or before a specific date.
Types:
Call option: Right to buy a currency.
Put option: Right to sell a currency.
Example:
An exporter can buy a USD-INR put option (right to sell USD) to protect against a falling dollar. If the rupee appreciates, the option’s value increases; if not, the exporter can simply let it expire.
Advantages:
Flexibility — no obligation to exercise.
Limited downside risk (premium paid).
Disadvantages:
Options require upfront premium payment.
D. Currency Swaps
A currency swap involves two parties exchanging principal and interest payments in different currencies.
Example:
An Indian company borrowing in USD but needing INR cash flow can swap its dollar liability for a rupee-based one with another firm.
Purpose:
Manage currency and interest rate exposure
Obtain cheaper financing
Hedge long-term liabilities
Swaps are typically used by large corporations or institutions rather than small traders.
4. How Currency Derivatives Are Traded in India
In India, currency derivatives are actively traded on major exchanges such as:
NSE (National Stock Exchange)
BSE (Bombay Stock Exchange)
MCX-SX (Multi Commodity Exchange – Stock Exchange)
Commonly traded pairs:
USD/INR
EUR/INR
GBP/INR
JPY/INR
Lot sizes: Usually standardized — for example, 1 lot = $1,000 in USD-INR futures.
Trading hours: Typically from 9:00 AM to 5:00 PM (IST).
Participants include:
Hedgers: Exporters, importers, investors, and corporates.
Speculators: Traders betting on currency movements.
Arbitrageurs: Those exploiting price differences between spot and futures markets.
5. The Role of RBI and SEBI
Currency derivatives in India are tightly regulated to maintain market integrity.
RBI (Reserve Bank of India) oversees currency policies, authorized participants, and foreign exchange risk management guidelines.
SEBI (Securities and Exchange Board of India) regulates exchange-traded currency derivatives, ensuring transparency and investor protection.
Key regulations include:
Limits on open positions (to prevent speculation overload)
Margin requirements for traders
Daily price bands to avoid excessive volatility
This ensures a stable, liquid, and transparent marketplace.
6. How Currency Derivatives Help Different Market Participants
A. Exporters and Importers
They use derivatives to hedge currency risk and protect profit margins.
For example, exporters hedge against rupee appreciation, while importers hedge against rupee depreciation.
B. Corporates and Institutions
They manage cross-border financing, loans, and foreign investments through swaps and forwards.
C. Traders and Speculators
They take positions based on expected market movements, profiting from short-term volatility.
D. Arbitrageurs
They exploit pricing discrepancies between spot, forward, and futures markets for risk-free profits.
7. Benefits of Currency Derivatives
Risk Management: Protects against adverse currency movements.
Price Discovery: Futures markets reveal expectations about future exchange rates.
Liquidity: Exchange-traded derivatives offer easy entry and exit.
Leverage: Small margin can control large positions.
Transparency and Regulation: Exchange-traded contracts ensure fair play.
8. Risks and Limitations
While currency derivatives offer many advantages, they also carry risks:
A. Market Risk
Unexpected exchange rate movements can lead to losses, especially for speculative positions.
B. Leverage Risk
Small price changes can cause large gains or losses due to leverage.
C. Counterparty Risk
In OTC contracts, one party may default on obligations.
D. Liquidity Risk
In less-traded pairs or contracts, exiting a position may be difficult.
E. Operational and Regulatory Risk
Complex documentation, errors, or regulatory changes can affect derivative positions.
Thus, derivatives demand sound understanding, discipline, and proper risk controls.
9. Practical Example: Hedging an Importer’s Exposure
Let’s take a practical case:
An Indian importer must pay $500,000 to a U.S. supplier in three months.
Current USD/INR = ₹83.00
Concern: The rupee may depreciate (USD may rise) to ₹85.
Solution:
Importer buys USD-INR futures at ₹83.00.
If USD/INR rises to ₹85:
The importer pays more rupees in the spot market.
But gains ₹2 per dollar on the futures position → ₹10 lakh profit.
This offsets the extra rupee cost — a perfect hedge.
10. Global Perspective on Currency Derivatives
Globally, currency derivatives play a massive role in financial markets. The Chicago Mercantile Exchange (CME), Euronext, and Singapore Exchange (SGX) are major platforms.
Emerging markets like India have also witnessed strong growth due to increasing foreign trade, global investment flows, and the rise of retail participation.
Trends shaping the future:
Digital platforms and algorithmic trading
Blockchain-based settlement systems
Expansion into exotic currency pairs
Greater participation by SMEs and startups for hedging
11. How to Get Started with Currency Derivatives Trading
For individuals or businesses in India:
Open a trading and DEMAT account with a registered broker (enabled for currency segments).
Understand contract specifications (lot size, tick value, expiry date).
Deposit margins as per exchange norms.
Study market fundamentals — interest rates, global data, and central bank actions.
Start small and maintain strict stop-loss levels.
Remember — derivatives amplify both gains and losses. So, use them strategically, primarily for hedging, not uncontrolled speculation.
12. The Future of Currency Derivatives in India
With India’s global trade volumes expanding and the rupee becoming increasingly relevant in international settlements, the currency derivatives market is poised for strong growth.
The RBI’s move to allow rupee-settled trade and internationalization of INR could further deepen the market. Also, the inclusion of more currency pairs and products (like cross-currency options) will provide more flexibility for hedging.
Moreover, with digital adoption and algorithmic tools, even retail traders can now access real-time forex data, execute trades swiftly, and manage risk efficiently.
Conclusion: Empowering Global Financial Stability
Currency derivatives are not just speculative instruments — they are the foundation of global financial stability. They empower businesses to plan better, reduce uncertainty, and maintain profit stability in a volatile world.
Whether you’re an exporter in Mumbai, a fund manager in London, or a trader in Singapore, currency derivatives offer the means to navigate the dynamic world of exchange rates safely and efficiently.
As the world continues to globalize, and India’s role in global trade expands, understanding and effectively using currency derivatives will become not just useful — but essential.
HOW TO TRADE THE LONG TERM TREND BY DRAWING TRENDLINES!Hey Traders so today wanted to make a quick video that explains how to trade the long term trend early. Also when to move your trendline to stay with the market for as long as possible in long term trends.
Hope This Helps Your Trading 😃
Clifford

Understanding Currency Pegs and How Currency Peg Systems WorkIntroduction: The Concept of Currency Pegs
In the global financial system, currency values constantly fluctuate, driven by supply and demand in the foreign exchange (forex) markets. However, not all currencies are allowed to float freely. Some countries choose to stabilize their exchange rate by linking, or “pegging,” their currency’s value to another, often more stable currency such as the U.S. dollar or the euro.
This system—known as a currency peg—acts as an anchor, helping to create economic stability, promote trade, and attract investment.
Currency pegs are particularly common among developing economies or small, trade-dependent nations that rely heavily on imports and exports. They use this mechanism to prevent their currencies from swinging wildly in value, which can otherwise disrupt trade and financial flows.
What Is a Currency Peg?
A currency peg, also called a fixed exchange rate, is a policy where a country’s central bank maintains its currency’s value at a set rate relative to another currency or a basket of currencies.
For instance, if the Saudi riyal is pegged to the U.S. dollar at 3.75 riyals per USD, the Saudi Arabian Monetary Authority (SAMA) must keep the exchange rate near that level by intervening in the currency market.
To do this, the central bank buys or sells its own currency and holds foreign reserves to maintain the peg. In effect, this ties the nation’s monetary policy to the currency it is pegged against.
Types of Currency Peg Systems
Currency pegs can exist in several forms, depending on how strictly the rate is maintained:
1. Hard Peg (Fixed Exchange Rate)
A hard peg means the country’s currency is rigidly fixed to another. The exchange rate remains unchanged for long periods, and the central bank commits to buying or selling its currency at that exact rate.
Example: The Hong Kong dollar has been pegged to the U.S. dollar at around HKD 7.8 per USD since 1983. The Hong Kong Monetary Authority defends this rate by holding substantial foreign reserves.
2. Soft Peg (Adjustable Peg)
A soft peg allows limited flexibility. The currency is pegged to another, but the rate can be adjusted occasionally in response to economic conditions or balance of payments pressures.
Example: China’s yuan was historically pegged to the U.S. dollar but now operates within a managed band, allowing small daily fluctuations.
3. Crawling Peg
A crawling peg adjusts the fixed rate gradually over time, typically to reflect inflation differentials or other economic indicators.
Example: Some Latin American economies have used crawling pegs to devalue their currencies slowly, avoiding sudden shocks.
4. Peg to a Basket of Currencies
Instead of pegging to a single currency, some countries peg to a basket—a weighted average of multiple currencies.
Example: Kuwait pegs its dinar to a basket of major currencies, reducing dependence on any single one like the U.S. dollar.
Why Do Countries Adopt Currency Pegs?
Currency pegs serve as a tool for economic stability and predictability, particularly for nations vulnerable to volatile market forces. Here are the main reasons:
1. Promoting Trade and Investment
Stable exchange rates make international transactions more predictable. Exporters and importers know the exact value of goods in foreign currencies, and foreign investors can calculate returns more confidently. This predictability boosts cross-border trade and long-term investments.
2. Controlling Inflation
Pegging to a stable currency, such as the U.S. dollar, helps control inflation. Many developing nations with histories of hyperinflation use pegs to import monetary discipline. If their domestic currency is tied to the dollar, the local central bank must follow stable monetary policies to maintain the peg.
3. Building Economic Credibility
For smaller economies or those recovering from crises, a peg can signal financial responsibility to international markets. It helps rebuild investor confidence, particularly when domestic institutions are still developing.
4. Supporting Tourism and External Relations
Tourism-based economies, such as those in the Caribbean, often peg their currencies to the U.S. dollar. Since many tourists arrive with U.S. currency, the peg simplifies pricing, billing, and budgeting.
5. Attracting Foreign Capital
A predictable exchange rate reduces currency risk for foreign investors, making it easier to attract foreign direct investment (FDI). Stable pegs encourage long-term capital inflows.
How Currency Peg Systems Work
Maintaining a currency peg requires constant monitoring, intervention, and reserve management by the central bank. Here’s how it operates in practice:
1. Central Bank Intervention
When market forces push the currency value above or below the peg, the central bank intervenes:
If demand for the local currency rises, the bank prints more of it and buys foreign currency (like USD) to weaken its own currency.
If demand for the local currency falls, the bank sells its foreign reserves (USD, euros, etc.) to buy back its own currency, supporting its value.
These operations ensure that the exchange rate remains within the desired range.
2. Maintaining Foreign Exchange Reserves
A country must hold large reserves of the foreign currency it pegs to. These reserves act as ammunition for market interventions.
For example, if a nation pegs to the U.S. dollar, it must have sufficient dollar reserves to buy back its local currency when needed.
3. Adjusting Domestic Monetary Policy
In a pegged system, a country’s monetary policy becomes partially dependent on the foreign currency’s central bank (e.g., the U.S. Federal Reserve). If the Fed raises interest rates, the pegging country might need to follow suit to prevent capital outflows that could destabilize the peg.
4. Managing Balance of Payments
Persistent trade deficits can pressure a peg since more foreign currency leaves the country than enters. The central bank must manage fiscal and trade policies carefully to sustain the balance of payments equilibrium.
Advantages of Currency Pegs
1. Exchange Rate Stability
The most significant advantage is stability. Businesses and consumers can plan without worrying about large currency fluctuations, fostering confidence and long-term contracts.
2. Inflation Control
Pegging to a low-inflation currency imports that stability domestically, helping countries with histories of monetary mismanagement establish discipline.
3. Boosts Investor Confidence
Foreign investors prefer predictable currency environments. A peg reassures them that their investments won’t lose value due to sudden depreciation.
4. Facilitates Trade
When two economies have stable exchange relations, it simplifies cross-border pricing, reduces hedging costs, and promotes smoother transactions.
Disadvantages and Risks of Currency Pegs
While pegs can stabilize economies, they also come with significant constraints and vulnerabilities.
1. Loss of Monetary Policy Independence
A pegged country cannot freely adjust interest rates or money supply to address domestic issues. For example, if inflation rises locally, raising rates might break the peg if the anchor country’s rates remain low.
2. Vulnerability to Speculative Attacks
If traders believe a currency is overvalued or the central bank lacks sufficient reserves, they might short the currency, forcing a devaluation.
Example: The 1997 Asian Financial Crisis began when Thailand’s baht, pegged to the U.S. dollar, came under speculative attack. The central bank eventually abandoned the peg, leading to massive devaluation and contagion across Asia.
3. Reserve Dependency
Maintaining a peg requires holding large foreign reserves, which can strain smaller economies. If reserves run low, the peg becomes unsustainable.
4. Export Competitiveness
If the anchor currency strengthens, the pegged nation’s exports become more expensive globally, reducing competitiveness. For instance, countries pegged to the dollar may face export challenges when the dollar appreciates.
5. Economic Imbalances
Over time, fixed rates can cause trade imbalances if the pegged value doesn’t reflect market realities. This can lead to persistent deficits and unsustainable external borrowing.
Examples of Currency Peg Systems Around the World
1. Hong Kong Dollar (HKD)
Since 1983, Hong Kong has maintained a Linked Exchange Rate System, pegging the HKD at roughly 7.8 per USD. The system has successfully provided stability, especially during regional financial crises.
2. Saudi Riyal (SAR)
Saudi Arabia has pegged the riyal to the U.S. dollar at 3.75 per USD since 1986. This peg supports its oil-based economy, as crude is traded globally in dollars.
3. United Arab Emirates Dirham (AED)
The UAE maintains a peg to the U.S. dollar at 3.6725 per USD, promoting investor confidence and supporting trade and tourism.
4. Chinese Yuan (CNY)
China operated a strict dollar peg until 2005. Now, it follows a managed float against a basket of currencies, reflecting a controlled yet flexible exchange system.
5. Danish Krone (DKK)
Denmark pegs its krone to the euro through the Exchange Rate Mechanism (ERM II), maintaining stability within a narrow band.
When Currency Pegs Fail
Currency pegs can collapse when economic fundamentals diverge too much from the pegged value or when reserves run out.
For example:
Thailand (1997): After heavy speculation and dwindling reserves, Thailand abandoned its dollar peg, triggering the Asian crisis.
Argentina (2001): Argentina’s one-to-one peg to the U.S. dollar collapsed after years of recession and fiscal deficits, leading to a major economic crisis.
When pegs fail, they often do so suddenly, causing sharp currency devaluation, inflation spikes, and loss of investor trust.
Alternatives to Pegged Systems
Not all countries benefit from pegs. Some prefer floating or managed-floating systems that allow market forces to determine the exchange rate:
Free Float: Used by the U.S., Japan, and India, where exchange rates move based on market forces.
Managed Float: Used by China and Singapore, where authorities allow limited flexibility while guiding currency movement within a controlled range.
These systems provide greater policy freedom and reduce the risk of speculative attacks but can introduce volatility.
The Future of Currency Pegs
In today’s globalized economy, currency pegs remain a tool for stability, particularly for smaller or oil-exporting nations. However, digitalization, global capital flows, and geopolitical shifts are challenging traditional peg systems.
Some economists argue that rigid pegs are unsustainable in a world of high-speed capital movement. Others maintain that pegs provide essential stability in uncertain times, especially for nations lacking deep financial markets.
The future likely lies in hybrid systems—managed or crawling pegs that balance stability with flexibility. These allow countries to adjust gradually without losing investor confidence.
Conclusion: Stability Comes at a Cost
Currency pegs are a double-edged sword. On one side, they bring stability, predictability, and confidence—vital for trade-dependent economies. On the other, they limit policy freedom and can create vulnerabilities during global shocks.
A successful peg depends on strong economic fundamentals, ample foreign reserves, and credible monetary management. When maintained responsibly, a currency peg can serve as a stabilizing anchor in the turbulent seas of global finance.
However, when mismanaged or politically motivated, it can turn into a financial trap that magnifies economic crises instead of preventing them.
