Scalping in World Markets1. What is Scalping?
Scalping is a short-term trading style where traders aim to profit from small price fluctuations, typically a few pips in forex, a few cents in stocks, or a few ticks in futures. The average trade duration is extremely short – from a few seconds to a few minutes.
Key characteristics of scalping:
High trade frequency – dozens or even hundreds of trades per day.
Small profit targets – usually 0.1% to 0.5% of price movement.
Tight stop-losses – risk is controlled aggressively.
High leverage usage – to magnify small gains.
Dependence on liquidity and volatility – scalpers thrive in active markets.
2. Scalping in Different World Markets
2.1 Forex Market
The forex market is the most popular for scalping because of its 24/5 availability, tight spreads, and deep liquidity.
Major currency pairs (EUR/USD, GBP/USD, USD/JPY) are preferred for scalping due to minimal spreads.
Forex scalpers often use 1-minute and 5-minute charts to identify quick opportunities.
2.2 Stock Market
Scalping in equities focuses on high-volume stocks like Apple, Tesla, or Amazon.
Traders benefit from intraday volatility and liquidity during opening and closing market hours.
Access to Level 2 order book and Direct Market Access (DMA) is crucial for equity scalpers.
2.3 Futures and Commodities
Futures contracts like S&P 500 E-mini, crude oil, and gold are attractive for scalpers.
Commodity scalping requires understanding of economic reports (EIA crude oil inventory, OPEC meetings).
2.4 Cryptocurrencies
Crypto markets are 24/7, offering endless scalping opportunities.
High volatility and liquidity in coins like Bitcoin and Ethereum make them ideal.
However, high transaction fees and slippage can erode profits.
2.5 Global Indices
Scalpers often trade indices like Dow Jones, FTSE 100, DAX, and Nikkei 225.
Indices react quickly to macroeconomic data, providing fast scalping opportunities.
3. Scalping Strategies in World Markets
3.1 Market Making
Involves placing simultaneous buy and sell orders to profit from the bid-ask spread.
Works best in highly liquid instruments.
3.2 Momentum Scalping
Traders ride micro-trends by entering when momentum surges (e.g., after a breakout).
Useful in fast-moving markets like NASDAQ or forex majors.
3.3 Range Scalping
Scalpers trade within tight support and resistance zones.
Buy near support and sell near resistance repeatedly.
3.4 News-Based Scalping
Focuses on volatility caused by economic releases (CPI, NFP, Fed announcements).
High risk but high reward.
3.5 Algorithmic Scalping
Uses bots to execute trades automatically within milliseconds.
Common in institutional trading with access to co-location servers.
4. Tools and Techniques for Scalping
Trading Platforms – MT4/MT5, NinjaTrader, Thinkorswim, Interactive Brokers.
Charts & Timeframes – 1-minute, 5-minute, tick charts, and order flow charts.
Indicators:
Moving Averages (EMA 9, EMA 21)
Bollinger Bands
RSI (1 or 5 period)
VWAP (Volume Weighted Average Price)
Order Book & Level 2 Data – Helps scalpers see liquidity depth.
Hotkeys & Fast Execution – Essential for entering/exiting trades within seconds.
5. Risk Management in Scalping
Scalping is high-risk due to the large number of trades and leverage. Key risk controls include:
Stop-loss orders – Protect from large losses when price moves unexpectedly.
Position sizing – Never risk more than 1% of account per trade.
Spread & commissions – Monitor closely, as these eat into small profits.
Discipline – Avoid overtrading and revenge trading.
6. Advantages of Scalping
Quick Profits – Immediate feedback from trades.
Less exposure to overnight risk – No swing or position holding.
Works in all market conditions – Volatile, range-bound, or trending.
Compounding effect – Small profits add up across multiple trades.
Psychological satisfaction – For traders who like constant engagement.
7. Challenges of Scalping
High Stress – Requires constant focus and fast decision-making.
Costs – Commissions, spreads, and slippage reduce profitability.
Execution speed – Any delay can wipe out gains.
Broker restrictions – Some brokers prohibit or limit scalping.
Psychological fatigue – Scalping can be mentally exhausting.
8. Psychology of a Scalper
Scalping is not just about technical skills; it demands the right mindset:
Patience and discipline – Avoid chasing trades.
Emotional control – Handle stress and avoid panic decisions.
Consistency – Stick to predefined strategies.
Focus – Ability to concentrate for hours without distraction.
9. Regulations and Global Differences
US Markets: FINRA requires $25,000 minimum for pattern day trading in equities.
European Markets: MiFID II rules on leverage (max 1:30 for retail).
Asian Markets: Japan and Singapore allow high-frequency scalping, but require licensing for institutional scalpers.
Forex Brokers: Some brokers discourage scalping due to server load.
Best Practices for Successful Scalping
Focus on liquid assets.
Keep a trading journal.
Test strategies on demo accounts.
Control emotions and avoid overtrading.
Use technology for execution speed.
Conclusion
Scalping in world markets is one of the most challenging yet rewarding trading approaches. It requires discipline, speed, and precision to consistently extract profits from tiny market movements. While technology and globalization have made scalping more accessible, only traders with the right psychology, tools, and risk management can succeed.
As markets evolve with AI, crypto, and faster infrastructures, scalping will continue to be a dominant force in global trading. For traders who thrive under pressure and enjoy high-frequency engagement, scalping offers unparalleled opportunities – but it demands mastery of both strategy and self-control.
Harmonic Patterns

Carry Trade in the Global Market1. What is a Carry Trade?
A carry trade is a financial strategy where investors:
Borrow or fund positions in a currency with low interest rates (funding currency).
Use those funds to buy a currency or asset with a higher interest rate (target currency or investment).
Earn the difference between the two rates (the interest rate spread), while also being exposed to currency fluctuations.
Example (Simplified):
Suppose the Japanese yen has a 0.1% interest rate, and the Australian dollar (AUD) has a 5% interest rate.
A trader borrows ¥100 million (Japanese yen) at near-zero cost and converts it into AUD.
The funds are invested in Australian bonds yielding 5%.
Annual return ≈ 4.9% (before considering currency fluctuations).
If the AUD appreciates against the yen during this time, the trader earns both the interest rate differential + capital gains. If AUD depreciates, the trade may turn into a loss.
2. The Mechanics of Carry Trade
Carry trade is not as simple as just switching between two currencies. It involves global capital flows, leverage, interest rate cycles, and risk management.
Step-by-Step Process:
Identify funding currency: Typically one with low or negative interest rates (JPY, CHF, or USD in certain cycles).
Borrow or short-sell this currency.
Buy high-yielding currency assets: Such as government bonds, corporate debt, or equities in emerging markets.
Earn interest spread daily (known as the rollover in forex markets).
Monitor exchange rates since even small currency fluctuations can offset interest gains.
Why It Works:
Differences in monetary policies across central banks create yield gaps.
Investors with large capital seek to exploit these spreads.
Global liquidity cycles and risk appetite drive the demand for carry trades.
3. Historical Importance of Carry Trade
Carry trades have been a cornerstone of currency markets, shaping global financial cycles:
1990s – Japanese Yen Carry Trade
Japan maintained near-zero interest rates after its asset bubble burst in the early 1990s.
Investors borrowed cheap yen and invested in higher-yielding assets abroad (Australia, New Zealand, emerging markets).
This caused yen weakness and strong capital inflows into emerging markets.
2000s – Dollar and Euro Carry Trades
Before the 2008 financial crisis, investors borrowed in low-yielding USD and JPY to invest in high-yielding currencies like the Brazilian Real, Turkish Lira, and South African Rand.
Commodity booms amplified returns, making the carry trade highly profitable.
2008 Global Financial Crisis
Carry trades collapsed as risk aversion spiked.
Investors unwound positions, leading to a surge in yen (JPY) and Swiss franc (CHF).
This showed how carry trade unwind can cause global market turbulence.
2010s – Post-Crisis QE Era
Ultra-low rates in the US, Japan, and Europe sustained carry trade strategies.
Emerging markets benefited from capital inflows but became vulnerable to sudden outflows when US Fed hinted at tightening (2013 “Taper Tantrum”).
2020s – Pandemic & Beyond
Global central banks slashed rates during COVID-19, reviving conditions for carry trades.
However, the 2022–23 inflation surge and rate hikes by the Fed created volatility, making carry trades riskier.
4. Global Carry Trade Currencies
Funding Currencies (Low Yield):
Japanese Yen (JPY): Classic funding currency due to decades of near-zero rates.
Swiss Franc (CHF): Safe-haven status and low yields.
Euro (EUR): Used in periods of ECB ultra-loose policy.
US Dollar (USD): At times of near-zero Fed rates.
Target Currencies (High Yield):
Australian Dollar (AUD) & New Zealand Dollar (NZD): Stable economies with higher yields.
Emerging Market Currencies: Brazilian Real (BRL), Turkish Lira (TRY), Indian Rupee (INR), South African Rand (ZAR).
Commodity Exporters: Higher rates often accompany higher commodity cycles.
5. Drivers of Carry Trade Activity
Carry trades thrive when global financial conditions are supportive.
Interest Rate Differentials – Larger gaps = higher carry.
Global Liquidity – Abundant capital seeks higher yields.
Risk Appetite – Investors pursue carry trades in “risk-on” environments.
Monetary Policy Divergence – When one central bank keeps rates low while others tighten.
Volatility Levels – Low volatility encourages carry trades; high volatility kills them.
6. Risks of Carry Trade
Carry trades may look attractive, but they are highly risky.
Currency Risk – A sudden depreciation of the high-yielding currency can wipe out gains.
Interest Rate Shifts – If the funding currency raises rates or target currency cuts rates, the carry spread shrinks.
Liquidity Risk – In crises, traders rush to unwind, leading to sharp reversals.
Geopolitical Risk – Wars, political instability, or sanctions can collapse carry trades.
Leverage Risk – Carry trades are often leveraged, magnifying both profits and losses.
7. The Role of Central Banks
Central banks indirectly shape carry trades through:
Rate setting policies (zero-rate or tightening cycles).
Forward guidance that signals future moves.
Quantitative easing (QE) that floods markets with liquidity.
Capital controls in emerging markets that try to manage inflows/outflows.
8. Case Studies in Carry Trades
The Yen Carry Trade (2000–2007)
Massive inflows into risky assets globally.
Unwinding during 2008 caused yen to spike 30%, triggering global asset sell-offs.
The Turkish Lira (TRY)
High rates attracted carry trades.
But political instability and inflation led to currency crashes, wiping out investors.
Brazil and South Africa
During commodity booms, high-yield currencies like BRL and ZAR became popular targets.
However, they were also prone to volatility from commodity cycles.
9. Carry Trade in Modern Markets
Today, carry trades are more complex and algorithm-driven. Hedge funds, banks, and institutional investors run quantitative carry trade strategies across forex, bonds, and derivatives.
Tools Used:
FX swaps & forwards
Options for hedging
ETFs & leveraged funds tracking carry trade strategies
Example – G10 Carry Index
Some financial institutions track “carry indices” that measure returns from long high-yield currencies and short low-yield currencies.
10. Advantages of Carry Trade
Predictable Income – Earn from interest rate differentials.
Scalability – Works in global FX markets with high liquidity.
Diversification – Access to multiple asset classes.
Potential for Leverage – High returns if managed correctly.
Conclusion
Carry trade is one of the most fascinating and impactful strategies in the global financial system. By exploiting interest rate differentials across countries, it provides traders with a potential source of profit. However, history has shown that the carry trade is a double-edged sword: highly rewarding in stable times, but brutally punishing during crises.
Understanding its mechanics, historical patterns, risks, and modern applications is essential for any trader, investor, or policymaker. The carry trade is more than just a strategy — it is a barometer of global risk appetite, liquidity, and monetary policy divergence.
For those who master it with discipline and risk management, the carry trade remains a powerful tool in navigating global markets.

Spot Forex Trading1. Introduction to Spot Forex Trading
In the world of global finance, foreign exchange (Forex) stands as the largest and most liquid market. With a daily trading volume surpassing $7.5 trillion (as per the Bank for International Settlements), the Forex market dwarfs equities, bonds, and commodities combined. At the very core of this enormous ecosystem lies the spot Forex market, where currencies are exchanged instantly “on the spot.”
Spot Forex trading is not only the foundation of international trade and investments but also the most popular form of retail currency speculation. Unlike forward or futures contracts, the spot market involves a direct exchange of one currency for another at the prevailing market rate, typically settled within two business days. For traders, it is the purest way to participate in currency fluctuations and capitalize on global economic dynamics.
In this guide, we’ll explore the mechanics, strategies, risks, and opportunities of spot Forex trading in depth.
2. What is Forex & How the Spot Market Works?
Forex (FX) is short for foreign exchange – the global marketplace where national currencies are exchanged. Currencies are always traded in pairs (e.g., EUR/USD, USD/JPY, GBP/INR) because one is bought while the other is sold.
The spot Forex market is the part of FX where transactions occur “on the spot” at the current market price (known as the spot rate). While in practice settlement usually occurs within T+2 days (two business days), retail traders through brokers see it as instantaneous execution.
Example:
If EUR/USD = 1.1000, it means 1 Euro = 1.10 US Dollars.
A trader buying EUR/USD expects the Euro to appreciate against the Dollar.
If the pair moves to 1.1200, the trader profits; if it drops to 1.0800, the trader loses.
The beauty of spot Forex lies in its simplicity, liquidity, and accessibility.
3. Key Features of Spot Forex
Decentralized Market – Unlike stocks traded on exchanges, Forex is an OTC (over-the-counter) market. Trading happens electronically via banks, brokers, and liquidity providers.
High Liquidity – The sheer size ensures that major pairs (like EUR/USD) have tight spreads and minimal slippage.
24-Hour Trading – Forex operates 24/5, from the Sydney open (Monday morning) to New York close (Friday evening).
Leverage – Traders can control large positions with small capital, magnifying both profits and losses.
Accessibility – With brokers and trading platforms, retail traders worldwide can access spot Forex with as little as $50.
4. Major Currencies & Currency Pairs
Currencies are categorized into majors, minors, and exotics.
Major Pairs (most traded, high liquidity): EUR/USD, GBP/USD, USD/JPY, USD/CHF, USD/CAD, AUD/USD, NZD/USD.
Cross Pairs (without USD): EUR/GBP, EUR/JPY, GBP/JPY, AUD/JPY.
Exotic Pairs (emerging market currencies): USD/INR, USD/TRY, USD/ZAR.
Most spot Forex volume is concentrated in majors, especially EUR/USD, which alone makes up ~25% of daily turnover.
5. Spot Forex vs. Forwards & Futures
Feature Spot Forex Forward Contracts Futures Contracts
Settlement T+2 days (practically instant for traders) Custom date agreed Standard dates
Trading Venue OTC (banks, brokers) OTC Exchange-traded
Flexibility High High Limited (standardized)
Use Case Speculation, trade settlement Hedging by corporates Hedging & speculation
Spot Forex is more liquid and flexible than forwards and futures, making it the preferred market for short-term traders.
6. Market Participants
The spot Forex market is vast, with multiple players:
Central Banks & Governments – Influence currency supply, demand, and stability.
Commercial Banks – The backbone of FX, providing liquidity and interbank trading.
Corporations – Engage in Forex to settle international trade and hedge risks.
Hedge Funds & Institutional Investors – Speculate with huge volumes, influencing trends.
Retail Traders – Millions of individuals trading through brokers.
Retail trading, though small compared to institutions, has grown rapidly due to online platforms.
7. How Spot Forex Trading is Conducted
Trading Platforms – MetaTrader (MT4/MT5), cTrader, and proprietary broker platforms.
Execution Models:
Market Maker – Broker sets bid/ask spread.
STP/ECN – Orders sent directly to liquidity providers, offering raw spreads.
Pricing – Derived from interbank market quotes.
Spreads & Commissions – Brokers earn via spreads or commissions per trade.
Execution speed, spreads, and broker reputation matter greatly in Forex trading.
8. Leverage & Margin in Spot Forex
One of the most attractive yet dangerous features of spot Forex is leverage.
Example: With 1:100 leverage, a trader can control a $100,000 position with just $1,000 margin.
Margin call occurs if losses reduce equity below required margin.
High leverage allows for big profits but equally big losses—making risk management essential.
9. Factors Influencing Currency Prices
Currencies reflect global macroeconomics. Key drivers:
Interest Rates – Higher rates attract investors (stronger currency).
Inflation – High inflation erodes purchasing power (weaker currency).
Economic Data – GDP, jobs reports, CPI, trade balance.
Political Stability – Elections, wars, policy changes impact FX.
Global Risk Sentiment – “Risk-on” favors emerging markets; “Risk-off” drives money to USD, JPY, CHF.
Central Bank Actions – QE, rate hikes, interventions move currencies massively.
10. Trading Strategies in Spot Forex
Scalping – Very short-term, multiple trades for a few pips profit.
Day Trading – Open/close trades within a day, avoiding overnight risk.
Swing Trading – Holding positions for days/weeks to capture larger moves.
Trend Following – Riding long-term momentum.
Counter-Trend Trading – Betting on reversals at key levels.
Carry Trade – Borrowing in low-interest currency (JPY) to invest in high-yield (AUD, NZD).
Each strategy has its own risk-reward profile and suits different personalities.
Conclusion
Spot Forex trading is a fascinating arena where global economics, politics, and psychology meet. It is the purest and most direct form of currency exchange, providing unmatched liquidity, accessibility, and opportunity. However, with great potential comes great risk—especially due to leverage.
For those who approach it with education, discipline, and risk management, spot Forex can offer immense opportunities. For the unprepared, it can be unforgiving.
In the end, success in Forex isn’t about predicting every move—it’s about managing risk, staying consistent, and playing the probabilities wisely.
Global Index TradingIntroduction
Global financial markets are deeply interconnected. From the bustling streets of New York to the trading floors in Tokyo, stock markets react not just to domestic events but also to global developments. Investors often find it overwhelming to track thousands of individual stocks across different countries. This is where global indices come in.
Global indices—such as the S&P 500, Dow Jones, NASDAQ, FTSE 100, Nikkei 225, Hang Seng, and DAX—act as benchmarks that represent the performance of a basket of leading companies in a region or sector. Instead of focusing on a single stock, traders can participate in the performance of an entire economy, sector, or region by trading indices.
Global index trading has grown rapidly due to its simplicity, diversification benefits, and ability to capture worldwide economic movements. Whether through futures, ETFs, CFDs, or options, traders can speculate or hedge using indices.
This article explores what index trading is, how it works, its strategies, risks, advantages, and future trends, giving you a complete 360° understanding.
What is an Index?
An index is a statistical measure that tracks the performance of a group of assets. In financial markets, stock indices track a basket of company stocks.
For example:
S&P 500 → Tracks 500 largest US-listed companies.
Nikkei 225 → Represents 225 blue-chip companies listed in Japan.
FTSE 100 → Covers 100 top UK companies listed on the London Stock Exchange.
DAX 40 → Represents 40 major German companies.
By trading these indices, investors gain exposure to entire markets instead of picking individual stocks.
Why Trade Global Indices?
Diversification → Instead of betting on one company, you’re trading the collective performance of many.
Global Exposure → Access to markets worldwide (US, Europe, Asia).
Liquidity → Indices are highly traded, ensuring smooth entry and exit.
Transparency → Indices reflect real-time global economic conditions.
Opportunities in Both Directions → Traders can go long (buy) when bullish or short (sell) when bearish.
Hedging Tool → Investors hedge their portfolios against global uncertainties using index futures and options.
Major Global Indices
1. United States
Dow Jones Industrial Average (DJIA) → Tracks 30 blue-chip companies.
S&P 500 → Broadest and most followed US index (500 companies).
NASDAQ Composite → Tech-heavy index with over 3,000 companies.
2. Europe
FTSE 100 (UK) → UK’s top 100 companies.
DAX 40 (Germany) → German giants like BMW, Siemens, Allianz.
CAC 40 (France) → French market benchmark.
3. Asia-Pacific
Nikkei 225 (Japan) → Japan’s premier stock index.
Hang Seng (Hong Kong) → Reflects China’s corporate strength.
Shanghai Composite (China) → Mainland Chinese companies.
ASX 200 (Australia) → Australia’s top companies.
4. Emerging Markets
Nifty 50 (India) → India’s top 50 companies.
Bovespa (Brazil) → Brazil’s leading stock index.
RTS Index (Russia) → Russia’s blue-chip stocks.
These indices act as economic barometers, and traders worldwide monitor them daily.
How Global Index Trading Works
Trading indices isn’t about buying the index itself (since it’s just a number). Instead, traders use financial instruments tied to the index’s value:
Index Futures
Standardized contracts to buy/sell the index at a future date.
Example: S&P 500 futures.
Used by institutional investors for speculation and hedging.
Index Options
Provide the right (not obligation) to buy/sell indices at specific levels.
Useful for hedging against sudden market drops.
Exchange-Traded Funds (ETFs)
Funds that replicate index performance.
Example: SPY (S&P 500 ETF).
Suitable for long-term investors.
Contracts for Difference (CFDs)
Popular in retail trading.
Allow traders to speculate on index price movements without owning underlying assets.
Factors Influencing Global Indices
Index values fluctuate based on:
Economic Data
GDP growth, inflation, employment data.
Corporate Earnings
Quarterly earnings of large companies drive indices.
Central Bank Policies
Interest rate hikes or cuts (Fed, ECB, BOJ).
Geopolitical Events
Wars, trade disputes, elections.
Global Sentiment
Risk-on (bullish) vs. risk-off (bearish) moods.
Currency Movements
Strong/weak currencies affect export-driven companies.
Popular Strategies in Global Index Trading
Trend Following
Identify long-term trends and ride momentum.
Example: Buying NASDAQ during a tech boom.
Swing Trading
Capturing medium-term moves within global index cycles.
Day Trading / Scalping
Taking advantage of small intraday price fluctuations.
Hedging Strategies
Using index futures to protect portfolios during uncertainty.
Pairs Trading
Trade two correlated indices (e.g., long S&P 500 and short FTSE 100).
Arbitrage
Exploiting price inefficiencies between futures, ETFs, and spot indices.
Benefits of Global Index Trading
Simplicity: No need to analyze thousands of individual stocks.
Lower Volatility: Compared to single stocks, indices move more steadily.
Cost Efficiency: ETFs and CFDs allow exposure at low costs.
24-Hour Opportunities: With different time zones, global indices provide nearly round-the-clock trading.
Risks in Global Index Trading
Market Volatility
Events like COVID-19 caused sharp global index crashes.
Leverage Risk
Futures/CFDs use leverage, magnifying losses.
Systemic Risks
Global crises (2008 Financial Crash, 2020 Pandemic) affect all indices simultaneously.
Currency Risk
Non-domestic traders face forex risks.
Overexposure
Heavy index positions without proper diversification may backfire.
Case Studies of Global Index Movements
1. 2008 Global Financial Crisis
US housing bubble burst → Dow Jones & S&P 500 crashed 50%.
Global indices (Nikkei, FTSE, DAX) followed suit.
2. COVID-19 Pandemic (2020)
Panic selling → Dow fell 3,000 points in a day.
Stimulus packages → Strong rebound across all indices.
3. US Tech Boom (2010s)
NASDAQ outperformed due to Apple, Amazon, Google, Microsoft.
Tech indices became global growth drivers.
Tools & Platforms for Index Trading
MetaTrader (MT4/MT5)
Thinkorswim
Interactive Brokers
TradingView (for charting)
Bloomberg & Reuters (for news updates)
Future of Global Index Trading
Increased ETF Popularity → More passive index investments.
AI & Algo Trading → Automated strategies dominating global index flows.
Thematic Indices → ESG, clean energy, tech-focused indices growing.
Crypto Indices → Crypto-linked index trading gaining traction.
24/7 Trading → Expansion of round-the-clock index trading.
Tips for Beginners
Start with major indices (S&P 500, NASDAQ, DAX).
Use demo accounts before live trading.
Avoid over-leverage.
Follow global news & central bank updates.
Combine technical and fundamental analysis.
Conclusion
Global index trading offers a powerful, diversified, and accessible way to participate in financial markets. Instead of picking individual winners, traders can ride the economic waves of entire regions. While opportunities are vast, one must remain cautious of risks like leverage, volatility, and systemic crises.
For long-term investors, global index ETFs provide steady growth aligned with global economic progress. For traders, futures, options, and CFDs open doors to both speculative profits and hedging strategies.
In today’s interconnected world, global index trading is no longer optional—it’s essential for anyone looking to understand and profit from international financial markets.
The Power of Price Action: Reading the Market Without IndicatorsIn the trading world, many traders get caught up in countless technical indicators such as RSI, MACD, and Stochastic… However, at the core of every price movement lies Price Action – the art of reading the market purely through price and volume, without relying heavily on indicators.
1. What is Price Action?
Price Action is the art of analyzing and making trading decisions based on pure price movement. Traders focus on price patterns, market structure, support and resistance levels, and especially candlestick signals, instead of depending on formula-based indicators.
2. Why is Price Action Important?
Primal nature: Price is the most direct information from the market, not lagging like indicators.
Flexibility: Applicable across all markets (Forex, Gold, Stocks, Crypto…).
Simplicity & effectiveness: Helps traders cut out the “noise” from overly complex tools.
3. Core Elements of Price Action
Support and Resistance Zones: Where supply and demand meet, shaping trends.
Market Structure: Uptrend, downtrend, consolidation, or breakout.
Reversal & Continuation Candlestick Patterns: Offering signals for entries and exits.
4. Key Candlestick Patterns
Doji: Reflects indecision, signaling a possible reversal or continuation.
Pin Bar (Long-tailed candlestick): A long wick shows strong rejection, a reliable reversal signal.
Engulfing: A candle that fully engulfs the previous one, demonstrating dominance from buyers or sellers.

Role of Technology in Global Markets 1. Historical Evolution of Technology in Markets
a. Early Communication Systems
In the 1800s, financial markets were largely local. Traders depended on physical meetings or handwritten letters to exchange market information.
The invention of the telegraph (1837) and later the telephone (1876) dramatically reduced the time it took to transmit financial information across cities and countries. For example, stock prices could be sent from New York to London in minutes instead of weeks.
b. Electronic Trading Emergence
The 20th century saw the development of electronic ticker systems, allowing near real-time updates of market prices.
By the 1970s and 1980s, exchanges began experimenting with electronic order-matching systems. NASDAQ, founded in 1971, became the world’s first electronic stock exchange.
c. The Internet Revolution
The 1990s introduced the internet into global markets. Online trading platforms allowed retail investors to directly access markets without relying solely on brokers.
E-commerce platforms like Amazon and Alibaba transformed global consumer markets, while digital communication allowed businesses to operate internationally with ease.
d. 21st-Century Transformations
Today’s markets are dominated by high-frequency trading (HFT), artificial intelligence (AI)-driven strategies, blockchain technologies, cloud computing, and mobile financial services.
Cross-border investing is instantaneous, and global markets operate nearly 24/7 with technology as their backbone.
2. Key Roles of Technology in Global Markets
a. Enhancing Market Efficiency
Technology reduces information asymmetry by providing real-time access to prices, news, and economic data.
Algorithms match buyers and sellers instantly, narrowing bid-ask spreads and improving liquidity.
b. Democratization of Access
Earlier, only wealthy institutions could access sophisticated markets. Now, mobile apps and online brokerages allow small retail investors across the world to trade with minimal costs.
Platforms like Robinhood, Zerodha, and eToro have expanded participation, enabling global capital flows.
c. Speed and Automation
High-frequency trading systems can execute thousands of trades per second, exploiting micro-price differences across exchanges.
Automation has also entered settlement systems. For example, blockchain-based smart contracts can settle cross-border payments instantly, reducing costs and delays.
d. Integration of Global Trade and Supply Chains
Technology supports global commerce through logistics software, digital supply chain management, and e-commerce.
Platforms like Amazon, Alibaba, and Shopify connect producers in one country directly with consumers worldwide.
e. Data and Analytics
Markets today thrive on data. Artificial intelligence and machine learning analyze billions of data points—from satellite images to social media sentiment—to predict economic and financial trends.
Big data tools allow investors and companies to manage risks better, anticipate market shifts, and optimize operations.
f. Financial Innovation
Technology has given rise to new asset classes such as cryptocurrencies, NFTs, and tokenized securities.
Decentralized Finance (DeFi) platforms now allow global lending, borrowing, and investing without intermediaries.
3. The Role of Technology Across Market Segments
a. Stock Markets
Stock exchanges globally, like NYSE, NASDAQ, London Stock Exchange, and NSE India, operate through highly advanced trading platforms.
Investors across the world can place trades in milliseconds, and order books are updated in real-time.
AI-driven portfolio management tools (robo-advisors) help retail investors diversify globally at low costs.
b. Foreign Exchange (Forex) Markets
The forex market is the world’s largest, trading over $7 trillion daily. Technology enables real-time currency trading across time zones.
Electronic Communication Networks (ECNs) match global buyers and sellers, improving liquidity and reducing barriers.
Mobile apps allow individuals to hedge against currency risk or speculate, regardless of location.
c. Commodities and Energy Markets
Technology enables smart logistics, digital commodity trading platforms, and automated hedging strategies.
For oil, metals, and agricultural products, satellite data and IoT devices provide real-time production and supply information, improving transparency.
d. Cryptocurrency and Digital Assets
Blockchain technology has created entirely new forms of global markets.
Bitcoin, Ethereum, and other cryptocurrencies trade on global exchanges accessible 24/7.
DeFi protocols allow people to lend, borrow, and earn interest globally without banks.
e. E-commerce and Consumer Markets
Global consumer markets are dominated by digital platforms. Amazon, Alibaba, Flipkart, and Mercado Libre connect sellers and buyers worldwide.
Payment technologies like PayPal, UPI, and digital wallets facilitate seamless cross-border transactions.
4. Benefits of Technology in Global Markets
Accessibility: Investors and businesses worldwide can participate, regardless of geography.
Efficiency: Faster transactions, lower costs, and transparent processes.
Liquidity: Electronic platforms ensure deep pools of buyers and sellers.
Innovation: Emergence of new asset classes and financial instruments.
Transparency: Real-time reporting and monitoring reduce fraud and insider advantages.
Inclusivity: Small investors and businesses gain entry into markets once dominated by large institutions.
5. Risks and Challenges of Technology in Global Markets
a. Cybersecurity Threats
Global markets face risks of hacking, data breaches, and fraud.
High-profile exchange hacks (like Mt. Gox in 2014) show how vulnerable digital markets can be.
b. Market Volatility
Algorithmic trading sometimes amplifies volatility, as seen in the “Flash Crash” of May 2010 when the Dow dropped nearly 1,000 points within minutes.
c. Digital Divide
While technology democratizes access, millions worldwide remain excluded due to lack of internet, devices, or digital literacy.
d. Regulatory Challenges
Cross-border digital markets are hard to regulate uniformly. For example, cryptocurrency regulations differ drastically between countries, creating uncertainty.
e. Over-Reliance on Technology
System failures, outages, or glitches can halt global trading. For instance, NYSE and NSE India have both faced trading halts due to technical issues.
6. The Future of Technology in Global Markets
a. Artificial Intelligence (AI) and Machine Learning
AI will further automate trading, risk management, and fraud detection.
Predictive analytics will become central to investment decisions.
b. Blockchain and Decentralization
Blockchain has the potential to eliminate intermediaries in global markets, reducing costs and improving efficiency.
Tokenization may allow fractional ownership of real-world assets like real estate and art.
c. Quantum Computing
Quantum technology could revolutionize market modeling, encryption, and trading strategies, offering new levels of computational power.
d. Sustainable and Green Technology
Technology will enable carbon credit markets, renewable energy trading platforms, and ESG-focused investing.
Blockchain can track supply chain sustainability and ethical sourcing.
e. Global Financial Inclusion
Mobile banking and fintech will bring billions of unbanked individuals into the global financial system, especially in developing nations.
7. Case Studies
Robinhood and Gamestop (2021): Showed how technology and social media democratize access but also create risks of market manipulation.
Alibaba Singles’ Day Sales: A showcase of how e-commerce technology creates global consumer demand, with billions in sales in a single day.
Cryptocurrency Boom: Bitcoin’s rise to a trillion-dollar asset class highlights the disruptive role of blockchain in global finance.
Tesla’s Global Supply Chain: Use of AI, automation, and digital logistics to manage global production and delivery networks.
Conclusion
Technology is not just an enabler but the backbone of modern global markets. It drives speed, efficiency, innovation, and inclusivity, ensuring that capital, goods, services, and information flow seamlessly across borders. However, its power also comes with risks—cyber threats, volatility, inequality, and regulatory challenges—that must be managed carefully.
As we look ahead, technology’s role will only deepen, with AI, blockchain, and fintech shaping the next wave of market evolution. The ultimate challenge will be to harness technology’s benefits while creating safeguards that ensure global markets remain fair, stable, and inclusive for all.

Impact of Rising US Treasury Yields on Global EquitiesPart 1: Understanding US Treasury Yields
1.1 What Are US Treasury Yields?
US Treasuries are debt securities issued by the US government to finance its operations. They come in different maturities—short-term bills (up to 1 year), medium-term notes (2–10 years), and long-term bonds (20–30 years). The yield on these securities represents the return an investor earns by holding them until maturity.
Yields move inversely to bond prices. When investors sell Treasuries, prices fall and yields rise. Conversely, when demand is high, yields drop.
1.2 Why Are US Treasuries Called “Risk-Free”?
The US government is considered the safest borrower in the world, backed by its ability to tax and print dollars. Thus, Treasuries are seen as risk-free assets in terms of default. This status makes them the benchmark against which global borrowing costs, equity valuations, and investment decisions are calibrated.
1.3 Drivers of Rising Treasury Yields
US Treasury yields rise due to:
Federal Reserve policy (interest rate hikes, balance sheet reductions).
Inflation expectations (higher inflation erodes bond value, pushing yields up).
Economic growth outlook (strong growth boosts demand for capital, raising yields).
Government borrowing (higher fiscal deficits increase supply of Treasuries, pressuring yields higher).
Part 2: Link Between Treasury Yields and Global Equities
2.1 The Discount Rate Effect
Equity valuations are based on the present value of future cash flows. When Treasury yields rise, the discount rate (the rate used to calculate present value) increases. This reduces the attractiveness of equities, especially growth stocks with earnings expected far into the future.
2.2 Opportunity Cost of Capital
Investors compare expected equity returns with risk-free Treasury yields. If yields rise significantly, the relative appeal of equities declines, causing fund flows to shift from stocks to bonds.
2.3 Cost of Borrowing for Corporates
Higher yields mean higher borrowing costs globally. For companies dependent on debt, rising yields squeeze margins and reduce profitability, pressuring stock prices.
2.4 Risk Sentiment and Volatility
Sharp increases in yields often spark volatility. Equity markets prefer stable interest rates. Sudden upward movements in yields are interpreted as signals of tightening liquidity or higher inflation risks, both of which unsettle investors.
Part 3: Historical Case Studies
3.1 The 2013 “Taper Tantrum”
In 2013, when the Federal Reserve hinted at tapering bond purchases, US Treasury yields surged. Emerging markets experienced massive capital outflows, and their stock markets plunged. This episode underscored the global sensitivity to US yields.
3.2 The 2018 Yield Spike
In 2018, the 10-year US Treasury yield touched 3.25%, triggering global equity sell-offs. Investors worried about higher discount rates and slowing global liquidity. Technology and high-growth sectors were hit hardest.
3.3 The 2022 Bond Rout
The Fed’s aggressive rate hikes in 2022 pushed the 10-year yield above 4%. Global equities, including the S&P 500, Europe’s Stoxx 600, and Asian indices, fell into bear markets. The pain was widespread—ranging from US tech giants to emerging-market stocks.
Part 4: Sector-Wise Impact of Rising Yields
4.1 Growth vs. Value Stocks
Growth stocks (e.g., technology, biotech) are most sensitive. Their long-duration cash flows are heavily discounted when yields rise.
Value stocks (e.g., banks, industrials, energy) often fare better. Banks, in particular, benefit from higher interest rates via improved net interest margins.
4.2 Banking & Financials
Higher yields typically boost profitability for banks and insurers, as they can lend at higher rates. Global financial stocks often outperform during rising-yield phases.
4.3 Real Estate & Utilities
These sectors are bond proxies—investors buy them for stable dividends. When Treasury yields rise, their relative appeal diminishes, leading to underperformance.
4.4 Commodities & Energy
Commodities often benefit indirectly if yields rise due to stronger growth expectations. However, if yields rise because of inflation and monetary tightening, commodities may face demand destruction risks.
Part 5: Geographic Sensitivities
5.1 United States
US equities are most directly impacted. The Nasdaq (tech-heavy) suffers more than the Dow Jones (value-oriented).
5.2 Europe
European equities track US yields closely. Higher yields in the US can lead to stronger dollar, pressuring European exporters. Additionally, Europe’s bond yields often rise in sympathy, tightening financial conditions.
5.3 Emerging Markets
Emerging markets are the most vulnerable. Rising US yields trigger:
Capital outflows (investors shift to safer US assets).
Currency depreciation (raising import costs and inflation).
Stock market sell-offs (especially in countries reliant on foreign capital).
For example, India, Brazil, and Turkey often see sharp corrections when US yields spike.
5.4 Asia (Japan, China)
Japan: Rising US yields weaken the yen (as investors chase dollar returns), which can help Japanese exporters but hurt domestic equities tied to imports.
China: Sensitive due to capital flows and trade dynamics. Rising US yields often pressure Chinese equities, especially during growth slowdowns.
Part 6: Currency & Global Equity Interplay
Rising US yields usually strengthen the US dollar. A stronger dollar reduces profits of US multinationals, pressures commodity prices, and creates headwinds for emerging-market equities. For global investors, currency-adjusted returns from foreign equities decline when the dollar is strong, further reducing equity allocations abroad.
Part 7: Broader Macroeconomic Implications
7.1 Liquidity Tightening
Higher yields reduce global liquidity. Central banks in other countries often follow the Fed to prevent capital flight, tightening financial conditions worldwide.
7.2 Inflation & Growth Trade-Off
Rising yields often reflect inflationary pressures. Central banks respond with rate hikes, slowing global growth. Equity markets suffer as both margins and valuations come under pressure.
7.3 Safe-Haven Flows
Paradoxically, in times of global turmoil, US Treasuries attract safe-haven flows, lowering yields again. But during inflationary cycles, this dynamic weakens, making equities more vulnerable.
Part 8: Coping Strategies for Investors
8.1 Diversification
Investors hedge against rising yields by diversifying into value stocks, commodities, and sectors benefiting from higher rates (like banks).
8.2 Global Allocation
Allocating across geographies can help. For instance, some Asian and European stocks may perform better depending on currency moves and domestic cycles.
8.3 Use of Derivatives
Investors use interest-rate futures, options, and currency hedges to manage risks from rising yields.
8.4 Tactical Shifts
Moving from growth to value, reducing exposure to high-duration equities, and increasing allocation to inflation-hedged assets are common strategies.
Part 9: Future Outlook
The long-term trajectory of US Treasury yields depends on:
US fiscal deficits and borrowing needs.
Federal Reserve policy normalization.
Global inflation cycles.
Geopolitical shifts in demand for US Treasuries (e.g., de-dollarization trends).
For global equities, this means heightened sensitivity to yield cycles. Investors must closely monitor not only the direction but also the pace of yield movements. Gradual increases may be absorbed, but sharp spikes usually destabilize global equities.
Conclusion
The relationship between US Treasury yields and global equities is one of the most powerful forces in financial markets. Rising yields act as a tightening mechanism, reducing equity valuations, increasing corporate borrowing costs, triggering capital outflows from emerging markets, and strengthening the US dollar. The effects vary across sectors and geographies—hurting growth stocks, real estate, and emerging markets, while benefiting banks and certain value-oriented sectors.
History shows that equity markets can tolerate moderate, steady increases in yields, particularly when driven by strong growth. However, rapid spikes often cause global turbulence. For investors, understanding these dynamics and positioning portfolios accordingly is crucial.
In essence, rising US Treasury yields are not just an American story—they are a global story, shaping equity performance from Wall Street to Mumbai, from Frankfurt to Tokyo.
Role of International Trade in Global Markets1. Understanding International Trade
International trade refers to the exchange of goods, services, capital, and ideas across national borders. Unlike domestic trade, which takes place within one country, international trade involves multiple currencies, laws, cultures, and business practices.
Key Features:
Cross-border transactions: Goods and services move from one country to another.
Comparative advantage: Nations specialize in what they produce most efficiently.
Use of currencies: Requires mechanisms for exchange rates and settlement.
Government involvement: Tariffs, quotas, trade agreements, and regulations.
Global institutions: WTO, IMF, World Bank, and regional trade blocs shape trade flows.
Historical Perspective:
Ancient trade routes like the Silk Road enabled cultural and material exchanges.
Colonial trade in the 16th–19th centuries focused on raw material extraction and global shipping networks.
Post–World War II saw the creation of institutions like the GATT (General Agreement on Tariffs and Trade), later evolving into the World Trade Organization (WTO), to facilitate rules-based trade.
21st-century trade involves digital commerce, global value chains (GVCs), and services-based exports such as IT, finance, and logistics.
2. The Economic Role of International Trade in Global Markets
(a) Driver of Economic Growth
International trade expands markets for producers, giving them access to consumers beyond national borders. For developing nations, it provides pathways to industrialization and modernization. For advanced economies, it ensures continued growth through exports and investment opportunities.
Export-led growth: Economies like China, South Korea, and Singapore have grown exponentially by adopting export-oriented development strategies.
Access to larger markets: Firms achieve economies of scale, producing more efficiently and lowering costs.
Capital inflows: Foreign trade attracts foreign direct investment (FDI), creating jobs and infrastructure.
(b) Resource Allocation and Efficiency
Trade allows countries to specialize according to comparative advantage, leading to more efficient global resource use. For example:
Middle Eastern countries specialize in oil exports.
India exports IT services and pharmaceuticals.
Germany exports automobiles and engineering products.
This specialization boosts global productivity while lowering costs for consumers.
(c) Contribution to GDP
In most economies, international trade contributes significantly to GDP (Gross Domestic Product).
For open economies like Singapore, trade (exports + imports) accounts for >300% of GDP.
Even large economies like the US, China, and EU rely heavily on trade for growth.
(d) Enhancing Consumer Choice
Through trade, consumers gain access to a wider variety of goods and services—ranging from electronics and luxury cars to agricultural products and entertainment content. This improves living standards globally.
(e) Job Creation and Employment
Trade-intensive industries generate millions of jobs. Export manufacturing zones, service outsourcing, and logistics hubs provide direct employment while also stimulating indirect job creation in supporting industries.
3. International Trade and Market Integration
(a) Global Value Chains (GVCs)
Modern trade is characterized by the fragmentation of production. A single product, like an iPhone, is designed in the US, manufactured in China, with components sourced from Japan, Korea, and Germany. GVCs integrate multiple economies into a single supply network.
(b) Financial Market Integration
International trade requires financial flows, including payments, investments, and hedging. This leads to:
Cross-border capital movement.
Global financial interdependence.
Development of international banking and currency markets.
(c) Technology and Knowledge Transfer
Trade facilitates the spread of technology and innovation. Multinational corporations bring modern techniques to host countries, enhancing productivity and competitiveness.
(d) Formation of Trade Blocs
Regional economic integration—like the European Union (EU), NAFTA/USMCA, ASEAN, and African Continental Free Trade Area (AfCFTA)—has reshaped global markets by reducing barriers and creating common markets.
4. Social and Political Role of International Trade
(a) Promoting Peace and Cooperation
Trade interdependence reduces the likelihood of conflicts. Nations that rely on each other for resources, markets, or investment have incentives to maintain peaceful relations.
(b) Cultural Exchange
Trade spreads not only products but also cultures, ideas, and lifestyles. For instance, Hollywood movies, K-pop, and yoga reached global audiences through trade-driven globalization.
(c) Political Leverage
Countries use trade as a tool of diplomacy or pressure. Sanctions, trade restrictions, and preferential trade agreements influence global politics.
(d) Reducing Poverty
Trade-led growth lifts millions out of poverty. For example, China’s integration into world trade since the 1980s has lifted over 800 million people above the poverty line.
5. Challenges of International Trade in Global Markets
While trade drives growth, it also brings vulnerabilities.
(a) Trade Imbalances
Large deficits or surpluses can destabilize economies. For instance, the persistent US-China trade imbalance has fueled economic tensions.
(b) Protectionism
Countries often impose tariffs, quotas, or subsidies to protect domestic industries, which can trigger trade wars. Example: US-China tariff war (2018–2020).
(c) Supply Chain Disruptions
Events like the COVID-19 pandemic, the Russia-Ukraine war, and the Suez Canal blockage highlighted the fragility of global supply chains.
(d) Inequality
Trade benefits are unevenly distributed. While some sectors and regions thrive, others suffer job losses due to import competition or outsourcing.
(e) Environmental Concerns
Increased trade leads to higher carbon emissions from shipping and production, contributing to climate change. At the same time, global competition pressures industries to adopt environmentally unsustainable practices.
6. Role of International Institutions in Trade
(a) World Trade Organization (WTO)
Provides rules for global trade.
Resolves disputes.
Promotes free and fair competition.
(b) International Monetary Fund (IMF) and World Bank
Support balance-of-payments stability.
Finance trade-related development projects.
(c) Regional Organizations
EU ensures a common market with free movement of goods, services, and people.
ASEAN and USMCA promote regional cooperation.
7. Future of International Trade in Global Markets
(a) Digital Trade and E-commerce
Cross-border e-commerce platforms like Amazon, Alibaba, and Shopify are reshaping trade, making it easier for small businesses to reach global markets.
(b) Services Trade
Beyond goods, international trade in IT services, fintech, tourism, and online education is becoming a major growth driver.
(c) Sustainable Trade
Green trade policies are gaining prominence, focusing on renewable energy, low-carbon logistics, and sustainable sourcing.
(d) Geopolitical Shifts
The rise of China and India as global trade powerhouses.
Trade realignment due to US-China rivalry.
Increased focus on South-South trade among emerging markets.
(e) Technological Innovations
Blockchain, artificial intelligence, and digital currencies may revolutionize trade logistics, payments, and transparency.
Conclusion
International trade is the backbone of global markets. It enables countries to grow beyond their domestic limitations, enhances efficiency through specialization, and integrates the world into a complex but interdependent economic system. While trade has its challenges—ranging from inequality and environmental concerns to geopolitical tensions—it remains an irreplaceable driver of globalization and prosperity.
In the coming decades, the role of international trade will evolve further, shaped by technology, sustainability, and geopolitics. Countries that adapt effectively, balancing openness with resilience, will thrive in an interconnected global marketplace.

Difference Between Domestic & Global Markets1. Defining Domestic and Global Markets
1.1 Domestic Market
A domestic market refers to the economic system where buying and selling of goods, services, and securities occur within a single country’s boundaries. Participants—consumers, businesses, and regulators—are all subject to the nation’s laws, taxation system, and currency.
Example: A retail chain like DMart in India primarily serves domestic customers, operating under Indian laws, pricing in rupees, and sourcing largely within the country.
1.2 Global Market
A global market refers to economic interactions that take place across national boundaries. Businesses operate internationally, customers are spread worldwide, and transactions involve multiple currencies, legal frameworks, and regulatory bodies.
Example: Apple Inc. operates in a global market by selling iPhones manufactured in China, designed in the U.S., and sold across Europe, Asia, and Africa.
2. Scope and Reach
2.1 Domestic Markets
Geographically limited to a nation’s borders.
Customer base is homogeneous to some extent, shaped by shared culture, language, and local preferences.
Easier for businesses to predict demand since consumer behavior follows national patterns.
2.2 Global Markets
Not restricted by geography.
Customer base is heterogeneous, shaped by multiple cultures, income levels, and lifestyles.
Businesses must adapt products, marketing, and pricing strategies to diverse markets.
Key Difference: Domestic markets are narrower and more predictable, whereas global markets are vast but require adaptation and flexibility.
3. Currency and Transactions
Domestic
Transactions occur in local currency (e.g., INR in India, USD in the U.S.).
Businesses are not exposed to foreign exchange risks.
Pricing is stable and predictable.
Global
Transactions involve multiple currencies.
Businesses face foreign exchange risks due to fluctuating exchange rates.
Hedging tools like forwards, futures, and options are often used to mitigate risks.
Example: An Indian exporter selling textiles to the U.S. earns in USD but pays expenses in INR, creating exposure to rupee-dollar fluctuations.
4. Regulatory Environment
Domestic
Governed by one set of laws—taxation, labor, trade, and consumer protection.
Relatively simple compliance requirements.
Global
Must comply with multiple regulatory frameworks, such as WTO guidelines, bilateral trade agreements, and local country laws.
Businesses face complex challenges like tariffs, customs duties, and import-export restrictions.
Example: Pharmaceutical companies must meet FDA regulations in the U.S., EMA rules in Europe, and CDSCO standards in India—all for the same drug.
5. Participants and Players
Domestic
Participants: Local consumers, domestic businesses, national government, and domestic financial institutions.
Competition is mostly between local companies.
Global
Participants: Multinational corporations (MNCs), foreign investors, international banks, governments, and supranational organizations (like IMF, WTO, World Bank).
Competition is global, with both domestic and foreign firms vying for market share.
6. Cultural and Social Factors
Domestic
Shared culture, traditions, and language make it easier to design marketing campaigns and business strategies.
Customer behavior is more predictable.
Global
Requires cultural sensitivity and adaptation.
Marketing campaigns must be tailored to different countries.
Misunderstandings can lead to failures.
Example: McDonald’s offers vegetarian menus in India but focuses on beef products in the U.S.—an adaptation to cultural norms.
7. Technology and Infrastructure
Domestic
Businesses depend on the nation’s infrastructure—roads, telecom, electricity, banking system.
Technological standards are uniform across the country.
Global
Requires adaptation to varying levels of infrastructure across countries.
Digital platforms and e-commerce allow businesses to reach global customers more easily.
Example: Amazon must adapt its delivery logistics differently in developed markets like the U.S. versus emerging markets like India.
8. Risks and Uncertainties
Domestic
Risks are limited to local economic cycles, political changes, or regulatory shifts.
Easier to forecast.
Global
Exposed to a wide range of risks:
Exchange rate volatility
Geopolitical tensions
Trade wars and sanctions
Global recessions
Higher uncertainty, requiring strong risk management.
9. Opportunities for Businesses
Domestic
Easier entry for startups and small businesses.
Lower operational complexity.
Opportunity to build brand loyalty in a focused market.
Global
Access to larger customer base.
Diversification across countries reduces dependency on one economy.
Economies of scale in production and sourcing.
Example: Samsung’s global operations allow it to spread risks—if demand slows in one region, it can rely on others.
10. Trade and Capital Flows
Domestic
Trade and capital flows remain within the country.
Investments are in local stocks, bonds, and banks.
Global
Involves international trade and capital flows.
Access to foreign direct investment (FDI), global venture capital, and international stock markets.
Cross-border mergers and acquisitions are common.
Advantages and Disadvantages
Domestic Markets
Advantages:
Lower risk and complexity.
Familiar consumer base.
Easier regulations.
Disadvantages:
Limited growth potential.
Vulnerable to domestic economic downturns.
Global Markets
Advantages:
Huge growth opportunities.
Risk diversification.
Access to global talent, technology, and capital.
Disadvantages:
Complex regulations and higher costs.
Cultural and operational challenges.
Exposure to global uncertainties.
Conclusion
The domestic market provides a secure foundation for businesses, enabling them to establish brand value and gain local expertise. The global market, on the other hand, offers expansion opportunities, diversification, and exposure to larger customer bases—but at the cost of higher complexity and risk.
For businesses and investors, the choice between domestic and global markets is not always an either-or scenario. In fact, the most successful strategies involve building a strong domestic base and then gradually expanding globally.
Ultimately, understanding the differences between domestic and global markets allows companies, policymakers, and investors to make informed decisions in an increasingly interconnected economic world.
Risks in International Markets1. Economic Risks
1.1 Exchange Rate Volatility
Currency fluctuations are one of the most prominent risks in international trade and investment. A company exporting goods may see profits wiped out if the foreign currency weakens against its home currency.
Example: An Indian IT company billing clients in U.S. dollars may face reduced revenues when the rupee strengthens against the dollar.
1.2 Inflation and Deflation
High inflation erodes purchasing power, increases input costs, and disrupts profit margins. Conversely, deflation can reduce demand and stall economic activity.
Example: Argentina’s chronic inflation crisis often discourages foreign investors who fear value erosion.
1.3 Interest Rate Fluctuations
Central banks’ monetary policies impact borrowing costs and investment flows. An unexpected hike in interest rates in one country may cause sudden capital flight from emerging markets.
Example: The U.S. Federal Reserve’s interest rate hikes often trigger volatility in Asian and African markets.
1.4 Recession and Economic Slowdowns
Global recessions reduce demand for exports, depress commodity prices, and weaken consumer confidence.
Example: The 2008 global financial crisis led to massive declines in cross-border trade and investment.
2. Financial Risks
2.1 Credit and Default Risks
Companies operating in international markets face the risk of counterparties defaulting on payments.
Example: During the 1997 Asian financial crisis, many firms defaulted, leaving global suppliers unpaid.
2.2 Liquidity Risks
Some foreign markets lack depth, meaning it may be difficult to sell assets quickly without losses.
2.3 Market Volatility
Stock, bond, and commodity markets in emerging economies are often more volatile due to low investor confidence, political instability, or weak regulations.
Example: The Russian stock market has historically experienced extreme volatility linked to sanctions and oil price movements.
2.4 Capital Flow Reversals
Large and sudden withdrawals of foreign portfolio investments can destabilize markets.
3. Political Risks
3.1 Government Instability
Frequent changes in government, corruption, or coups create uncertainty.
Example: Political turmoil in Pakistan often deters foreign direct investment.
3.2 Nationalization and Expropriation
Governments may seize control of foreign assets.
Example: Venezuela nationalized foreign oil companies in the 2000s, leading to billion-dollar losses for firms like ExxonMobil.
3.3 Geopolitical Conflicts
Wars, sanctions, and territorial disputes disrupt supply chains and investments.
Example: The Russia-Ukraine conflict caused global energy and food price spikes.
3.4 Protectionism
Tariffs, quotas, and restrictions limit free trade.
Example: The U.S.–China trade war imposed heavy tariffs, hurting exporters worldwide.
4. Legal and Regulatory Risks
4.1 Differing Legal Systems
What is legal in one country may be illegal in another.
Example: Intellectual property protection is strong in the U.S. but weak in some Asian economies, leading to counterfeiting risks.
4.2 Taxation Policies
Double taxation or unexpected tax reforms can erode profits.
4.3 Contract Enforcement
Weak judicial systems may delay or prevent resolution of business disputes.
4.4 Compliance and Standards
Businesses must comply with varying labor, safety, and environmental laws across markets.
5. Cultural and Social Risks
5.1 Consumer Preferences
Products that succeed in one country may fail elsewhere due to cultural differences.
Example: Walmart struggled in Germany because its retail culture clashed with German shopping habits.
5.2 Communication Barriers
Misunderstandings due to language or etiquette can harm negotiations.
5.3 Labor Relations
Different countries have unique labor practices and union dynamics.
5.4 Social Unrest
Strikes, protests, or civil movements can disrupt operations.
6. Technological Risks
6.1 Cybersecurity Threats
Cross-border businesses face heightened risks of hacking, fraud, and cyber-espionage.
Example: Global ransomware attacks like WannaCry hit companies operating internationally.
6.2 Technological Obsolescence
Rapid innovation means products and processes can quickly become outdated.
6.3 Digital Divide
Operating in markets with poor digital infrastructure limits efficiency.
7. Environmental and Natural Risks
7.1 Climate Change
Rising sea levels, extreme weather, and changing agricultural patterns disrupt global supply chains.
Example: Floods in Thailand (2011) severely disrupted global automobile and electronics supply chains.
7.2 Natural Disasters
Earthquakes, hurricanes, or pandemics can shut down markets overnight.
Example: The COVID-19 pandemic brought unprecedented disruption to international trade.
7.3 Environmental Regulations
Stricter global climate policies increase compliance costs.
8. Operational Risks
8.1 Supply Chain Disruptions
Globalized production systems are highly vulnerable to bottlenecks.
Example: The 2021 Suez Canal blockage caused billions in trade losses.
8.2 Infrastructure Limitations
Poor roads, ports, and logistics reduce efficiency.
8.3 Management Complexity
Coordinating diverse teams across countries increases risks of inefficiency.
9. Case Studies
2008 Global Financial Crisis – Showed how interconnected financial systems amplify risks.
Brexit – Created uncertainty for businesses operating across the UK and EU.
COVID-19 Pandemic – Highlighted vulnerabilities in supply chains and global health systems.
U.S.–China Trade War – Demonstrated how political tensions affect global markets.
10. Risk Mitigation Strategies
Hedging against currency and commodity risks.
Diversification across markets and sectors.
Political risk insurance for investments in volatile regions.
Robust compliance programs for navigating legal risks.
Cultural training for international teams.
Digital security investments to counter cyber threats.
Supply chain resilience through multiple sourcing and local alternatives.
Conclusion
International markets present immense opportunities for growth and diversification. However, these opportunities are shadowed by complex risks ranging from currency volatility and political instability to technological disruptions and environmental challenges.
For investors, corporations, and policymakers, success lies not in avoiding risks but in understanding, anticipating, and managing them strategically. A structured approach to risk assessment, combined with adaptive strategies, enables global players to thrive in uncertain environments.
The modern world demands resilience—businesses must prepare for shocks, governments must design stable frameworks, and investors must remain vigilant. By doing so, the promise of international markets can outweigh their perils.

Bitcoin - TIP - Correct Way to Draw Support / ResistanceI see often times analysts using horizontal support and resistance on Bitcoin.
I wanted to demonstrate the proper way of using support resistance on Bitcoin - and show how the channels are ascending from left to right.
Not only can this be repeated on high time frames - by duplicating the line with the same degree of angle, and placing it at any location - it can also be applied to smaller and smaller time frames, and the price respects these angles very well.
Due to the liquidation wicks and absorptions that occur, price will move above and below the correct line - but the correct line serves as a volume support line that’s again, ascending from left to right.
Try this out on your charts - and see how reliable it is.
Ascending angles - not horizontals.

Currency Pegs & Managed Exchange Rates1. Theoretical Background: Exchange Rate Systems
Before diving into pegs and managed exchange rates, it is essential to understand the spectrum of exchange rate arrangements.
Free-floating exchange rates
Determined entirely by supply and demand in the foreign exchange market.
No direct government or central bank intervention.
Example: U.S. dollar, Japanese yen, British pound.
Fixed exchange rates
Currency value is tied to another currency or a basket of currencies.
Requires constant intervention to maintain the fixed rate.
Example: Gold standard (historical), Hong Kong dollar peg to USD.
Intermediate systems
Includes currency pegs, crawling pegs, and managed floats.
Aim to combine stability with some degree of flexibility.
Most countries today operate in this middle ground.
Thus, currency pegs and managed exchange rates fall under the "intermediate" category—neither fully rigid nor fully market-determined.
2. Currency Pegs: Definition and Mechanism
A currency peg (also called a fixed exchange rate) is when a country’s central bank commits to maintaining its currency at a specific exchange rate relative to another major currency or basket.
How It Works:
The central bank monitors the foreign exchange market.
If the domestic currency depreciates below the peg, the central bank intervenes by selling foreign reserves (usually U.S. dollars or euros) and buying domestic currency to restore the peg.
If the domestic currency appreciates above the peg, the central bank buys foreign currency and sells domestic currency.
Maintaining the peg requires large reserves of foreign currency and tight monetary discipline.
Types of Pegs:
Hard Pegs
Currency is immovably fixed, sometimes legally.
Example: Currency board systems like in Hong Kong.
Soft Pegs
Fixed within a narrow band but adjustable under certain conditions.
Example: China before 2005 pegged the yuan to the U.S. dollar but adjusted occasionally.
Crawling Pegs
The peg is adjusted gradually, often in response to inflation or trade deficits.
Example: Several Latin American countries have used crawling pegs.
Historical Context
The most famous peg system was the Bretton Woods system (1944–1971), where most currencies were pegged to the U.S. dollar, which in turn was pegged to gold at $35 per ounce. This system collapsed when the U.S. could no longer maintain gold convertibility, leading to today’s diverse exchange rate regimes.
3. Managed Exchange Rates: Definition and Mechanism
A managed exchange rate (or dirty float) is a system where a currency is allowed to fluctuate according to market forces but with periodic government or central bank interventions.
Key Characteristics:
The exchange rate is not strictly fixed.
Central banks intervene to prevent excessive volatility or maintain competitiveness.
Intervention tools include:
Buying/selling foreign currency.
Adjusting interest rates.
Using capital controls.
Example:
China’s managed float system since 2005. The yuan is not entirely free-floating; the People’s Bank of China (PBoC) sets a daily reference rate and allows limited fluctuations within a band.
Why Managed Floats?
To avoid the instability of free-floating currencies.
To retain flexibility in adjusting to shocks.
To prevent speculative attacks common under rigid pegs.
4. Advantages of Currency Pegs
Stability in Trade & Investment
Pegs reduce exchange rate risk, encouraging foreign trade and investment.
Example: Hong Kong’s USD peg has attracted global businesses.
Inflation Control
Pegging to a stable currency can help reduce inflation in countries with weak monetary institutions.
Credibility for Developing Economies
Pegs provide a clear and transparent exchange rate target, increasing investor confidence.
Tourism & Remittances
Stable exchange rates benefit countries reliant on tourism and remittance inflows.
5. Disadvantages of Currency Pegs
Loss of Monetary Policy Independence
Central banks cannot freely adjust interest rates.
Domestic priorities like unemployment may be ignored.
Vulnerability to Speculative Attacks
If investors doubt the peg’s sustainability, massive speculative outflows can trigger a crisis.
Example: 1997 Asian Financial Crisis.
Requirement of Large Foreign Reserves
Maintaining a peg requires holding vast reserves, which is costly.
Importing Inflation/Deflation
Pegging to another currency means importing that country’s monetary policy.
6. Advantages of Managed Exchange Rates
Flexibility with Stability
Combines market-driven efficiency with government’s ability to smooth volatility.
Crisis Management Tool
Central banks can intervene during crises to stabilize the currency.
Helps Maintain Competitiveness
Countries can prevent their currencies from appreciating too much, supporting exports.
Avoids Extreme Currency Misalignments
Intervention reduces excessive swings caused by speculation or capital flows.
7. Disadvantages of Managed Exchange Rates
Uncertainty & Lack of Transparency
Since interventions are unpredictable, investors may face uncertainty.
Cost of Intervention
Frequent interventions require reserves and may distort the market.
Moral Hazard
Businesses may rely on government protection against currency fluctuations instead of proper risk management.
Political Manipulation
Governments may artificially keep currencies undervalued, leading to trade disputes.
Example: Accusations against China for "currency manipulation."
8. Case Studies
Case Study 1: Hong Kong Dollar Peg
Since 1983, pegged at HK$7.8 per USD.
Helped maintain Hong Kong as a financial hub.
However, limits monetary independence, especially during crises.
Case Study 2: Chinese Yuan (RMB)
Pre-2005: Strict peg to USD.
Post-2005: Managed float with a daily reference rate.
This allowed China to gradually internationalize the yuan and maintain export competitiveness.
Case Study 3: Argentina’s Currency Board (1991–2001)
Peso pegged 1:1 to USD to fight hyperinflation.
Initially successful, but eventually collapsed due to loss of competitiveness and inability to devalue.
Led to a severe financial crisis.
Case Study 4: Asian Financial Crisis (1997–98)
Many Southeast Asian economies had soft pegs to the dollar.
When investors lost confidence, speculative attacks forced massive devaluations.
Highlights the vulnerability of rigid or semi-rigid pegs without sufficient reserves.
9. Role of IMF and International Community
The IMF monitors exchange rate policies and provides support during crises.
It offers countries advice on choosing appropriate regimes depending on their structure.
For developing nations, IMF often recommends flexible systems to absorb shocks.
However, IMF-supported stabilization programs sometimes push countries toward pegs for credibility.
10. Modern Challenges
Globalization & Capital Mobility
Rapid capital flows make it harder to defend pegs.
Currency Wars
Countries may manipulate exchange rates for trade advantage, creating global tensions.
Dollar Dominance
Since many pegs are tied to the U.S. dollar, shifts in U.S. monetary policy have global spillovers.
Digital Currencies & Fintech
Central bank digital currencies (CBDCs) may transform exchange rate management in the future.
Conclusion
Currency pegs and managed exchange rate regimes are essential tools in global financial architecture. Pegs provide stability but sacrifice flexibility, often leading to crises if mismanaged. Managed exchange rates offer a middle path—allowing currencies to respond to market forces while enabling governments to intervene when necessary.
The choice of regime depends on a country’s economic structure, trade composition, inflation history, and policy credibility. There is no one-size-fits-all approach. For small, open economies reliant on trade, pegs can be beneficial. For larger, emerging markets, managed floats may provide the necessary balance. Ultimately, successful exchange rate management requires strong institutions, prudent policies, and adaptability in a constantly evolving global economy.

Impact of Currency Fluctuations on Global TradeIntroduction
Global trade is the lifeline of the modern economy. It connects countries, industries, and consumers across borders, enabling the exchange of goods, services, capital, and technology. However, at the core of every international transaction lies a critical factor that often gets overlooked in public discussions—currency exchange rates.
Currency fluctuations—the rise and fall of the value of one currency relative to another—play a significant role in shaping trade flows, competitiveness, profitability, and even the stability of entire economies. Exchange rate volatility can determine whether exports are competitive in global markets, how much importers pay for foreign goods, and how investors allocate capital across nations.
This essay explores the impact of currency fluctuations on global trade, breaking down causes, mechanisms, case studies, and long-term implications. It also looks at how governments, central banks, corporations, and financial institutions respond to mitigate risks associated with exchange rate volatility.
Understanding Currency Fluctuations
Currency fluctuations occur when the value of one currency rises or falls relative to another. The foreign exchange (forex) market, the largest financial market in the world, facilitates the buying and selling of currencies. Exchange rates are influenced by supply and demand, interest rates, inflation, political stability, monetary policy, and market speculation.
For example, if the Indian Rupee (INR) weakens against the US Dollar (USD), then Indian exporters receive more rupees for each dollar earned, making exports more competitive. On the other hand, importers must pay more for foreign goods priced in dollars, making imports costlier.
Key terms:
Appreciation: When a currency strengthens relative to another.
Depreciation: When a currency weakens relative to another.
Volatility: The degree of variation in currency values over time.
Causes of Currency Fluctuations
Monetary Policy & Interest Rates
Central banks influence exchange rates through interest rate decisions. Higher interest rates attract foreign capital, strengthening the currency, while lower rates weaken it.
Inflation Levels
Countries with lower inflation typically see currency appreciation, as purchasing power is preserved. High inflation erodes value.
Trade Balances
Nations running trade surpluses (exports > imports) often see stronger currencies, while deficits weaken them.
Capital Flows & Foreign Investment
Strong inflows of foreign direct investment (FDI) or portfolio investment increase demand for a currency, boosting its value.
Political & Economic Stability
Stable countries attract investors, strengthening their currency, while instability leads to capital flight and depreciation.
Market Speculation
Traders in the forex market bet on future movements, sometimes amplifying volatility.
Mechanisms of Impact on Global Trade
1. Export Competitiveness
When a country’s currency depreciates, its exports become cheaper for foreign buyers, boosting demand.
When a currency appreciates, exports become expensive, reducing competitiveness.
2. Import Costs
Currency depreciation increases the cost of imported raw materials, fuel, and machinery.
Appreciation makes imports cheaper, lowering input costs for domestic industries.
3. Profit Margins of Businesses
Exporters benefit from weaker domestic currencies, while import-heavy industries suffer.
Multinational corporations with global operations must manage “translation risk” when consolidating earnings from various currencies.
4. Balance of Payments (BoP)
Persistent depreciation can reduce trade deficits by discouraging imports and encouraging exports.
However, volatility creates uncertainty that disrupts long-term trade agreements.
5. Consumer Prices & Inflation
Currency depreciation makes imports costlier, leading to inflationary pressures in domestic markets.
This reduces consumer purchasing power and alters consumption patterns.
Case Studies: Real-World Examples
1. The US Dollar and Global Trade
The US dollar is the world’s reserve currency, used in most international trade. When the dollar strengthens:
Emerging markets struggle, as their imports become costlier.
US exporters lose competitiveness abroad.
Oil and commodity prices (often denominated in USD) rise for other countries.
2. Japan’s Yen Depreciation (2012–2015)
Japan deliberately weakened its yen under “Abenomics” to boost exports.
Japanese automakers and electronics manufacturers benefited.
Import costs for energy and food rose, impacting consumers.
3. Indian Rupee Volatility
The INR often faces depreciation pressures due to oil imports and trade deficits.
Exporters in IT and textiles gain from weaker rupee.
Oil importers, airlines, and electronics manufacturers face higher costs.
4. Eurozone Crises (2010–2012)
During the sovereign debt crisis, euro depreciation initially supported European exports. However, uncertainty discouraged investment and hurt overall trade confidence.
5. Chinese Yuan Management
China manages its currency to remain competitive in global trade. A weaker yuan supports Chinese exports, though it has often drawn criticism from trading partners accusing China of “currency manipulation.”
Short-Term vs Long-Term Impacts
Short-Term Effects:
Exporters and importers immediately feel gains or losses from currency shifts.
Volatility disrupts pricing strategies, contracts, and supply chains.
Long-Term Effects:
Persistent depreciation can erode investor confidence, discouraging capital inflows.
Companies may relocate production to hedge against currency risks.
Exchange rate instability may encourage protectionism and tariffs.
Sector-Wise Impact
Energy Sector
Oil prices, usually denominated in USD, fluctuate with dollar strength. Importing nations face inflation when their currency weakens.
Technology & Services
Outsourcing destinations like India benefit when their currency weakens, as dollar earnings translate into higher domestic revenue.
Manufacturing & Automobiles
Export-oriented industries gain from weaker home currencies. However, dependency on imported raw materials can offset benefits.
Agriculture & Commodities
Farmers in export-driven economies gain from weaker currencies. But fertilizer, equipment, and fuel imports become costlier.
Tools to Manage Currency Risks
1. Hedging Instruments
Forward Contracts: Lock in exchange rates for future transactions.
Options: Provide flexibility to buy/sell at a fixed rate.
Swaps: Exchange currency cash flows between parties.
2. Diversification
Multinationals diversify production and sourcing across countries to reduce exposure.
3. Central Bank Intervention
Central banks buy/sell currencies to stabilize volatility.
4. Trade Agreements
Regional trade blocs (e.g., EU, ASEAN) reduce intra-region currency risk by using common or pegged currencies.
Winners and Losers in Currency Fluctuations
Winners: Exporters during depreciation, importers during appreciation, forex traders exploiting volatility.
Losers: Import-dependent industries during depreciation, debt-heavy countries with foreign loans, consumers facing inflation.
Broader Economic Implications
Global Supply Chains
Exchange rate volatility complicates cost management in multinational supply chains.
Foreign Debt Servicing
Countries with debt denominated in foreign currencies face higher repayment costs if their currency depreciates.
Trade Wars & Protectionism
Currency disputes can lead to accusations of manipulation, tariffs, and retaliatory trade measures.
Financial Market Volatility
Sudden currency swings trigger capital outflows from emerging markets, destabilizing stock and bond markets.
Future Outlook
Digital Currencies & CBDCs: The rise of central bank digital currencies could reduce transaction costs and lower forex volatility.
Regionalization of Trade: More trade within blocs may reduce exposure to dollar dominance.
Greater Use of Hedging Tools: Firms will increasingly rely on sophisticated financial instruments to manage risk.
Geopolitical Uncertainty: Wars, sanctions, and supply chain disruptions will continue to drive currency volatility.
Conclusion
Currency fluctuations are both an opportunity and a risk in global trade. While depreciation can stimulate exports, it also raises import costs and inflation. Appreciation makes imports cheaper but hurts exporters. The net effect depends on a nation’s trade structure, economic resilience, and ability to manage risks.
For businesses, managing currency risk is now as important as managing production or marketing. Governments must balance exchange rate stability with economic growth, while central banks act as guardians against excessive volatility.
In an interconnected world, no nation is immune from the impact of currency swings. Exchange rate management and risk mitigation strategies will remain central to ensuring global trade continues to thrive despite fluctuations.
Emerging Markets vs Developed Markets1. Defining Emerging and Developed Markets
Emerging Markets
Defined by the World Bank, IMF, and MSCI as economies transitioning from low or middle-income to higher-income levels.
Often characterized by rapid GDP growth, increasing foreign investment, and structural reforms.
Have growing but still volatile financial markets.
Examples: India, China, Brazil, Mexico, Turkey, South Africa.
Developed Markets
Countries with high per-capita income (usually above $12,000-$15,000), strong institutions, and advanced infrastructure.
Financial systems are stable, liquid, and globally integrated.
Economies are more service-oriented rather than manufacturing-driven.
Examples: U.S., U.K., Germany, Japan, Canada, Australia.
2. Key Economic Characteristics
Feature Emerging Markets Developed Markets
GDP Growth Higher growth rates (5–8% in many cases) Lower growth (1–3%)
Per Capita Income Low to middle-income High-income
Industrial Structure Manufacturing & agriculture dominant, but services growing Services dominate (finance, technology, healthcare)
Innovation Catching up; dependent on FDI & imports Advanced R&D, global tech leaders
Currency Stability Volatile, prone to inflation Stable, globally traded (USD, Euro, Yen)
Emerging markets are often seen as growth stories, while developed markets represent stability and maturity.
3. Financial Market Differences
Emerging Markets
Stock markets are less liquid, meaning large trades can move prices dramatically.
Higher volatility due to political risk, regulatory uncertainty, and global capital flows.
Often more sector-concentrated (energy, banking, infrastructure).
Foreign Direct Investment (FDI) plays a big role in financing growth.
Developed Markets
Deep, highly liquid capital markets (e.g., U.S. stock market is the largest in the world).
Lower volatility, with strong institutional investors (pension funds, insurance companies).
More diverse sectoral representation (tech, healthcare, finance, industrials).
Better regulations, reducing systemic risks.
4. Investment Opportunities
Why Investors Choose Emerging Markets
Higher returns: Fast economic growth means higher equity and bond returns (though riskier).
Demographics: Younger populations, rising middle class, and urbanization.
Undervalued assets: Stocks and bonds often trade at cheaper valuations compared to developed markets.
Natural resources: Many emerging economies are rich in oil, gas, and minerals.
Why Investors Choose Developed Markets
Stability: Political stability, strong legal protections, and reliable institutions.
Liquidity: Easy entry and exit in large markets like the U.S. and Europe.
Innovation hubs: Developed countries lead in technology, biotech, and finance.
Lower risk: Investors prefer developed markets during global uncertainty.
5. Risk Factors
Emerging Markets Risks
Political Risk: Government instability, corruption, and inconsistent policy.
Currency Risk: Devaluation or inflation affecting returns.
Liquidity Risk: Difficulty in buying/selling assets without price disruptions.
Regulatory Risk: Sudden changes in trade policy, taxes, or financial rules.
Dependence on Commodities: Economies like Brazil or Russia depend heavily on oil/mineral exports.
Developed Markets Risks
Slower Growth: Returns are lower due to market maturity.
Aging Population: Japan and Europe face demographic challenges.
Debt Levels: High government debt (U.S., Japan).
Global Linkages: Developed markets are highly exposed to global downturns.
6. Role in Global Trade
Emerging Markets: Supply labor-intensive goods, commodities, and raw materials. They are key players in global manufacturing supply chains (China, Vietnam, India).
Developed Markets: Supply high-value goods and services like technology, finance, pharmaceuticals, aerospace, and luxury products.
Emerging economies are often the producers, while developed markets are the consumers and innovators.
7. Examples of Emerging vs Developed Markets
Emerging Markets Examples
India: Fastest-growing large economy, driven by services and IT.
China: World’s factory, now transitioning toward consumption-driven growth.
Brazil: Rich in natural resources but faces political and inflation challenges.
South Africa: Gateway to Africa, but troubled by inequality and governance issues.
Developed Markets Examples
United States: World’s largest economy, innovation hub (Silicon Valley, Wall Street).
Germany: Europe’s powerhouse, strong in engineering and manufacturing.
Japan: Technology-driven, though aging demographics challenge growth.
United Kingdom: Major financial center, diversified economy.
8. Performance Trends
Emerging markets tend to outperform during global booms due to higher growth and demand for commodities.
Developed markets perform better in downturns, as investors flock to safe assets.
Over the last two decades, China and India have been the growth engines, while the U.S. has remained the financial powerhouse.
9. Case Study: 2008 Financial Crisis vs COVID-19 Pandemic
2008 Crisis: Developed markets (U.S., Europe) were hit hardest due to financial exposure. Emerging markets recovered faster, supported by China’s stimulus.
COVID-19 Pandemic: Emerging markets struggled due to weak healthcare and high debt, while developed economies used fiscal stimulus and central banks to stabilize markets.
This highlights how resilience differs across categories.
10. Future Outlook
Emerging Markets: Expected to drive global growth due to demographics, urbanization, and technology adoption. India and Southeast Asia are especially promising.
Developed Markets: Will remain leaders in innovation, finance, and global institutions. However, slower growth and aging populations will challenge long-term momentum.
Integration: The line between emerging and developed is blurring. Countries like South Korea, Singapore, and Taiwan once considered “emerging” are now closer to developed status.
Conclusion
The distinction between emerging markets and developed markets is fundamental in understanding global economics and finance. Emerging markets offer growth, opportunities, and dynamism, while developed markets provide stability, maturity, and reliability.
For investors, businesses, and policymakers, the choice is not about preferring one over the other but about balancing exposure to both. A diversified portfolio that captures the growth of emerging markets while relying on the stability of developed markets is often the most effective approach.
The future will likely see more emerging economies transition into developed ones, reshaping the global economic order. India, China, and parts of Africa may become the next growth engines, while developed countries will continue leading in technology and governance.
In summary, emerging markets are the growth frontier, while developed markets remain the anchors of global stability. Understanding their differences is key to navigating global finance and economics.
Global Venture Capital & Startups1. Understanding Startups
1.1 Definition
A startup is a young, innovative company designed to grow rapidly, often leveraging technology to disrupt existing industries or create new markets. Unlike traditional businesses that may prioritize steady, incremental growth, startups seek scalability and exponential growth.
1.2 Key Characteristics of Startups
Innovation: Offering new products, services, or business models.
Scalability: Potential to serve millions of customers quickly.
High Risk, High Reward: Success can lead to unicorns (valued over $1 billion), while many fail within the first five years.
Funding Dependence: Require external capital since revenues are usually limited in the early stages.
1.3 Examples of Iconic Startups
Google, Amazon, and Facebook – once startups, now trillion-dollar enterprises.
Flipkart, Ola, and Zomato – Indian startups that transformed local economies.
Nubank (Brazil) – a fintech disrupting banking in Latin America.
2. The Venture Capital Model
2.1 What is Venture Capital?
Venture capital is a type of private equity financing provided by VC firms or funds to startups and early-stage companies that are believed to have high growth potential. Investors provide funding in exchange for equity (ownership shares).
2.2 The VC Process
Fundraising: VC firms raise money from limited partners (LPs) like pension funds, wealthy individuals, sovereign wealth funds, and corporations.
Investment: VCs invest in startups at different stages (seed, early-stage, growth, late-stage).
Mentorship & Support: Beyond money, VCs provide expertise, industry connections, and strategic guidance.
Exit: VCs seek returns via IPOs, acquisitions, or secondary sales of shares.
2.3 Stages of VC Funding
Pre-seed & Seed: Idea or prototype stage, high risk.
Series A: Proving product-market fit, scaling operations.
Series B & C: Expanding market share, international growth.
Late-Stage / Pre-IPO: Preparing for public listing or acquisition.
2.4 Venture Capital Economics
High Risk: Most startups fail; VCs rely on a few “home runs” to deliver returns.
Portfolio Approach: A VC fund invests in 20–30 startups, expecting 2–3 to generate massive returns.
Time Horizon: Returns typically realized in 7–10 years.
3. Evolution of Global Venture Capital
3.1 Early Origins
The concept of risk capital dates back centuries, with European merchants funding voyages.
Modern venture capital emerged in the U.S. post-World War II, with firms like ARDC backing companies such as Digital Equipment Corporation.
3.2 Silicon Valley Model
In the 1970s–90s, Silicon Valley became the global hub of VC, giving rise to Apple, Intel, Cisco, Google, and Yahoo.
The U.S. institutionalized venture capital as a structured asset class, inspiring global replication.
3.3 Global Expansion
China: VC boomed in the 2000s with Alibaba, Tencent, and ByteDance.
India: VC growth accelerated post-2010, with Flipkart, Paytm, and Byju’s.
Europe & Israel: Strong ecosystems for deep tech, cybersecurity, and biotech.
Latin America & Africa: Emerging markets with fintech and e-commerce focus.
4. Regional Venture Capital Ecosystems
4.1 United States
Largest and most mature VC market.
Strong universities (Stanford, MIT), corporate innovation, and risk-taking culture.
Home to iconic VC firms: Sequoia Capital, Andreessen Horowitz, Accel.
Hot sectors: AI, biotech, clean energy, SaaS.
4.2 China
Government-backed VC funds play a big role.
Rapid scaling due to large domestic market.
Leading in e-commerce, AI, electric vehicles, and fintech.
Key firms: Hillhouse Capital, IDG Capital.
4.3 India
One of the fastest-growing startup ecosystems.
Sectors: fintech, edtech, e-commerce, mobility.
Unicorns: Flipkart, Byju’s, PhonePe, Zomato.
Global VCs like Tiger Global, SoftBank, and Sequoia India drive growth.
4.4 Europe
Strong research base, but fragmented markets slow scaling.
Focus on green tech, health tech, and B2B SaaS.
London, Berlin, and Paris are key hubs.
4.5 Israel
Known as the “Startup Nation.”
Focus on cybersecurity, defense tech, and AI.
Heavy collaboration between startups, universities, and defense sector.
4.6 Latin America & Africa
Growing VC ecosystems with fintech leading the charge.
Examples: Nubank (Brazil), Flutterwave (Nigeria), M-Pesa (Kenya).
Global VCs increasingly investing due to large unbanked populations.
5. Startup Sectors Attracting VC Capital
5.1 Technology & Software
Cloud computing, SaaS, AI, and machine learning dominate VC funding.
5.2 Fintech
Mobile banking, payment platforms, cryptocurrency, blockchain-based services.
Examples: Stripe (US), Paytm (India), Revolut (UK).
5.3 HealthTech & Biotech
Telemedicine, genetic testing, biotech research, drug discovery.
Pandemic accelerated VC investment.
5.4 Green Tech & Sustainability
Clean energy, EVs, climate tech.
Example: Tesla, Northvolt.
5.5 Consumer Internet & E-Commerce
Still a dominant sector in emerging markets.
Examples: Amazon, Flipkart, Shopee, MercadoLibre.
6. Challenges in Global VC & Startups
6.1 High Failure Rates
Around 90% of startups fail due to lack of market demand, poor business models, or mismanagement.
6.2 Overvaluation & Funding Bubbles
Intense competition sometimes inflates valuations beyond fundamentals.
Example: WeWork’s failed IPO in 2019 exposed flaws in the system.
6.3 Geographic Inequality
VC funding is concentrated in select hubs (Silicon Valley, Beijing, Bengaluru), while smaller regions struggle.
6.4 Regulatory & Political Risks
Data privacy laws, antitrust scrutiny, and geopolitical tensions affect startup growth.
6.5 Exit Challenges
IPO markets may fluctuate; acquisitions depend on larger companies’ appetite.
7. Social & Economic Impact of Startups
7.1 Job Creation
Startups generate millions of jobs, particularly in emerging markets.
7.2 Innovation Driver
Disrupt traditional industries (Uber vs. taxis, Airbnb vs. hotels).
7.3 Global Connectivity
Platforms like Zoom, Slack, and WhatsApp revolutionized communication.
7.4 Financial Inclusion
Fintech startups expand access to banking for underserved populations.
7.5 Risks of Inequality
Tech concentration can widen wealth gaps and regional divides.
8. Future of Global VC & Startups
8.1 Rise of AI-First Startups
AI expected to dominate every sector from healthcare to education.
8.2 ESG & Impact Investing
More capital flowing to climate tech, renewable energy, and social enterprises.
8.3 Decentralization & Web3
Blockchain and decentralized finance (DeFi) creating new opportunities.
8.4 Globalization of VC
Cross-border investments increasing, with U.S. and Chinese VCs funding in Africa, LATAM, and SE Asia.
8.5 Corporate Venture Capital (CVC)
Large corporations setting up VC arms (Google Ventures, Intel Capital, Reliance Ventures).
Conclusion
The global venture capital and startup ecosystem is one of the most dynamic forces shaping the modern economy. Startups bring forth disruptive innovation, challenge traditional industries, and create wealth and jobs on an unprecedented scale. Venture capital, in turn, provides the financial and strategic backing needed to fuel this engine of innovation.
However, the ecosystem is not without risks: high failure rates, valuation bubbles, and inequality pose real challenges. Despite these, the trajectory of global VC and startups points toward continued growth, deeper globalization, and stronger integration with pressing global challenges such as climate change, healthcare, and financial inclusion.
The next decade promises a world where venture capital not only funds billion-dollar companies but also helps solve billion-people problems.

Role of Rating Agencies in Global Capital FlowsIntroduction
Global capital flows—the cross-border movement of financial resources in the form of equity, debt, and investments—are a critical element of the modern financial system. They connect savings from one part of the world to investment opportunities in another, enabling economic growth, diversification of risk, and efficient allocation of capital. However, capital flows are also influenced by perceptions of creditworthiness, risk, and trust in financial systems. This is where credit rating agencies (CRAs) play a decisive role.
Credit rating agencies such as Standard & Poor’s (S&P), Moody’s, and Fitch Ratings have become central arbiters in the global financial marketplace. Their ratings on sovereigns, corporations, and structured financial products serve as signals of risk that investors use when making cross-border investment decisions. From setting borrowing costs to influencing capital allocation, rating agencies have profound power in shaping the direction, volume, and cost of global capital flows.
This essay explores in detail the role of rating agencies in global capital flows, their mechanisms, benefits, criticisms, historical case studies, and the way forward in ensuring accountability and stability in global markets.
1. Understanding Credit Rating Agencies
1.1 Definition and Function
Credit rating agencies are private institutions that assess the creditworthiness of borrowers—whether sovereign governments, financial institutions, corporations, or structured products like mortgage-backed securities. A credit rating expresses the likelihood that the borrower will meet its financial obligations on time.
Investment-grade ratings (e.g., AAA, AA, A, BBB) suggest relatively low risk.
Speculative or junk ratings (BB, B, CCC, etc.) indicate higher risk.
1.2 Types of Ratings
Sovereign Ratings: Evaluate a country’s ability and willingness to repay debt.
Corporate Ratings: Assess credit quality of companies.
Structured Finance Ratings: Evaluate securities backed by assets (mortgages, loans, etc.).
1.3 Market Power of CRAs
Ratings are widely used because:
Institutional investors (pension funds, insurance companies, mutual funds) are often restricted by regulations to invest only in investment-grade securities.
Ratings influence risk premiums, spreads, and interest rates.
Global organizations like the IMF and World Bank rely on ratings for policy design and lending frameworks.
Thus, CRAs act as gatekeepers of global capital flows, determining which entities can access international markets and at what cost.
2. Role of Rating Agencies in Global Capital Flows
2.1 Facilitating Capital Allocation
In an interconnected financial system, investors require credible signals about where to allocate capital. Rating agencies reduce information asymmetry between borrowers and lenders by providing standardized risk assessments. For example:
A pension fund in Canada may consider investing in bonds issued by an infrastructure company in India. Without ratings, assessing risk across borders would be complex.
Ratings provide a benchmark for investors who may lack detailed knowledge about local markets.
2.2 Determining Borrowing Costs
Ratings directly impact interest rates.
A sovereign with an AAA rating can borrow internationally at very low interest rates.
Conversely, a country downgraded to “junk” status faces higher costs and reduced investor appetite.
Example: Greece’s sovereign debt crisis (2010–2012) showed how downgrades led to skyrocketing bond yields and loss of market access.
2.3 Shaping Sovereign Debt Markets
Sovereign ratings are crucial for emerging and developing economies seeking external financing. They:
Influence foreign direct investment (FDI) and portfolio inflows.
Affect perceptions of political stability and governance.
Serve as benchmarks for corporate borrowers in the same country.
If a sovereign rating is downgraded, often domestic corporations are automatically penalized since their creditworthiness is tied to the country’s risk profile.
2.4 Impact on Capital Market Development
Rating agencies encourage capital market deepening by:
Providing credible assessments that attract foreign investors.
Supporting development of local bond markets by setting credit benchmarks.
Enabling securitization and structured finance.
For example, Asian countries after the 1997–98 financial crisis used sovereign ratings to attract stable international capital for infrastructure financing.
2.5 Acting as “Gatekeepers” in Global Finance
Because many regulatory frameworks link investment eligibility to ratings, CRAs effectively decide who can tap global pools of capital.
A downgrade below investment grade can trigger forced selling by institutional investors.
Upgrades attract capital inflows by expanding the base of eligible investors.
Thus, they not only influence prices but also capital mobility across borders.
3. Case Studies on Ratings and Capital Flows
3.1 Asian Financial Crisis (1997–98)
Before the crisis, CRAs maintained relatively favorable ratings for Asian economies despite growing imbalances. When the crisis erupted, they issued sharp downgrades, accelerating capital flight.
Criticism: Ratings were lagging indicators rather than predictors.
Impact: Countries like Thailand, Indonesia, and South Korea saw capital outflows magnified by sudden rating downgrades.
3.2 Argentina Debt Crisis (2001 & 2018)
Argentina’s sovereign debt rating was repeatedly downgraded during its fiscal crisis, pushing borrowing costs higher.
Investors pulled out en masse after downgrades to junk status.
Access to international markets dried up, forcing defaults.
3.3 Eurozone Debt Crisis (2010–2012)
Countries like Greece, Portugal, and Ireland experienced downgrades that worsened their debt sustainability.
Rating actions led to a self-fulfilling prophecy: downgrades → higher borrowing costs → deeper fiscal distress.
EU regulators accused CRAs of procyclicality, meaning they intensified crises instead of stabilizing markets.
3.4 Subprime Mortgage Crisis (2007–2008)
CRAs assigned high ratings to mortgage-backed securities (MBS) that later collapsed.
Resulted in massive misallocation of global capital.
Global investors trusted AAA-rated securities that were actually risky.
This highlighted the conflict of interest in the “issuer-pays” model, where companies pay for their own ratings.
4. Benefits of Rating Agencies in Capital Flows
Reduce Information Asymmetry: Provide standardized, comparable measures of risk.
Enable Cross-Border Investment: Facilitate capital flows by offering risk assessments across jurisdictions.
Support Market Liquidity: Ratings enhance tradability of securities by offering confidence to investors.
Encourage Market Discipline: Poor governance or weak policies may be punished with downgrades, pressuring governments to maintain sound macroeconomic frameworks.
Benchmarking Role: Provide reference points for pricing bonds, derivatives, and risk models.
5. Criticisms and Challenges
5.1 Procyclicality
CRAs often amplify financial cycles.
During booms, they assign excessively high ratings, encouraging inflows.
During downturns, they downgrade abruptly, worsening outflows.
5.2 Conflicts of Interest
The issuer-pays model creates bias: issuers pay CRAs for ratings, leading to inflated assessments.
5.3 Over-Reliance by Regulators
International financial regulations (e.g., Basel Accords) embed credit ratings into capital requirements. This gives CRAs outsized influence and encourages investors to rely uncritically on ratings.
5.4 Lack of Transparency
Methodologies are often opaque, making it difficult to understand rating decisions.
5.5 Geopolitical Bias
Emerging economies often argue that rating agencies, largely based in the US and Europe, display Western bias, leading to harsher ratings compared to developed economies with similar fundamentals.
5.6 Systemic Risks
Errors in ratings can misallocate trillions of dollars in global capital. The 2008 crisis is the most striking example.
6. Regulatory Reforms and Alternatives
6.1 Post-2008 Reforms
Dodd-Frank Act (US): Reduced regulatory reliance on ratings.
European Union: Increased supervision of CRAs via the European Securities and Markets Authority (ESMA).
IOSCO Principles: Set global standards for transparency, governance, and accountability.
6.2 Calls for Diversification
Development of regional rating agencies (e.g., China’s Dagong Global).
Use of market-based indicators (bond spreads, CDS prices) as complements to ratings.
Encouraging investor due diligence instead of blind reliance.
6.3 Technological Alternatives
Use of big data analytics and AI-driven credit assessment.
Decentralized financial platforms may reduce reliance on centralized CRAs.
7. The Way Forward
Balanced Role: CRAs should provide guidance without becoming the sole determinants of capital flows.
Greater Accountability: Legal and regulatory frameworks must hold rating agencies responsible for negligence or misconduct.
Enhanced Transparency: Methodologies and assumptions should be disclosed to prevent opaque judgments.
Diversification of Voices: Regional agencies and independent research firms should complement dominant players.
Investor Education: Encouraging critical evaluation rather than over-reliance on ratings.
Conclusion
Credit rating agencies hold immense power over global capital flows. Their assessments determine borrowing costs, investor confidence, and even the economic destiny of nations. On the positive side, they reduce information asymmetry, facilitate cross-border investment, and provide benchmarks for global markets. On the negative side, their procyclicality, conflicts of interest, and opaque methodologies have at times worsened financial crises and distorted capital allocation.
The history of financial crises from Asia in 1997 to the subprime meltdown in 2008 illustrates both the necessity and the dangers of CRAs. While reforms have sought to improve accountability and transparency, the global financial system remains deeply influenced by their ratings.
The way forward lies in diversification of risk assessment mechanisms, greater transparency, and reduced regulatory over-reliance on CRAs. In doing so, global capital flows can be guided more efficiently, fairly, and sustainably, ensuring that they support economic growth rather than exacerbate instability.

Rare Earth Metals & Geopolitical ImportanceIntroduction
In the 21st century, natural resources continue to shape geopolitics, economic power, and technological advancement. Just as oil defined much of the 20th century’s geopolitical struggles, rare earth metals (REMs) are increasingly being seen as the strategic resource of the digital and green-energy era. These 17 chemically similar elements—scattered in nature yet crucial for modern technologies—have become central to industries ranging from defense systems and electronics to renewable energy and electric mobility.
The geopolitical importance of rare earth metals arises from their scarcity in economically viable concentrations, their critical role in high-tech applications, and the fact that global production is highly concentrated in a few countries, particularly China. This combination of economic necessity and strategic vulnerability makes rare earth metals one of the most contested resources of our time.
This essay explores the science, applications, production dynamics, geopolitical tensions, and future outlook of rare earth metals. By the end, it becomes clear why these “hidden metals” are at the heart of modern geopolitics.
1. Understanding Rare Earth Metals
1.1 What Are Rare Earth Metals?
Rare earth metals are a group of 17 elements on the periodic table, specifically the 15 lanthanides plus scandium and yttrium. Despite their name, they are not particularly rare in the Earth’s crust. In fact, elements such as cerium are more abundant than copper. What makes them “rare” is that they are rarely found in concentrated, economically minable deposits. Extracting them is technically challenging and environmentally damaging, making supply chains vulnerable.
1.2 Types of Rare Earth Elements
They are typically divided into two categories:
Light Rare Earth Elements (LREEs): Lanthanum, cerium, praseodymium, neodymium, promethium, and samarium.
Heavy Rare Earth Elements (HREEs): Europium, gadolinium, terbium, dysprosium, holmium, erbium, thulium, ytterbium, lutetium, plus yttrium.
HREEs are generally scarcer and more geopolitically significant because they are harder to find and extract.
1.3 Properties That Make Them Critical
Rare earths have unique magnetic, luminescent, and electrochemical properties. For example:
Neodymium produces powerful permanent magnets.
Europium provides the red color in LED and display technologies.
Dysprosium improves magnet performance at high temperatures.
Lanthanum is used in camera lenses and batteries.
Such applications make them essential in modern life, often irreplaceable.
2. Strategic Applications of Rare Earth Metals
2.1 Consumer Electronics
Smartphones, laptops, tablets, and televisions rely heavily on rare earths. A smartphone alone may contain up to 8–10 different rare earth elements for screens, vibration motors, and microelectronics.
2.2 Renewable Energy
Wind turbines: Use large amounts of neodymium and dysprosium in permanent magnets.
Solar panels: Depend on cerium and europium for polishing glass and improving efficiency.
Electric vehicles (EVs): Motors require neodymium, praseodymium, and dysprosium.
The global push toward net-zero emissions is driving up rare earth demand exponentially.
2.3 Defense and Aerospace
Rare earths are essential in defense systems:
Jet engines (yttrium, europium)
Precision-guided munitions (neodymium magnets)
Communication systems
Radar and sonar technology
The U.S. Department of Defense considers them critical for national security.
2.4 Medical Technologies
MRI machines, X-ray intensifiers, and other diagnostic devices rely on rare earths such as gadolinium.
2.5 Industrial Uses
Catalysts in oil refining, glass polishing, and metallurgy all depend on rare earths, making them indispensable for both civilian and industrial economies.
3. Global Production and Supply Chain
3.1 China’s Dominance
China is the world’s largest producer of rare earths, accounting for 60–70% of global production and nearly 85–90% of processing capacity. This dominance emerged in the 1990s when China deliberately underpriced rare earth exports, forcing competitors in the U.S. and elsewhere to shut down due to environmental costs and unprofitability.
By controlling not just mining but also refining and manufacturing, China has become the hub of the rare earth supply chain.
3.2 Other Producers
United States: Mountain Pass mine in California is the largest rare earth mine outside China but depends on China for refining.
Australia: Lynas Corporation is a major non-Chinese producer.
India, Russia, Myanmar, and Brazil also contribute but at smaller scales.
3.3 Supply Chain Vulnerabilities
Mining rare earths is only the first step. Refining and separation are highly complex, and China’s near-monopoly over processing makes the global supply chain fragile. Disruptions in China could impact industries worldwide, from EVs to defense systems.
4. Environmental and Social Implications
4.1 Environmental Damage
Rare earth mining is associated with severe environmental impacts:
Radioactive waste (thorium and uranium traces).
Water pollution from acid leaching.
Deforestation and land degradation.
China’s Baotou region, a hub for rare earth mining, has been heavily polluted, leading to health and ecological crises.
4.2 Local Community Impact
Communities around rare earth mines face displacement, water scarcity, and long-term health risks. Balancing demand with sustainable mining practices remains a global challenge.
5. Geopolitical Importance
5.1 Rare Earths as a Strategic Resource
Like oil in the 20th century, rare earths are now “strategic resources.” Countries reliant on imports are vulnerable to supply disruptions, price manipulation, and geopolitical bargaining.
5.2 China’s Leverage
China has used rare earths as a geopolitical tool:
In 2010, China restricted exports to Japan amid territorial disputes, crippling Japan’s high-tech industry temporarily.
China has hinted at restricting supply to the U.S. during trade tensions.
Such actions demonstrate how resource control translates into geopolitical influence.
5.3 U.S. and Western Response
The U.S., EU, Japan, and Australia have launched initiatives to reduce dependency on China. These include:
Strategic stockpiling of rare earths.
New mining projects in Africa, Greenland, and Australia.
Research into recycling and substitutes for rare earths.
However, creating a parallel supply chain is costly and time-consuming.
5.4 Role in Green Energy Transition
As nations push for renewable energy and electric vehicles, rare earths are becoming central to climate policy. This adds another layer of geopolitical competition, as access to rare earths could determine leadership in green technology.
6. Emerging Geopolitical Trends
6.1 Resource Nationalism
Countries rich in rare earth deposits, such as Myanmar, Vietnam, and African nations, are increasingly asserting control. They see rare earths as a path to economic growth and geopolitical relevance.
6.2 Strategic Alliances
The Quad Alliance (U.S., India, Japan, Australia) has discussed collaboration in rare earth supply chains to counterbalance China. The EU is also exploring partnerships with African and Latin American producers.
6.3 Competition in the Arctic
Greenland has significant rare earth deposits. With melting ice making access easier, both China and Western nations are vying for influence in the Arctic region.
6.4 Technological Race
Nations are investing in R&D to find alternatives to rare earths or to improve recycling technologies. Whoever leads in this race could reduce dependence on geopolitically unstable supply chains.
7. Future Outlook
7.1 Demand Projections
The demand for rare earths is projected to triple by 2040, driven by:
Electric vehicles
Renewable energy installations
Advanced military technology
This means competition will intensify.
7.2 Recycling and Circular Economy
Recycling rare earths from e-waste and magnets offers a partial solution. However, technical and economic barriers remain significant.
7.3 Substitutes and Innovation
Some research is focused on developing magnet technologies that reduce reliance on rare earths. Success in this area could reshape the geopolitical importance of these elements.
7.4 Multipolar Supply Chains
Efforts by Australia, the U.S., and Europe to build alternative refining and mining operations could reduce China’s dominance over time, though it will take decades.
8. Case Studies
8.1 Japan’s Strategy Post-2010
After China restricted exports in 2010, Japan diversified its supply by investing in mines in Vietnam and Australia. It also accelerated recycling technologies, making Japan less vulnerable today.
8.2 U.S. Strategic Stockpiling
The U.S. Defense Production Act has been used to stockpile rare earths, particularly for defense applications, highlighting their importance in national security.
8.3 Africa as a Future Powerhouse
Countries like Malawi, Tanzania, and Madagascar hold significant deposits. China has already invested heavily in African mines, but Western nations are increasing their presence to secure supply.
9. Challenges Ahead
Balancing environmental concerns with rising demand.
Avoiding overdependence on a single producer nation.
Managing geopolitical rivalries without triggering resource wars.
Ensuring fair distribution of benefits for resource-rich but economically poor nations.
Conclusion
Rare earth metals are the invisible backbone of the digital, defense, and green revolutions. They may not dominate headlines like oil, but they are no less critical to global security and economic stability. Their importance lies not only in their industrial applications but also in the geopolitical leverage they confer upon producing nations.
As the world transitions toward renewable energy and advanced technologies, rare earths will become even more strategic. The competition over access, processing, and innovation will define geopolitical alignments in the coming decades. Nations that secure stable supply chains and invest in sustainable alternatives will gain a decisive advantage in the 21st-century global order.
In many ways, rare earths are the new oil—quietly powering economies, shaping foreign policies, and fueling the next era of great power competition.

Global Agricultural Commodities MarketWhat Are Agricultural Commodities?
Agricultural commodities are raw, unprocessed products grown or raised to be sold or exchanged. They fall broadly into two categories:
Food Commodities
Grains & cereals: Wheat, rice, maize, barley, oats.
Oilseeds: Soybeans, rapeseed, sunflower, groundnut.
Fruits & vegetables: Bananas, citrus, potatoes, onions.
Livestock & animal products: Beef, pork, poultry, dairy, eggs.
Tropical commodities: Coffee, cocoa, tea, sugar.
Non-Food Commodities
Fibers: Cotton, jute, wool.
Biofuel crops: Corn (ethanol), sugarcane (ethanol), palm oil, soy oil (biodiesel).
Industrial crops: Rubber, tobacco.
These commodities are traded on spot markets (immediate delivery) and futures markets (contracts for future delivery). Futures trading, which developed in places like Chicago and London, allows farmers and buyers to hedge against price fluctuations.
Historical Context of Agricultural Commodities Trade
Ancient Trade: The Silk Road and spice trade routes included agricultural goods like rice, spices, and tea. Grain storage and trade were central to the Roman Empire and ancient Egypt.
Colonial Era: European colonial powers built empires around commodities like sugar, cotton, tobacco, and coffee.
20th Century: Mechanization, the Green Revolution, and globalization expanded agricultural production and trade.
21st Century: Digital platforms, biotechnology, and sustainability initiatives shape modern agricultural commodity markets.
This long history shows how agriculture is not just economic, but political and cultural.
Key Players in the Global Agricultural Commodities Market
Producers (Farmers & Agribusinesses): Smallholder farmers in Asia and Africa; large-scale industrial farms in the U.S., Brazil, and Australia.
Traders & Merchants: Multinational corporations known as the ABCD companies—Archer Daniels Midland (ADM), Bunge, Cargill, and Louis Dreyfus—dominate global grain and oilseed trade.
Governments & Agencies: World Trade Organization (WTO), Food and Agriculture Organization (FAO), national agricultural boards.
Financial Institutions & Exchanges: Chicago Board of Trade (CBOT), Intercontinental Exchange (ICE), and hedge funds/speculators who trade futures.
Consumers & Industries: Food processing companies, retailers, biofuel producers, and ultimately, households.
Major Agricultural Commodities and Their Markets
1. Cereals & Grains
Wheat: Staple for bread and pasta, major producers include Russia, the U.S., Canada, and India.
Rice: Lifeline for Asia; grown largely in China, India, Thailand, and Vietnam.
Corn (Maize): Used for food, feed, and ethanol; U.S. and Brazil dominate exports.
2. Oilseeds & Oils
Soybeans: Key protein for animal feed; U.S., Brazil, and Argentina lead.
Palm Oil: Major in Indonesia and Malaysia; used in food and cosmetics.
Sunflower & Rapeseed Oil: Important in Europe, Ukraine, and Russia.
3. Tropical Commodities
Coffee: Produced mainly in Brazil, Vietnam, Colombia, and Ethiopia.
Cocoa: Critical for chocolate; grown in West Africa (Ivory Coast, Ghana).
Sugar: Brazil, India, and Thailand dominate.
4. Livestock & Dairy
Beef & Pork: U.S., Brazil, China, and EU major players.
Poultry: Fastest-growing meat sector, strong in U.S. and Southeast Asia.
Dairy: New Zealand, EU, and India lead in milk and milk powder exports.
5. Fibers & Industrial Crops
Cotton: Vital for textiles; India, U.S., and China are leading producers.
Rubber: Largely grown in Southeast Asia for tires and industrial use.
Factors Influencing Agricultural Commodity Markets
Weather & Climate: Droughts, floods, hurricanes, and heatwaves strongly affect supply.
Technology: Mechanization, biotechnology (GM crops), digital farming, and precision agriculture boost productivity.
Geopolitics: Wars, sanctions, and trade disputes disrupt supply chains (e.g., Russia-Ukraine war and wheat exports).
Currency Fluctuations: Commodities are priced in USD; exchange rates impact competitiveness.
Government Policies: Subsidies, tariffs, price supports, and export bans affect markets.
Consumer Demand: Rising demand for protein, organic food, and biofuels shapes production.
Speculation: Futures and derivatives markets amplify price volatility.
Supply Chain of Agricultural Commodities
Production (Farmers).
Collection (Local traders & cooperatives).
Processing (Milling, crushing, refining).
Storage & Transportation (Warehouses, silos, shipping lines).
Trading & Export (Grain merchants, commodity exchanges).
Retail & Consumption (Supermarkets, restaurants, households).
The supply chain is global—soybeans grown in Brazil may feed livestock in China, which supplies meat to Europe.
Global Trade in Agricultural Commodities
Top Exporters: U.S., Brazil, Argentina, Canada, EU, Australia.
Top Importers: China, India, Japan, Middle East, North Africa.
Trade Routes: Panama Canal, Suez Canal, Black Sea, and major ports like Rotterdam, Shanghai, and New Orleans.
Agricultural trade is often uneven—developed nations dominate exports, while developing nations rely heavily on imports.
Price Volatility in Agricultural Commodities
Agricultural commodities are highly volatile due to:
Seasonal cycles of planting and harvest.
Weather shocks (El Niño, La Niña).
Energy prices (fertilizers, transport).
Speculative trading on futures markets.
Volatility impacts both farmers’ incomes and consumers’ food security.
Role of Futures and Derivatives Markets
Commodity exchanges such as CBOT (Chicago), ICE (New York), and NCDEX (India) allow:
Hedging: Farmers and buyers reduce risk by locking in prices.
Speculation: Traders bet on price movements, adding liquidity but also volatility.
Price Discovery: Futures prices signal supply-demand trends.
Challenges Facing the Global Agricultural Commodities Market
Climate Change: Increased droughts, floods, and pests reduce yields.
Food Security: Rising global population (10 billion by 2050) requires 50% more food production.
Trade Wars & Protectionism: Export bans (e.g., rice from India, wheat from Russia) destabilize markets.
Sustainability: Deforestation for soy and palm oil, pesticide use, and water scarcity are major concerns.
Market Power Concentration: Few large corporations dominate, raising fairness concerns.
Infrastructure Gaps: Poor roads, ports, and storage in developing nations lead to waste.
Future Trends in Agricultural Commodities Market
Sustainability & ESG: Demand for eco-friendly, deforestation-free, and fair-trade commodities.
Digitalization: Blockchain for traceability, AI for crop forecasting, precision farming.
Biofuels & Renewable Energy: Growing role of corn, sugarcane, and soy in energy transition.
Alternative Proteins: Lab-grown meat, plant-based proteins reducing demand for livestock feed.
Regional Shifts: Africa emerging as a key producer and consumer market.
Climate-Resilient Crops: GM crops resistant to drought, pests, and diseases.
Case Studies
Russia-Ukraine War (2022–2025): Disrupted global wheat, corn, and sunflower oil supply, driving food inflation.
COVID-19 Pandemic (2020): Supply chain breakdowns exposed vulnerabilities in agricultural trade.
Palm Oil in Indonesia: Tensions between economic growth and environmental concerns over deforestation.
Conclusion
The global agricultural commodities market is one of the most important pillars of the world economy. It determines food security, influences geopolitics, and drives livelihoods for billions of farmers. However, it is also one of the most vulnerable markets—shaped by climate change, population growth, technological advances, and political instability.
In the future, balancing food security, sustainability, and fair trade will be the central challenge. With the right policies, innovation, and cooperation, agricultural commodity markets can continue to feed the world while protecting the planet.

Energy Transition & Commodity MarketsSection 1: Understanding the Energy Transition
1.1 Definition
Energy transition is the process of moving from an energy system dominated by fossil fuels to one that relies on low-carbon and renewable energy sources. Unlike past energy transitions (from wood to coal in the Industrial Revolution, or from coal to oil in the 20th century), today’s transition is policy-driven and environmentally motivated, with the goal of achieving net zero carbon emissions by mid-century.
1.2 Drivers of Energy Transition
Climate Change Mitigation: To limit global warming to 1.5–2°C, greenhouse gas emissions must be drastically reduced.
Technological Innovation: Falling costs of solar, wind, batteries, and green hydrogen are accelerating adoption.
Energy Security: Dependence on imported fossil fuels creates vulnerabilities; renewables offer greater resilience.
Investor & Consumer Demand: ESG (Environmental, Social, and Governance) investing and rising public awareness are pushing corporations to decarbonize.
1.3 Key Pillars
Electrification of transport and industry
Renewable energy deployment
Energy efficiency improvements
Carbon capture and storage (CCS)
Hydrogen economy development
Section 2: Commodity Markets – An Overview
Commodity markets are broadly divided into:
Energy Commodities – oil, natural gas, coal.
Metals & Minerals – iron ore, copper, aluminum, lithium, cobalt, nickel, rare earths.
Agricultural Commodities – grains, oilseeds, sugar, biofuels (ethanol, biodiesel).
Commodity markets are crucial because they:
Provide raw materials for energy systems.
Influence inflation, currency stability, and trade balances.
Reflect global supply-demand dynamics and geopolitical risks.
As energy transition reshapes global energy flows, commodity markets are entering a new cycle of volatility, opportunities, and risks.
Section 3: Fossil Fuels in Transition
3.1 Oil
Oil has been the dominant energy commodity for decades, but demand growth is slowing.
Short-term Outlook: Oil remains essential for transportation, petrochemicals, and aviation.
Long-term Outlook: EV adoption, efficiency improvements, and policies to phase out ICE (internal combustion engine) vehicles could lead to peak oil demand by 2030–2040.
Impact: Oil-exporting countries may face revenue shocks, while diversification becomes urgent.
3.2 Natural Gas
Often seen as a “bridge fuel”, natural gas emits less CO₂ than coal and oil.
Role in Transition: Supports grid stability as renewables expand; key in hydrogen production (blue hydrogen).
Risks: Methane leakage undermines its climate benefits; long-term role uncertain.
3.3 Coal
Coal is the biggest loser in the energy transition.
Decline: Many advanced economies are phasing out coal due to high carbon intensity.
Exceptions: Some Asian countries still rely on coal for cheap electricity.
Impact: Coal markets are shrinking; future limited to metallurgical coal for steelmaking.
Section 4: Green Metals and Minerals
The clean energy revolution is metal-intensive. According to the International Energy Agency (IEA), a typical EV requires 6 times more minerals than a conventional car, while a wind farm needs 9 times more mineral resources than a gas-fired plant.
4.1 Copper
Used in wiring, EV motors, and renewable energy grids.
Copper demand expected to double by 2040.
4.2 Lithium
Key for lithium-ion batteries in EVs and storage.
Demand projected to increase over 40 times by 2040.
4.3 Cobalt
Critical in high-density batteries.
Supply concentrated in the Democratic Republic of Congo (DRC), raising geopolitical and ethical concerns.
4.4 Nickel
Important for battery cathodes.
Growing demand in EV sector; Indonesia emerging as a dominant supplier.
4.5 Rare Earth Elements (REEs)
Essential for wind turbines, EV motors, and defense technologies.
Supply dominated by China, creating potential geopolitical risks.
Section 5: Renewable Energy & Commodity Linkages
5.1 Solar Power
Relies heavily on silicon, silver, aluminum, and glass.
Commodity markets for silver are increasingly influenced by solar demand.
5.2 Wind Energy
Requires large amounts of steel, copper, and rare earths.
Offshore wind is even more metal-intensive than onshore.
5.3 Hydrogen Economy
Green hydrogen needs renewable electricity and electrolyzers (requiring platinum, iridium).
Blue hydrogen depends on natural gas and carbon capture.
5.4 Energy Storage
Batteries are the backbone of renewables integration.
Metals like lithium, cobalt, nickel, and graphite see exponential demand.
Section 6: Geopolitical and Economic Dimensions
6.1 Resource Nationalism
As green commodities rise in importance, countries rich in lithium, cobalt, and rare earths may adopt resource nationalism policies, similar to OPEC’s oil strategies.
6.2 Supply Chain Vulnerabilities
Concentration of rare earth supply in China.
Lithium reserves in South America’s “Lithium Triangle” (Argentina, Bolivia, Chile).
Cobalt dominated by DRC, raising human rights concerns.
6.3 Trade Wars & Strategic Competition
U.S. and Europe are investing in domestic critical mineral supply chains to reduce dependency.
Strategic competition may reshape global trade patterns.
Section 7: Financial Markets and Investment Trends
7.1 ESG Investing
Investors are shifting capital towards green energy and sustainable commodities.
Oil and coal financing becoming harder to secure.
7.2 Carbon Markets
Carbon pricing and emissions trading systems (ETS) affect fossil fuel demand.
Commodities linked to higher carbon footprints face declining attractiveness.
7.3 Commodity Price Volatility
Green transition is creating supercycles in certain metals.
Shortages may push prices higher, while substitution and recycling could stabilize markets.
Section 8: Challenges in the Energy Transition
8.1 Supply Constraints
Mining and refining capacity may lag demand.
Long lead times (10–15 years) for new mines.
8.2 Environmental & Social Risks
Mining expansion may harm ecosystems and local communities.
Human rights abuses in supply chains (child labor in cobalt mining).
8.3 Technology Uncertainty
Battery chemistry may shift, reducing reliance on certain metals.
Hydrogen adoption uncertain due to costs and infrastructure needs.
8.4 Policy Uncertainty
Inconsistent climate policies create market volatility.
Subsidy cuts or political shifts can slow adoption.
Section 9: Opportunities in the Transition
9.1 Green Commodity Supercycle
Metals like lithium, copper, and nickel could see decades of sustained demand growth.
9.2 Recycling and Circular Economy
Battery recycling could reduce dependence on virgin mining.
“Urban mining” of e-waste emerging as a new industry.
9.3 Technological Innovation
Advances in battery tech (solid-state batteries).
Substitutes for scarce materials (cobalt-free batteries).
9.4 Emerging Markets Growth
Developing countries rich in green resources may benefit from foreign investment.
Section 10: Future Outlook
The energy transition will not be linear; it will involve disruptions, volatility, and regional variations. However, the direction is clear:
Fossil fuels will gradually decline.
Metals and minerals critical to clean energy will dominate commodity markets.
Policies and geopolitics will heavily influence market outcomes.
By 2050, the global energy system could look dramatically different—one where electricity is the main energy vector, renewables provide the majority of supply, and commodity markets revolve around green resources rather than hydrocarbons.
Conclusion
The energy transition is reshaping the foundations of the global commodity markets. While fossil fuels are gradually losing ground, metals and minerals essential to renewable technologies are entering a period of unprecedented demand growth. This shift brings both challenges—such as supply constraints, geopolitical risks, and environmental concerns—and opportunities, including green investment booms, technological innovation, and sustainable growth.
Ultimately, the interplay between energy transition and commodity markets will define the economic and geopolitical landscape of the 21st century. Countries, companies, and investors that adapt swiftly will be the leaders of the new energy age, while those clinging to the old fossil-fuel paradigm risk being left behind.

Do Chart Patterns in Forex really Work?If you’ve been trading for a while, you’ve probably seen them: Head & Shoulders, Double Tops, Flags, Pennants, Wedges, Triangles.
They’re plastered across textbooks, YouTube tutorials, and trading courses as if they’re the secret key to unlocking market profits.
But let’s be brutally honest for a second…
Do these chart patterns actually work in Forex, or are we just drawing shapes on random price moves and calling it “analysis”?
This question has divided traders for decades. Some swear by chart patterns and build entire systems around them. Others call them illusions that only look good in hindsight. Let’s dig deeper.
Why Traders Believe in Chart Patterns
They Represent Market Psychology
A chart pattern isn’t just lines, it’s a visual story of buyer vs. seller psychology.
A Double Top represents a strong rejection of higher prices and often signals a potential reversal from bullish to bearish.
A Flag after a strong move shows a pause (profit-taking) before continuation.
These patterns give structure to the chaos of price action.
Risk-to-Reward Framework
Patterns give traders a ready-made blueprint for entries, stop losses, and targets.
For example, a triangle breakout trader knows exactly where the invalidation point is (back inside the triangle) and where the profit projection could be (measured move).
Self-Fulfilling Prophecy
This is perhaps the strongest argument. Because thousands of traders around the world believe in these patterns, they act on them and their collective actions make the patterns play out.
Why Chart Patterns Fail (Especially in Forex)
Subjectivity
A “perfect” pattern doesn’t exist.
What looks like a clean Double Top to one trader may look like noise to another.
Beginners often force patterns into charts that aren’t really there.
The lack of consistency is a big problem.
False Breakouts
Forex is notorious for liquidity hunts. Institutions know where breakout traders place their stops, and often price will fake out of a pattern before reversing.
Many traders lose money not because patterns don’t work, but because they take the first breakout without waiting for confirmation.
Lack of Statistical Evidence
Several academic studies and even backtests on historical data have shown mixed results.
Some patterns (like Flags) have slightly better-than-random odds.
Others (like Triangles) often fail as much as they succeed.
Without confluence, relying on patterns alone is like flipping a coin.
My Take, The Truth About Patterns
Patterns are not signals. They are frameworks for context.
Here’s the formula I believe in:
➡️ Pattern + Market Context + Confluence + Risk Management = Edge
Pattern: The shape itself (e.g., Head & Shoulders).
Market Context: Where it forms matters more than the pattern itself. Is it at a key supply/demand zone? Is it against the trend?
Confluence: Combine with liquidity, imbalances, order blocks, volume, or fundamentals.
Risk Management: Even the best setup fails sometimes. Stop losses and position sizing keep you in the game.
Trading patterns blindly is gambling.
Trading patterns with context and discipline is strategy.
Something Most Traders Don’t Realize
Patterns don’t predict the market, they reveal behaviour.
Think of them like a language of crowd psychology:
A Wedge isn’t predicting a breakout. It’s showing momentum is slowing and a big move is likely to come.
A Double Top isn’t magical, it’s just showing price struggled twice at the same resistance level.
A Flag doesn’t guarantee continuation, it simply shows a healthy pause in trend momentum.
The power comes from interpreting what the market is saying through the pattern, not from memorizing shapes like flashcards.
Discussion for the Community
This is where I’d love to hear from you:
Do YOU trade chart patterns?
If yes, which ones do you find most reliable in Forex?
Do you think patterns are useful, or are they overrated relics from the past?
Do you believe they’re “real” or just a self-fulfilling prophecy because enough traders act on them?
Bonus question: Have you ever backtested patterns systematically and what did you find?
📌 My goal here is to start an honest, evidence-based conversation about chart patterns. The more perspectives, the better so don’t hold back in the comments.
If you found this useful, hit that boost icon and thank you!
Bottom line:
Chart patterns are neither a scam nor a holy grail. They are tools and like any tool, their effectiveness depends on the skill of the trader using them.
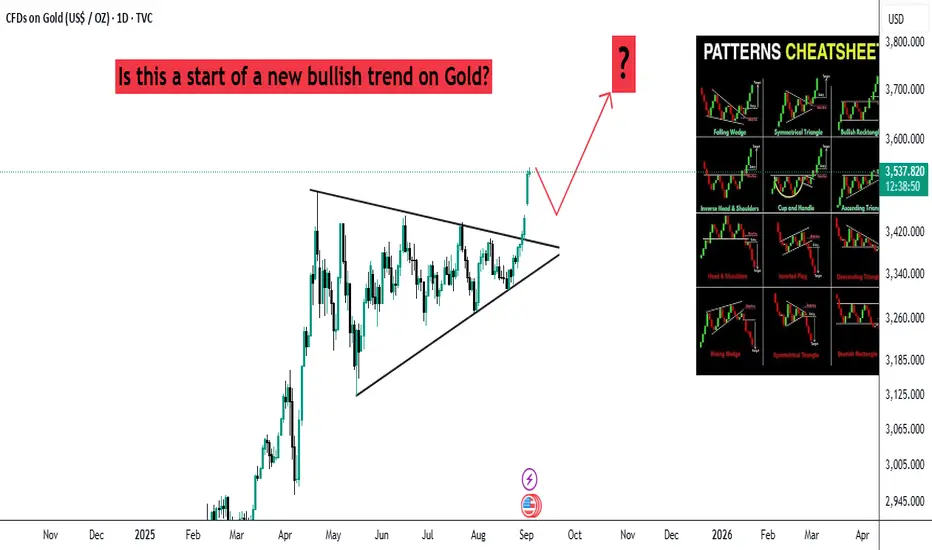
Food Security & Global Market PricesIntroduction
Food is the most fundamental human need, yet in the 21st century, billions of people still struggle with hunger, malnutrition, and unstable food access. At the same time, global markets heavily influence the price and availability of food commodities such as wheat, rice, corn, soybeans, and edible oils. The link between food security and global market prices has become one of the defining challenges of our era.
Food security, as defined by the Food and Agriculture Organization (FAO), exists when all people, at all times, have physical, social, and economic access to sufficient, safe, and nutritious food to meet their dietary needs and food preferences for an active and healthy life. Achieving this requires stability in production, affordability of prices, resilience against shocks, and equitable distribution.
Global market prices, meanwhile, are shaped by international trade, supply-demand balances, speculation in commodity markets, climate events, geopolitical conflicts, and policy decisions such as subsidies or export bans. When prices spike, food insecurity rises—especially in poorer countries where households spend a large share of their income on food.
This essay explores the intricate relationship between food security and global market prices, examining causes, consequences, and policy responses.
Section 1: Understanding Food Security
Food security rests on four pillars:
Availability – Adequate supply of food from domestic production or imports.
Access – Economic and physical access, meaning people can afford and obtain food.
Utilization – Proper nutrition, safety, and absorption of food in the body.
Stability – Reliable supply and access over time, without major disruptions.
Food insecurity emerges when any of these pillars is weak. For instance:
A drought may reduce availability.
Rising global prices can weaken access.
Poor sanitation or lack of dietary diversity can affect utilization.
Wars, conflicts, or pandemics disrupt stability.
Section 2: The Role of Global Market Prices in Food Security
Global markets set benchmarks for staple foods. Prices in Chicago, Paris, or Singapore often determine what wheat, rice, or soybeans cost in Africa, South Asia, or Latin America.
Why Prices Matter for Food Security
High Prices = More Hunger
When global food prices rise, poorer households reduce consumption or switch to less nutritious diets.
FAO estimates that the 2007–08 food price crisis pushed more than 100 million people into hunger.
Low Prices = Farmer Distress
While high prices hurt consumers, very low prices can harm small farmers, reducing their incomes and discouraging future production.
This creates a cycle of poverty, migration, and reduced agricultural investment.
Price Volatility
Unpredictable swings are as harmful as high prices. Farmers cannot plan their crops, governments struggle with food subsidy budgets, and traders hoard supplies, worsening instability.
Section 3: Historical Food Price Crises
1. The 1970s Oil Shock & Food Prices
Oil price hikes raised fertilizer, transport, and irrigation costs, driving global food inflation.
2. 2007–2008 Global Food Price Crisis
Wheat, rice, and maize prices doubled or tripled due to biofuel demand, export bans, and speculation.
Riots broke out in more than 30 countries, including Haiti, Egypt, and Bangladesh.
3. 2010–2011 Price Surge (Arab Spring Trigger)
Poor harvests in Russia and Ukraine, coupled with droughts, drove wheat prices higher.
Food inflation was a key factor fueling protests in Tunisia, Egypt, and across the Arab world.
4. COVID-19 Pandemic (2020–2022)
Supply chain disruptions, export restrictions, and labor shortages pushed food prices up.
Millions of urban poor in developing countries were hit hardest.
5. Russia–Ukraine War (2022–present)
Ukraine and Russia supply 30% of global wheat exports, 20% of maize, and 75% of sunflower oil.
The war disrupted Black Sea trade routes, triggering a surge in global grain prices.
Section 4: Key Drivers of Global Market Prices
Supply & Demand Imbalances
Rising demand for meat (China, India) increases feed grain demand.
Population growth (expected to reach 10 billion by 2050) pressures supplies.
Climate Change & Extreme Weather
Droughts in Africa, floods in South Asia, and wildfires in North America reduce output.
El Niño and La Niña cycles influence rainfall and crop yields globally.
Energy Prices
Oil prices affect fertilizer, irrigation, and transport costs.
Biofuel policies (e.g., ethanol in the US, biodiesel in Europe) divert grains from food to fuel.
Trade Policies
Export bans (India on rice, Russia on wheat) reduce global supply and spike prices.
Import tariffs and quotas distort markets further.
Speculation & Financialization of Commodities
Hedge funds and institutional investors increasingly trade food futures.
While providing liquidity, speculation can amplify price swings.
Geopolitical Conflicts & Wars
War zones reduce production (Ukraine) or block exports.
Sanctions can disrupt fertilizer supplies (Russia-Belarus potash).
Section 5: Food Security Challenges in Different Regions
Africa
Heavy reliance on imported wheat and rice.
Vulnerable to global price shocks due to weak currencies.
Climate shocks (drought in Horn of Africa) worsen hunger.
Asia
India: major producer but also restricts exports during inflation.
China: massive food demand, maintains large reserves.
Southeast Asia: rice-dependent economies vulnerable to export bans.
Middle East & North Africa (MENA)
Highly import-dependent (over 50% of food).
Price shocks linked to political unrest (Arab Spring).
Latin America
A food-exporting region (Brazil, Argentina) but faces domestic food inflation.
Export crops often prioritized over local food needs.
Developed Countries
More resilient due to subsidies and safety nets.
Still vulnerable to rising food inflation, affecting lower-income households.
Section 6: Consequences of Rising Food Prices
Hunger & Malnutrition
Poor families spend 50–70% of income on food.
Rising prices mean reduced meals, more stunting in children.
Social Unrest & Political Instability
Food riots, protests, and revolutions often follow price spikes.
Economic Strain on Governments
Higher subsidy bills (India’s food subsidy crosses billions annually).
Pressure on foreign reserves for food-importing countries.
Migration & Refugee Crises
Hunger drives rural-to-urban migration and cross-border displacement.
Section 7: Policy Responses to Balance Food Security & Prices
Global Cooperation
WTO rules to prevent arbitrary export bans.
FAO-led initiatives for transparency in food markets.
National Policies
Price stabilization funds and buffer stocks.
Social safety nets: food stamps, cash transfers, subsidized food.
Investment in Agriculture
Modern farming, irrigation, storage, and logistics.
Encouraging climate-resilient crops.
Sustainable Practices
Reduce food waste (1/3 of global food is wasted).
Diversify crops to reduce reliance on wheat/rice/maize.
Regional Food Reserves
ASEAN rice reserve mechanism.
African Union initiatives for emergency grain stocks.
Private Sector & Technology
Precision farming, AI-driven yield forecasts.
E-commerce platforms improving farmer-market linkages.
Section 8: The Future – Can We Ensure Food Security Amid Price Volatility?
By 2050, food demand will rise by 60–70%.
Climate change could reduce yields by 10–25% in some regions.
Global interdependence means local crises (Ukraine war, Indian export bans) ripple worldwide.
The challenge is balancing farmer incomes, consumer affordability, and global stability.
Promising solutions include:
Climate-smart agriculture.
International grain reserves.
Digital platforms for real-time price transparency.
Stronger trade cooperation and less protectionism.
Conclusion
Food security is deeply tied to global market prices. When markets are stable and predictable, people eat well, farmers earn fair incomes, and societies remain peaceful. But when prices spike due to conflict, climate change, or speculation, millions are pushed into hunger and political instability rises.
The future demands a balanced approach—ensuring affordable food for consumers, fair returns for farmers, and resilience in supply chains. Global cooperation, sustainable practices, and smart technology will be central to ensuring that food security is not left hostage to market volatility.
In short: food is not just a commodity—it is a foundation of human survival, dignity, and global stability.

Impact of War & Conflicts on Global TradeIntroduction
War and conflict have been recurring themes throughout human history, shaping civilizations, redrawing borders, and influencing the world economy. Among the many areas affected, global trade stands out as one of the most directly influenced domains. Trade thrives on stability, predictability, and cooperation across nations. When war or conflict disrupts these conditions, the impact ripples across supply chains, financial markets, production centers, and consumer behavior.
Global trade today is deeply interconnected, with goods, services, technology, and capital flowing across borders in complex networks. A regional war in one part of the world can disrupt global supply chains thousands of kilometers away. For instance, a conflict in the Middle East may lead to oil price spikes that affect manufacturing costs in Asia, transportation in Europe, and consumer prices in the Americas. Similarly, wars between major trading partners can lead to sanctions, trade restrictions, or complete breakdowns of commerce.
This essay explores the impact of wars and conflicts on global trade, examining historical and modern examples, economic consequences, sectoral disruptions, policy responses, and potential pathways to mitigate such risks.
1. Historical Context: Wars and Trade Disruptions
To understand the current dynamics, it is essential to look back at history. Wars have often determined trade patterns, both by destroying existing networks and by creating new ones.
1.1. Ancient Conflicts
In the Roman Empire, wars of expansion disrupted local economies but also opened up vast trade routes across Europe, the Middle East, and North Africa.
The Silk Road faced repeated interruptions during wars between empires, leading merchants to seek alternative maritime routes.
1.2. Colonial Wars
European colonial expansion was largely driven by trade interests in spices, gold, silver, and textiles. Wars between colonial powers (e.g., Britain and France) frequently disrupted global trade routes in the 17th and 18th centuries.
The Seven Years’ War (1756–1763) reshaped global trade by handing Britain dominance over colonies in North America and India, boosting its economic clout.
1.3. World Wars
World War I severely disrupted trade as maritime routes were blocked, naval blockades imposed, and global shipping shrank drastically.
World War II further devastated global commerce. Countries diverted industrial production to war efforts, international shipping was attacked, and colonies were cut off from their European rulers.
After WWII, however, new institutions like the IMF, World Bank, and GATT (later WTO) were established to stabilize trade and prevent such widespread disruption again.
2. Mechanisms of Disruption
War and conflict affect global trade through multiple direct and indirect mechanisms.
2.1. Physical Disruption of Supply Chains
Destruction of infrastructure such as ports, railways, highways, and airports halts the movement of goods.
Example: In the ongoing Russia–Ukraine war, destruction of Black Sea ports disrupted global grain exports.
2.2. Trade Barriers and Sanctions
Economic sanctions are a common tool of warfare today. They restrict trade flows and isolate nations.
Example: Western sanctions on Russia in 2022 led to bans on oil, gas, banking, and technology trade.
2.3. Energy Price Volatility
Wars in energy-rich regions trigger oil and gas supply shocks.
Example: The 1973 Arab–Israeli War caused the OPEC oil embargo, quadrupling global oil prices.
2.4. Currency Instability
War often leads to currency depreciation, inflation, and volatility in exchange rates. This discourages trade contracts and foreign investment.
2.5. Loss of Human Capital and Production
Conflict zones face reduced productivity as workers flee, factories shut down, and agricultural land is destroyed.
3. Case Studies of Modern Conflicts
3.1. Russia–Ukraine War (2022–Present)
Ukraine is a major exporter of wheat, corn, and sunflower oil. The war disrupted food exports, leading to shortages in Africa and Asia.
Russia, a key oil and gas supplier, faced sanctions, leading Europe to diversify energy imports toward the Middle East, Africa, and the US.
Shipping in the Black Sea became riskier, raising insurance and freight costs.
3.2. Middle East Conflicts
Persistent wars in the Middle East affect global oil supply. Even small disruptions raise oil prices due to the region’s strategic importance.
The Iran–Iraq War (1980–1988) disrupted Persian Gulf oil exports, pushing up global prices.
Recent Houthi attacks in the Red Sea have disrupted shipping routes through the Suez Canal, forcing rerouting via the Cape of Good Hope.
3.3. US–China Trade Tensions
Although not a conventional war, the US–China trade war (2018–2020) disrupted global trade by imposing tariffs on billions of dollars’ worth of goods.
Supply chains in electronics, textiles, and machinery were forced to relocate partially to countries like Vietnam, India, and Mexico.
3.4. African Conflicts
Civil wars in nations like the Democratic Republic of Congo have disrupted the supply of critical minerals such as cobalt, essential for batteries and electronics.
Piracy off the coast of Somalia (linked to instability) once threatened global maritime trade routes in the Indian Ocean.
4. Economic Consequences
4.1. Global Supply Chain Disruptions
Modern trade relies on just-in-time supply chains. Conflicts disrupt these, leading to shortages of semiconductors, food grains, or energy.
4.2. Inflation and Price Instability
War-related shortages push up commodity prices globally. For example, food inflation surged worldwide in 2022 due to the Ukraine war.
4.3. Decline in Global Trade Volume
According to the WTO, global merchandise trade tends to shrink during major wars and conflicts.
4.4. Trade Diversification
Nations often diversify away from conflict-affected suppliers. For example, Europe reduced dependence on Russian gas by importing LNG from the US and Qatar.
4.5. Unequal Impact on Nations
Developed countries often absorb shocks better through reserves and alternative sources. Developing nations, especially import-dependent ones, suffer disproportionately.
5. Sectoral Impact
5.1. Energy Sector
Oil and gas markets are the most sensitive to conflict. Wars in the Middle East, sanctions on Russia, and disputes in the South China Sea all affect energy flows.
5.2. Agriculture
Conflicts destroy farmlands and block exports. The Ukraine war showed how global food security is tied to regional stability.
5.3. Technology and Electronics
Semiconductor supply chains (Taiwan, South Korea) are highly vulnerable to potential conflicts. A war over Taiwan could cripple global electronics production.
5.4. Shipping and Logistics
Wars increase freight rates due to higher insurance premiums and rerouting costs.
Example: Ships avoiding the Suez Canal during Red Sea conflicts pay more in time and fuel.
5.5. Financial Services
Sanctions often target banks, cutting them off from systems like SWIFT. This hampers global transactions.
6. Policy Responses
6.1. Diversification of Supply Chains
Countries are increasingly moving toward “China+1” strategies to reduce dependency on one region.
6.2. Strategic Reserves
Nations maintain oil, gas, and food reserves to buffer against disruptions.
6.3. Trade Agreements and Alliances
Regional trade blocs (EU, ASEAN, CPTPP) help member countries secure trade during conflicts.
6.4. Investment in Domestic Production
Conflicts often push countries to revive domestic manufacturing for critical goods such as semiconductors and defense equipment.
6.5. Humanitarian Corridors
During conflicts, international organizations sometimes negotiate corridors for food and medicine trade to reduce civilian suffering.
7. Long-Term Effects
7.1. Redrawing Trade Routes
Wars can permanently shift trade patterns. Example: European reliance on Russian gas is unlikely to return to pre-2022 levels.
7.2. Rise of Protectionism
Conflicts push countries toward economic nationalism, prioritizing self-sufficiency over globalization.
7.3. Innovation in Trade Systems
Disruptions lead to innovations like alternative payment systems (e.g., Russia’s SPFS, China’s CIPS as alternatives to SWIFT).
7.4. Military-Industrial Boost
War economies often stimulate demand for weapons and defense technology, which becomes an export sector in itself.
8. Opportunities Emerging from Conflict
While the overall effect of war on trade is negative, certain industries or countries sometimes benefit:
Arms manufacturers experience a surge in exports.
Neutral nations can emerge as key alternative suppliers or trade hubs.
Countries like India and Vietnam gained manufacturing opportunities from US–China trade tensions.
9. Future Outlook: Trade in an Era of Geopolitical Uncertainty
As the world moves further into the 21st century, trade will remain deeply vulnerable to wars and conflicts. However, nations and corporations are learning to adapt through diversification, digitalization, and regional integration.
Key trends likely to shape the future include:
Regionalization of Trade – More trade within blocs (EU, ASEAN, BRICS) to reduce vulnerability.
Digital Trade – Growth of services, e-commerce, and remote business that are less affected by physical conflict.
Geoeconomic Competition – Nations will increasingly use trade as a tool of geopolitical rivalry, blending economics with national security.
Sustainability and Resilience – Greater emphasis on secure, sustainable supply chains over efficiency alone.
Conclusion
War and conflicts have always been among the most powerful disruptors of global trade. From the ancient Silk Road to modern semiconductor supply chains, conflicts reshape how nations exchange goods, services, and capital. While globalization has created unprecedented interdependence, it has also heightened vulnerability to disruptions.
The impact of wars on trade manifests in multiple ways: supply chain breakdowns, sanctions, energy crises, food insecurity, financial instability, and long-term shifts in trade patterns. The Russia–Ukraine war, Middle East conflicts, and US–China tensions are clear reminders that political instability in one region can send economic shockwaves worldwide.
However, trade is also resilient. Nations adapt by diversifying partners, building reserves, and investing in domestic capacity. The challenge for policymakers and businesses is to strike a balance between efficiency and resilience, ensuring that global trade continues even in times of uncertainty.
Ultimately, peace remains the greatest enabler of global commerce. As history shows, stable political relations foster economic prosperity, while wars not only destroy lives but also weaken the very foundation of global trade that supports human development.

Climate Change & Its Effect on Global MarketsIntroduction
Climate change is no longer just an environmental issue; it has become one of the most pressing economic challenges of our time. The increasing frequency of natural disasters, rising global temperatures, sea-level rise, and shifting weather patterns are not only affecting ecosystems but also shaking the foundations of global markets. Businesses, investors, policymakers, and governments are realizing that climate risks translate into economic risks. From agriculture to energy, from finance to manufacturing, every sector is vulnerable.
Global markets operate on stability, predictability, and growth. Climate change disrupts all three. As extreme weather events damage supply chains, droughts reduce agricultural productivity, floods displace communities, and wildfires threaten infrastructure, the costs to economies rise. Additionally, climate-related policies, carbon pricing mechanisms, green technologies, and changing consumer preferences are reshaping global trade and investment flows.
In this essay, we will explore the multifaceted effects of climate change on global markets, including direct economic costs, sectoral impacts, financial market risks, trade disruptions, and investment opportunities in the green economy. We will also analyze the role of governments, corporations, and international institutions in mitigating risks and shaping a sustainable future.
1. Understanding Climate Change as an Economic Risk
Climate change manifests in various forms—rising global average temperatures, melting ice caps, ocean acidification, extreme weather events, and shifts in rainfall patterns. While traditionally discussed in environmental and scientific terms, economists and market analysts now frame climate change as a systemic economic risk.
1.1 Physical Risks
Physical risks stem from the direct impact of climate change on assets, infrastructure, and supply chains. For example:
Hurricanes damaging oil refineries and ports.
Droughts reducing crop yields and increasing food prices.
Rising sea levels threatening coastal cities, ports, and real estate.
1.2 Transition Risks
Transition risks arise from the shift toward a low-carbon economy. Governments and corporations are under pressure to reduce carbon emissions. Policies such as carbon taxes, emissions trading schemes, and restrictions on fossil fuels can disrupt industries. For example:
Coal and oil companies losing market value.
Automakers investing heavily in electric vehicles (EVs).
Banks reconsidering lending to high-carbon industries.
1.3 Liability Risks
Companies may face lawsuits and compensation claims for contributing to climate change or failing to disclose climate-related risks. This is especially relevant for energy companies and corporations that knowingly pollute or understate their carbon footprint.
2. Climate Change & Sectoral Impacts on Global Markets
Different sectors are affected in different ways. Let us examine key industries:
2.1 Agriculture & Food Markets
Agriculture is highly climate-sensitive. Droughts, floods, and erratic rainfall affect crop yields. For instance:
Wheat and rice production in Asia is threatened by heatwaves.
Coffee and cocoa crops in Africa and Latin America are shifting to higher altitudes.
Fisheries are impacted by ocean warming and acidification.
This leads to food price volatility in global markets, affecting trade balances and creating inflationary pressures.
2.2 Energy Markets
Energy is central to climate change discussions. Fossil fuel demand is declining in developed economies, while renewable energy sources are expanding. Oil-exporting nations face revenue risks, while renewable energy industries like solar, wind, and hydropower attract massive investments.
The volatility of oil prices is no longer just geopolitical but also linked to climate policies. For example, announcements of net-zero commitments by large economies reduce investor confidence in long-term fossil fuel projects.
2.3 Real Estate & Infrastructure
Rising sea levels and extreme weather events threaten coastal cities. Real estate markets in regions like Miami, Bangkok, and Jakarta face declining property values. Insurance premiums for flood-prone areas are skyrocketing, affecting mortgage markets and construction industries.
2.4 Manufacturing & Supply Chains
Global supply chains are highly exposed to climate disruptions. For instance:
Floods in Thailand in 2011 disrupted global automobile and electronics supply chains.
Droughts in Taiwan affected semiconductor manufacturing due to water shortages.
This introduces volatility into global trade and stock markets.
2.5 Financial Services & Insurance
Banks, asset managers, and insurers are increasingly recognizing climate risks.
Insurance companies face rising claims from natural disasters.
Investors are shifting capital toward green bonds, ESG (Environmental, Social, Governance) funds, and sustainable infrastructure.
Central banks are assessing climate stress tests for financial institutions.
3. Climate Change & Global Trade
Climate change impacts global trade flows in multiple ways:
Resource Scarcity – Countries dependent on water-intensive crops may face shortages, forcing imports and changing trade patterns.
Energy Transition – Demand for fossil fuels is declining, while demand for lithium, cobalt, and rare earth metals (critical for EVs and batteries) is rising.
Maritime Trade Risks – Rising sea levels threaten major ports, while melting Arctic ice is opening new shipping routes, reshaping trade dynamics.
Carbon Border Taxes – The EU and other regions are introducing carbon border adjustment mechanisms (CBAM), taxing imports based on carbon footprints. This shifts competitiveness in global markets.
4. Financial Market Reactions
Global financial markets are increasingly pricing in climate risks.
Equity Markets: High-carbon companies like oil and coal firms see declining valuations. Meanwhile, renewable energy companies, EV makers, and green technology firms see rising stock prices.
Bond Markets: Green bonds are growing rapidly, financing renewable energy, sustainable infrastructure, and climate adaptation projects.
Commodity Markets: Weather volatility creates fluctuations in agricultural commodities like wheat, corn, and soybeans. Energy commodities like oil and gas face policy-driven demand shocks.
Insurance & Derivatives: Catastrophe bonds (CAT bonds) are being used to hedge climate disaster risks. Weather derivatives are also gaining attention.
5. Regional Impacts of Climate Change on Markets
5.1 Developed Economies
The EU is leading in carbon neutrality policies, creating new opportunities in green energy and circular economy industries.
The U.S. is investing heavily in clean energy, EVs, and climate resilience infrastructure.
Japan and South Korea are shifting toward hydrogen energy.
5.2 Emerging Markets
India faces both risks and opportunities: rising heat threatens agriculture, but renewable energy investment is booming.
China is the largest investor in green technologies but still heavily reliant on coal.
African economies dependent on agriculture are highly vulnerable to droughts and floods.
6. Opportunities in Climate Change
While climate change poses risks, it also creates enormous opportunities in new industries.
Renewable Energy – Solar, wind, hydro, and geothermal energy investments are surging.
Electric Vehicles (EVs) – Demand for EVs, batteries, and charging infrastructure is rising globally.
Sustainable Finance – ESG funds and green bonds are reshaping global capital flows.
Carbon Markets – Trading carbon credits is emerging as a billion-dollar industry.
Climate Tech Startups – Innovations in carbon capture, vertical farming, and water desalination are attracting venture capital.
7. Government & Institutional Role
7.1 Policy Interventions
Carbon Pricing: Through taxes or cap-and-trade systems.
Subsidies: For renewable energy and green technology adoption.
Regulations: Emission standards for vehicles, industries, and power plants.
7.2 International Cooperation
Paris Agreement: A global framework for emission reductions.
COP Summits: Annual climate conferences influencing global policy.
Trade Policies: Carbon border taxes, green trade agreements.
7.3 Central Banks & Financial Regulators
Institutions like the Bank of England and European Central Bank are incorporating climate risks into monetary policy, banking regulations, and financial stability assessments.
8. Long-Term Structural Changes in Global Markets
Climate change is accelerating structural changes in global markets:
Shift from fossil fuels to renewables.
Integration of ESG principles into investment decisions.
Redesign of supply chains to reduce climate exposure.
Urban planning focusing on climate resilience.
Emergence of circular economy models.
9. Case Studies
9.1 The 2011 Thailand Floods
Disrupted global automobile and electronics supply chains, costing billions to global corporations like Toyota, Honda, and Western Digital.
9.2 California Wildfires
Insurance companies faced record claims, while real estate markets in fire-prone areas saw declining values.
9.3 European Carbon Markets
The EU Emissions Trading System (ETS) became the world’s largest carbon market, pushing industries to reduce emissions and creating new investment products.
10. The Future of Global Markets in a Climate-Changed World
Looking ahead, climate change will increasingly dictate how global markets function.
By 2050, trillions of dollars may shift from fossil fuels to green energy.
Financial institutions that ignore climate risks may face systemic crises.
Countries leading in renewable technologies may dominate future global trade.
Companies failing to adapt to climate realities may lose competitiveness.
The global economy will transition toward sustainability, but the pace and effectiveness of this shift will determine how severe climate-related disruptions become.
Conclusion
Climate change is no longer a distant or abstract risk—it is a present and growing force reshaping global markets. From agriculture to finance, from trade to technology, every sector feels its impact. Market volatility, resource scarcity, and new regulatory landscapes make climate change a defining factor of 21st-century economics.
At the same time, climate change is driving innovation, creating new industries, and reshaping global capital flows. The transition toward renewable energy, sustainable finance, and resilient infrastructure offers both challenges and opportunities.
For investors, corporations, and policymakers, the key lies in recognizing that climate change is not just an environmental issue but a systemic economic transformation. Global markets that adapt early, invest in sustainability, and embrace green innovation will thrive in the new climate economy, while those that resist change may face significant losses.
In essence, climate change is rewriting the rules of global markets—and how humanity responds will determine not only the stability of economies but the future of our planet.