Shifts in Global Trade Patterns and Supply ChainsIntroduction: The New Dynamics of Global Trade
The 21st century has witnessed an unprecedented transformation in global trade patterns and supply chains. From the post–World War II dominance of Western industrial economies to the rise of Asia as the global manufacturing hub, and now to an era shaped by digitalization, sustainability, and geopolitical realignment, trade is no longer just about goods crossing borders—it’s about interconnected systems, data flows, and strategic dependencies.
The COVID-19 pandemic, escalating trade wars, and regional conflicts like the Russia–Ukraine war have further reshaped the global trade map, compelling nations and corporations to rethink where and how they source, produce, and distribute goods. Today’s supply chains are not just economic instruments but also political, environmental, and technological battlegrounds.
This essay explores how global trade patterns and supply chains are shifting—highlighting the key forces driving these changes, the regions gaining and losing influence, and the implications for the future of global commerce.
1. Historical Context: From Globalization to Strategic Localization
In the decades following the 1990s, globalization reached its peak. Corporations sought efficiency through offshoring—relocating production to countries with cheaper labor and favorable trade policies. China, in particular, became the “world’s factory,” while emerging economies like Vietnam, Bangladesh, and Mexico grew as secondary manufacturing centers.
However, this model also created vulnerabilities. The overdependence on a few key suppliers and logistical routes meant that any disruption—whether a natural disaster, pandemic, or political tension—could paralyze entire industries. The 2008 global financial crisis and the 2020 pandemic both exposed these structural weaknesses, sparking a paradigm shift from efficiency-driven globalization to resilience-driven regionalization.
This historical backdrop set the stage for today’s reconfiguration of global trade and supply chains.
2. The Decline of Traditional Globalization
The forces of globalization—free trade, open markets, and integrated supply networks—are no longer the sole organizing principles of world commerce. Instead, nations are turning inward or aligning with regional blocs.
Key drivers of this shift include:
Trade Protectionism: The US–China trade war initiated in 2018 marked a turning point. Tariffs on hundreds of billions of dollars’ worth of goods disrupted established supply chains and forced firms to reconsider sourcing strategies.
National Security Concerns: Sensitive technologies, semiconductors, and critical minerals are now treated as strategic assets. Countries are restricting exports and promoting domestic production to avoid dependency.
Pandemic Disruptions: COVID-19 halted global logistics, revealed the fragility of “just-in-time” supply chains, and accelerated the adoption of “just-in-case” models emphasizing inventory buffers and regional diversification.
As a result, global trade growth has slowed. According to the World Trade Organization (WTO), the share of global trade in GDP has plateaued since 2015, signaling a structural slowdown in hyper-globalization.
3. Regionalization and the Rise of New Trade Hubs
A major trend reshaping global trade is the regionalization of supply chains. Instead of sourcing components from far-flung regions, companies are building shorter, more localized networks to reduce risk and improve resilience.
Key examples include:
Asia-Pacific Integration: While China remains central, production is increasingly distributed across ASEAN nations—Vietnam, Indonesia, Malaysia, and Thailand. This “China + 1” strategy helps reduce dependency on Chinese manufacturing while keeping access to its vast ecosystem.
North American Reshoring: Under the USMCA (United States–Mexico–Canada Agreement), companies are bringing manufacturing closer to home, especially in sectors like electronics, autos, and semiconductors. Mexico, benefiting from proximity to the US, has emerged as a major reshoring destination.
European Realignment: The EU is striving for “strategic autonomy” by strengthening internal supply networks, investing in renewable energy, and reducing reliance on Russian gas and Chinese raw materials. Eastern European nations like Poland, Hungary, and the Czech Republic are gaining traction as nearshoring hubs.
Regionalization doesn’t mean de-globalization—it represents a reconfiguration where trade flows become more concentrated within strategic clusters rather than globally dispersed.
4. The Digital Revolution and Smart Supply Chains
Technology is fundamentally transforming how global supply chains operate. Digital tools—ranging from artificial intelligence (AI) and blockchain to the Internet of Things (IoT) and advanced data analytics—are making supply chains smarter, more transparent, and adaptive.
Key technological impacts include:
AI-driven demand forecasting: Firms now predict market shifts with greater precision, reducing overproduction and wastage.
Blockchain for traceability: This ensures transparency across complex multi-tier supplier networks, particularly vital in industries like pharmaceuticals, food, and luxury goods.
Automation and robotics: Advanced robotics and 3D printing are reducing the cost differential between developed and developing countries, encouraging some industries to “reshore” production.
Digital trade platforms: Cloud-based trade management systems are facilitating faster customs clearance and cross-border documentation.
Digitalization thus acts as a “force multiplier,” enabling efficiency even within shorter, regional supply chains.
5. Geopolitical Tensions and Strategic Supply Chains
Geopolitics now plays a decisive role in shaping global trade patterns. The rivalry between major powers—particularly the US and China—has spilled into areas like technology, finance, and infrastructure.
Examples of this geopolitical fragmentation include:
The US–China Tech War: Restrictions on semiconductor exports, Huawei’s global ban, and supply chain decoupling efforts in critical tech sectors.
The Russia–Ukraine Conflict: Disruption in global energy and food supplies led Europe to accelerate diversification away from Russian dependence and invest in renewable alternatives.
Taiwan’s Semiconductor Dominance: Taiwan’s TSMC produces over 60% of the world’s advanced chips, making it a geopolitical flashpoint. Nations are now racing to build domestic semiconductor capabilities.
Governments worldwide are responding with industrial policies—such as the US CHIPS Act and the EU’s Green Deal Industrial Plan—to strengthen domestic supply resilience and reduce strategic vulnerabilities.
6. Sustainability and Green Supply Chains
Sustainability has become another key pillar shaping global trade. Corporations and countries are now judged not just by efficiency but by environmental and social responsibility.
Emerging sustainability trends include:
Carbon Border Adjustments: The EU’s Carbon Border Adjustment Mechanism (CBAM) will impose tariffs on carbon-intensive imports, encouraging cleaner production methods globally.
Circular Supply Chains: Companies are reusing materials, recycling components, and designing products for longevity—reducing dependency on raw material imports.
Renewable Energy Integration: Nations are aligning trade policies with green energy goals, influencing logistics routes and energy-intensive production locations.
This “green reindustrialization” is creating new opportunities for economies investing in clean manufacturing and renewable technologies, while penalizing those relying heavily on fossil fuels.
7. Emerging Markets: The New Centers of Trade Gravity
While developed economies are reshaping strategies for security and sustainability, emerging markets are becoming the new growth engines of global trade.
India: With its large labor force, pro-manufacturing policies (like “Make in India”), and digital infrastructure, India is positioning itself as a credible alternative to China for global manufacturers.
Vietnam and Indonesia: Both are attracting massive FDI inflows in electronics, apparel, and automotive sectors as part of the “China + 1” diversification strategy.
Africa: The African Continental Free Trade Area (AfCFTA) is creating a single market of over a billion people, opening new avenues for intra-African trade and global partnerships.
Latin America: Mexico and Brazil are emerging as nearshoring hubs for North America and Europe respectively.
These shifts mark a rebalancing of global economic power, where trade is less dominated by a single country or region and more evenly distributed across multiple growth centers.
8. The Logistics Revolution: Ports, Corridors, and Connectivity
Global trade depends not only on production but also on transport and logistics. Recent developments show a massive reorientation of global transport networks.
Alternative Shipping Routes: The Russia–Ukraine war and tensions in the Red Sea have redirected maritime traffic toward longer but safer routes, impacting global shipping costs.
India–Middle East–Europe Economic Corridor (IMEC): Announced in 2023, this new trade corridor aims to counterbalance China’s Belt and Road Initiative by linking India with Europe via the Middle East.
Automation in Ports: Smart ports and AI-based logistics management are reducing turnaround times and improving efficiency in global trade routes.
The next phase of trade will rely on infrastructure intelligence—where logistics are powered by data, automation, and alternative energy.
9. Supply Chain Resilience: From Just-in-Time to Just-in-Case
The traditional “just-in-time” model—minimizing inventory to cut costs—proved fragile under recent crises. Today, supply chain resilience has become a corporate priority.
Resilience strategies include:
Diversification of suppliers and locations to avoid overreliance on one country.
Inventory buffers for critical materials like semiconductors, lithium, and rare earths.
Multi-shoring and friend-shoring—favoring trade with politically aligned or nearby nations.
Scenario planning and stress testing to anticipate disruptions.
Resilience no longer means inefficiency—it is an investment in stability and strategic independence.
10. The Future of Global Trade: Multipolar, Digital, and Sustainable
The future of global trade will be multipolar, digital, and sustainability-driven. Power will no longer be concentrated in one global hub like China or the US, but spread across multiple regional clusters—each specializing in distinct industries.
Key trends for the next decade include:
Expansion of digital trade agreements (like the Digital Economy Partnership Agreement, DEPA).
Integration of AI and data analytics for predictive supply chain management.
Growth of sustainable trade finance linked to ESG (Environmental, Social, Governance) metrics.
The rise of cross-border e-commerce as small businesses join global trade through digital platforms.
In essence, globalization is not disappearing—it is evolving into a more complex, technology-enabled network of regional and digital ecosystems.
Conclusion: The Great Reconfiguration
The global trade system is undergoing its most profound transformation in decades. The twin forces of geopolitical realignment and technological innovation are redrawing the map of commerce. Efficiency is no longer the sole metric of success—resilience, sustainability, and strategic autonomy now define the new era of global trade.
Nations that adapt to these shifts—by investing in technology, building sustainable industries, and forging resilient partnerships—will lead the next chapter of globalization. Meanwhile, those clinging to old models of cost-driven offshoring may find themselves sidelined in an increasingly fragmented but interconnected world.
The global trade landscape of the 2030s will thus be characterized not by the dominance of any single power, but by the emergence of a networked, multipolar world—where innovation, adaptability, and trust define the flow of goods, data, and ideas.
Harmonic Patterns

Defining Shadow Banking: Beyond Traditional FinanceIntroduction: The Rise of a Parallel Financial Universe
The modern financial system is far more complex than traditional banking institutions alone. Beyond the visible landscape of commercial banks, savings institutions, and central banks lies an intricate web of entities and mechanisms collectively known as the shadow banking system. This term, though somewhat misleading, refers not to illegal or secretive finance, but to a vast network of non-bank financial intermediaries that perform bank-like functions — such as credit intermediation, liquidity transformation, and maturity transformation — without being subject to the same regulatory oversight as traditional banks.
Shadow banking has grown exponentially over the past three decades, transforming from a peripheral market function into a core pillar of global finance. By the mid-2020s, the Financial Stability Board (FSB) estimated the size of the shadow banking sector to exceed $65 trillion globally, encompassing everything from money market funds, hedge funds, and private credit vehicles to structured finance products and fintech lending platforms. Its growth underscores both the innovation and risks embedded within modern financial markets.
Understanding Shadow Banking: A Conceptual Definition
At its core, shadow banking refers to credit intermediation that occurs outside the traditional banking system. In simpler terms, it’s about institutions that borrow funds and lend them out — just like banks — but without having access to central bank funding or deposit insurance protections.
The term “shadow” doesn’t imply illegitimacy; rather, it reflects the lack of regulatory transparency and indirect connection to formal monetary authorities. These entities can include:
Investment funds (hedge funds, private equity funds, venture capital, mutual funds)
Structured investment vehicles (SIVs)
Asset-backed securities (ABS) and collateralized debt obligations (CDOs)
Money market funds (MMFs)
Fintech platforms and peer-to-peer lenders
Insurance and pension funds engaged in credit intermediation
Collectively, these entities provide credit, liquidity, and investment opportunities across global markets — often operating with higher flexibility, leverage, and innovation than banks, but also carrying higher systemic risk.
The Evolution of Shadow Banking: From Innovation to Complexity
The shadow banking system did not emerge overnight. Its origins trace back to financial deregulation and innovation in the late 20th century.
1970s–1980s: The Birth of Market-Based Lending
During this period, banks faced restrictions on deposit interest rates and lending limits. As markets liberalized, non-bank entities started to fill the gaps by offering higher returns and more flexible credit. Money market funds became popular as safe alternatives to bank deposits.
1990s–2000s: The Era of Securitization
Financial institutions began to transform illiquid loans (like mortgages) into tradable securities, allowing risk to be distributed across investors globally. This process — known as securitization — became the backbone of shadow banking. Structured products like mortgage-backed securities (MBS) and CDOs attracted massive investment inflows, particularly from institutional investors.
2000s–2008: The Shadow Banking Boom and Crisis
Before the 2008 Global Financial Crisis (GFC), shadow banking had become deeply intertwined with traditional banks. Many banks funded their off-balance-sheet operations through shadow channels, leveraging short-term borrowing in wholesale markets. When liquidity dried up in 2008, the collapse of shadow banking chains amplified the crisis, revealing its systemic fragility.
Post-2008: Regulation and Re-emergence
After the GFC, regulators tightened banking supervision, inadvertently pushing risk-taking into the shadows once again. With stricter capital requirements on banks, credit migration occurred toward private credit funds, fintech lenders, and structured finance entities. By the 2020s, shadow banking had reinvented itself — more diversified, tech-driven, and global than ever.
Core Functions of Shadow Banking
Despite operating outside traditional frameworks, shadow banking serves crucial economic functions. Understanding these helps explain its resilience and attractiveness.
1. Credit Intermediation
Shadow banks channel savings into investments by lending to corporations, households, and governments. For example, private credit funds and securitization vehicles provide loans where banks might hesitate due to risk-weighted capital constraints.
2. Maturity Transformation
Similar to banks, shadow entities borrow short-term (e.g., through repurchase agreements or money markets) and lend long-term (e.g., mortgages, infrastructure loans). This creates liquidity but also exposes them to rollover risk — the inability to renew short-term funding during stress periods.
3. Liquidity Transformation
Through securitization and other mechanisms, illiquid assets are repackaged into marketable securities. This process enhances financial market efficiency but can distort true asset quality and risk perception.
4. Risk Transfer
Shadow banking allows risks to be distributed among investors rather than concentrated in banks. However, it also creates opacity, as risk becomes harder to trace and assess across the financial chain.
5. Market Innovation and Flexibility
Without the burden of heavy regulation, shadow entities can innovate rapidly. Fintech-based lending, decentralized finance (DeFi), and structured investment products owe their existence to this flexibility.
Major Components of the Shadow Banking Ecosystem
1. Money Market Funds (MMFs)
MMFs act as short-term investment vehicles that provide liquidity to borrowers and stable returns to investors. However, during crises, sudden redemptions can trigger liquidity squeezes, as seen in 2008 and during the COVID-19 panic of 2020.
2. Securitization Vehicles
Entities such as special purpose vehicles (SPVs) pool loans (mortgages, auto loans, etc.) and issue asset-backed securities. This helps lenders free up capital but makes the system vulnerable to cascading defaults if underlying assets deteriorate.
3. Hedge Funds and Private Credit
Hedge funds often engage in leveraged lending or credit arbitrage. Private credit funds have recently become major financiers of mid-sized businesses, filling gaps left by cautious banks.
4. Fintech and Peer-to-Peer (P2P) Lenders
Digital platforms like LendingClub, Upstart, or India’s NBFC-based fintechs offer fast, tech-enabled credit solutions. While democratizing finance, they also introduce cyber and data-driven risks.
5. Repurchase Agreements (Repo Markets)
Repos allow institutions to borrow short-term funds by pledging securities as collateral. Though efficient, they are central to shadow liquidity chains, making them a potential point of contagion.
Advantages of Shadow Banking: Why It Matters
Enhancing Credit Availability
Shadow banks often lend to sectors or borrowers overlooked by traditional banks — such as small businesses, startups, or subprime consumers — thereby supporting financial inclusion and economic growth.
Improving Market Liquidity
Through securitization and secondary markets, shadow entities increase liquidity, helping investors adjust portfolios efficiently.
Driving Innovation
By operating outside regulatory rigidity, shadow players have been the source of major financial innovations — from structured products to algorithmic lending models.
Diversifying Risk and Funding Sources
Shadow banking broadens funding channels, reducing dependence on the banking sector alone.
Risks and Challenges: The Dark Side of the Shadows
While shadow banking fuels financial dynamism, it also poses serious systemic risks.
1. Lack of Transparency and Regulation
Many shadow activities occur off-balance-sheet, making it difficult for regulators to monitor risk accumulation. This opacity can mask leverage and credit quality problems until it’s too late.
2. Liquidity Mismatch and Runs
Entities that borrow short-term and lend long-term are vulnerable to sudden funding withdrawals, leading to fire sales and contagion — much like a bank run, but without deposit insurance safety nets.
3. Interconnectedness with Traditional Banks
Though formally separate, shadow banks often rely on bank credit lines and repo funding, meaning shocks can quickly spill into the regulated system.
4. Procyclicality
Shadow banking amplifies credit cycles — expanding rapidly during booms and contracting sharply during downturns — thereby intensifying market volatility.
5. Regulatory Arbitrage
By exploiting gaps in financial regulations, shadow entities can take excessive risks that banks cannot. This can undermine the intent of financial stability rules.
Post-Crisis Reforms and Regulatory Oversight
Since 2008, global regulators have taken several steps to contain shadow banking risks:
Financial Stability Board (FSB) introduced the term “Non-Bank Financial Intermediation (NBFI)”, to reduce stigma and establish better oversight.
Basel III tightened bank capital and liquidity standards, reducing reliance on off-balance-sheet vehicles.
Money Market Fund reforms introduced liquidity buffers and redemption gates.
Repo market regulations sought to enhance collateral transparency.
Macroprudential policies began monitoring interconnected leverage between banks and non-banks.
However, regulation remains fragmented. As shadow banking evolves through fintech, decentralized finance (DeFi), and global capital mobility, regulators often play catch-up in a fast-moving ecosystem.
The New Era: Shadow Banking Meets Technology
The 2020s have introduced a new dimension: digital shadow banking. Fintechs, crypto-based lending platforms, and algorithmic liquidity pools now conduct credit intermediation at scale — often without clear jurisdictional boundaries.
Fintech Credit: Online lenders use data analytics and AI to assess credit risk rapidly, bypassing traditional bank models.
DeFi (Decentralized Finance): Blockchain platforms facilitate peer-to-peer lending and liquidity pools, effectively creating shadow banking 2.0, where smart contracts replace intermediaries.
Private Credit Expansion: Institutional investors are increasingly shifting toward direct lending, driving a multi-trillion-dollar private debt market.
These innovations improve accessibility but introduce new systemic vulnerabilities — such as cyber risk, operational fragility, and regulatory blind spots.
India’s Perspective: The NBFC-Shadow Banking Nexus
In India, shadow banking largely manifests through Non-Banking Financial Companies (NBFCs). They play a vital role in credit delivery to sectors like MSMEs, real estate, and rural finance. However, episodes like the IL&FS crisis (2018) highlighted their dependence on short-term funding and exposure to credit concentration.
The Reserve Bank of India (RBI) has since strengthened NBFC oversight through:
Scale-based regulation framework
Liquidity coverage ratios
Enhanced stress testing and capital norms
Despite challenges, India’s NBFCs and fintech lenders remain crucial conduits for inclusive growth, bridging gaps that banks often leave unserved.
Conclusion: The Future of Finance Lies in the Shadows
Shadow banking is neither a villain nor a savior. It represents the unseen arteries of global finance — channels that enable credit, innovation, and liquidity to flow where traditional banks cannot. Yet, its very strengths — flexibility, innovation, and reach — are also its vulnerabilities.
As the world moves toward a digital and decentralized financial order, shadow banking will likely expand further, reshaping how economies allocate capital. The challenge for regulators, investors, and policymakers lies in balancing innovation with stability — ensuring that the “shadows” remain a source of light, not systemic darkness.
Ultimately, shadow banking reflects the continuing evolution of capitalism itself — adaptive, complex, and perpetually pushing beyond the boundaries of regulation. Its future will depend on how wisely we illuminate its paths without extinguishing its creative spark.
Why the Eurodollar Market Became a Financial HavenIntroduction
The Eurodollar market stands as one of the most significant and transformative developments in modern finance. Despite its name, the term “Eurodollar” has little to do with Europe as a continent or the euro as a currency. Instead, it refers to U.S. dollar-denominated deposits held in banks outside the United States, particularly in Europe during its early days. What began as a niche market in the post-World War II era gradually evolved into a global financial haven—an offshore ecosystem of liquidity, flexibility, and innovation that reshaped international finance.
Understanding why the Eurodollar market became a financial haven requires examining the historical context, regulatory framework, and the incentives driving global capital flows. It was not merely a byproduct of globalization; it was the very foundation that allowed global finance to operate efficiently across borders, free from the constraints of national monetary policies.
1. Origins of the Eurodollar Market
The roots of the Eurodollar market trace back to the late 1940s and 1950s, when geopolitical tensions and economic transformations began reshaping the financial landscape. After World War II, the United States emerged as the world’s dominant economic power, with the U.S. dollar becoming the global reserve currency under the Bretton Woods system.
During this time, many foreign banks and corporations began holding dollar deposits outside the United States, particularly in European banks. One of the first major holders of such deposits was the Soviet Union, which sought to protect its dollar holdings from potential U.S. sanctions during the Cold War. By placing dollars in European banks, the Soviets could still conduct trade and financial transactions in dollars—without the risk of U.S. authorities freezing their assets.
As European economies rebuilt under the Marshall Plan, dollar-based trade expanded rapidly. European banks found themselves flush with dollar deposits, which they began lending out to other international borrowers. This marked the birth of the Eurodollar market—a decentralized, unregulated offshore market for U.S. dollars.
2. Regulatory Arbitrage: The Core Catalyst
The Eurodollar market thrived largely because it existed outside U.S. regulatory jurisdiction. Domestic banks in the United States faced strict regulations under the Federal Reserve System, including reserve requirements and interest rate ceilings imposed by Regulation Q. These restrictions limited how much interest U.S. banks could pay on deposits and constrained their lending flexibility.
In contrast, offshore banks—mainly in London—were not subject to U.S. banking regulations. This regulatory arbitrage created a competitive advantage: Eurodollar deposits could offer higher interest rates, and Eurodollar loans could be made more flexibly and at lower costs.
Borrowers and depositors around the world quickly recognized the benefits. Multinational corporations preferred Eurodollar loans for their international operations, and investors sought Eurodollar deposits for better yields. The absence of reserve requirements meant that Eurobanks could leverage their funds more aggressively, enhancing liquidity in the market.
This unregulated freedom made the Eurodollar system an ideal haven—a place where capital could move freely, unencumbered by the constraints of national borders and domestic monetary policies.
3. The London Advantage: The World’s Financial Hub
London’s role as the birthplace and hub of the Eurodollar market was no coincidence. The city had centuries of experience as a global financial center, connecting Europe, America, and the Commonwealth. By the 1950s, the British government encouraged offshore banking activity to boost its post-war economy and maintain London’s global relevance.
The Bank of England adopted a hands-off approach toward Eurodollar transactions, seeing them as foreign currency operations that did not affect domestic monetary stability. This permissive environment, combined with London’s strategic time zone (bridging Asia and America), created a perfect breeding ground for 24-hour international finance.
As a result, London became the nerve center of global dollar liquidity, with Eurodollar deposits circulating seamlessly between Europe, Asia, and the Americas. By the 1970s, Eurodollar markets had become the cornerstone of global finance—fueling trade, investment, and speculation on an unprecedented scale.
4. The Rise of Global Liquidity and Flexibility
The Eurodollar market’s greatest strength was its ability to provide liquidity when and where it was needed most. Unlike domestic banking systems, which were often constrained by national policies and reserve rules, Eurobanks operated in a borderless environment.
Corporations used Eurodollar loans to fund trade, mergers, and acquisitions, while central banks and sovereign wealth funds used Eurodollar deposits as a store of value. The market also became a vital source of funding for governments, especially developing nations seeking to borrow in dollars without going through the tightly regulated U.S. market.
By the late 1960s, the Eurodollar market had grown into a massive pool of offshore liquidity. When the Bretton Woods system collapsed in 1971 and exchange rates began to float, the Eurodollar market became even more essential. It offered a global mechanism for hedging, borrowing, and investing across currencies—laying the foundation for today’s interconnected financial system.
5. Freedom from Monetary Control
Another key reason the Eurodollar market became a financial haven lies in its freedom from central bank control. In the U.S., the Federal Reserve could regulate domestic money supply, influence interest rates, and impose capital controls. However, it had little jurisdiction over offshore dollar transactions.
This meant that even when the Fed tightened domestic credit conditions, international borrowers could still access dollar liquidity through Eurobanks. In essence, the Eurodollar market allowed global finance to operate independently of U.S. monetary policy.
This autonomy had far-reaching implications. It weakened the effectiveness of national monetary controls and allowed financial institutions to bypass domestic credit restrictions. The result was a truly globalized money market—one that operated beyond the reach of any single government, creating a self-sustaining ecosystem of private credit creation.
6. Innovation and Market Instruments
The Eurodollar market also became a laboratory for financial innovation. As competition intensified, banks developed new instruments to manage risk and enhance returns. These included floating-rate loans, syndicated lending, and short-term Eurodollar certificates of deposit.
The introduction of the London Interbank Offered Rate (LIBOR) in the 1960s provided a standardized benchmark for pricing Eurodollar loans. LIBOR quickly became the most important reference rate in global finance, underpinning trillions of dollars in loans, derivatives, and securities.
These innovations transformed the Eurodollar market into a complex web of interbank relationships and credit channels. It was not just a deposit market—it was a full-fledged financial system operating parallel to, but distinct from, domestic banking systems.
7. Safe Haven for Capital and Sovereigns
For many investors and nations, the Eurodollar market became a safe haven for several reasons:
Currency Stability: The U.S. dollar was (and remains) the world’s most trusted currency. Holding dollar assets offshore allowed investors to preserve value even when local currencies faced inflation or devaluation.
Confidentiality: Offshore banking jurisdictions often offered privacy and discretion, making them attractive to corporations, governments, and wealthy individuals seeking to protect their assets from political risks.
Political Neutrality: During the Cold War and beyond, the Eurodollar market offered a politically neutral ground for transactions between entities that might not otherwise cooperate through U.S.-regulated channels.
Diversification: Holding Eurodollar assets provided global investors with diversification away from domestic financial risks.
These features reinforced the Eurodollar market’s reputation as a financial sanctuary, a place where money could flow freely and securely amid global uncertainty.
8. The Eurodollar Market and Global Financial Power
Over time, the Eurodollar system reshaped the balance of financial power. It gave rise to massive offshore banking networks, enabled shadow banking, and facilitated the globalization of credit.
By the 1980s and 1990s, Eurodollar deposits had become an integral part of international capital markets. They funded corporate expansions, sovereign debt issuance, and speculative investments across continents. Even today, a significant portion of the world’s dollar liquidity exists outside U.S. borders—testament to the enduring legacy of the Eurodollar market.
In essence, the Eurodollar market made the U.S. dollar truly global—not just a national currency, but the lifeblood of international finance. Ironically, while it strengthened the dollar’s dominance, it simultaneously limited America’s ability to control its own currency’s global circulation.
9. Challenges and Risks
While the Eurodollar market offered flexibility and freedom, it also introduced new risks. The absence of regulation meant there was no lender of last resort for Eurobanks. During periods of financial stress, such as the 2008 Global Financial Crisis, the shortage of dollar liquidity in offshore markets amplified global instability.
Moreover, the market’s opacity made it difficult for regulators to monitor systemic risk. Interbank exposures, derivative linkages, and maturity mismatches often went undetected until crises struck. Despite these challenges, the Eurodollar market’s scale and interconnectedness made it impossible to dismantle—it had become too central to the functioning of global finance.
10. The Modern Eurodollar Landscape
Today, the Eurodollar market continues to play a vital role, even as financial technology and regulations evolve. Although LIBOR is being phased out and replaced by alternative benchmarks like SOFR (Secured Overnight Financing Rate), the fundamental dynamics of offshore dollar liquidity remain intact.
From Asian financial hubs like Singapore and Hong Kong to Middle Eastern centers like Dubai, the Eurodollar spirit lives on through global dollar lending and deposit activities. The rise of digital finance and offshore capital markets further extends the reach of the Eurodollar ecosystem—making it an indispensable pillar of the global financial architecture.
Conclusion
The Eurodollar market became a financial haven because it embodied freedom, efficiency, and trust in a world increasingly shaped by regulation and geopolitics. Its unregulated origins offered participants higher yields and greater flexibility, while its global reach turned the U.S. dollar into a universal instrument of trade, investment, and security.
From Cold War strategies to modern financial globalization, the Eurodollar market represents more than just offshore banking—it represents the world’s pursuit of monetary independence beyond political borders.
Even in the 21st century, the Eurodollar system remains the invisible backbone of global liquidity, silently powering international finance. It is both a sanctuary for capital and a mirror of our interconnected economic reality—a financial haven born from innovation, trust, and the unstoppable flow of money across nations.

AI as a Catalyst for Global Economic IntegrationIntroduction: A New Era of Intelligent Globalization
Artificial Intelligence (AI) is redefining how the world communicates, trades, and grows economically. Unlike the previous waves of globalization powered by industrialization or digital communication, the AI revolution represents a more intelligent and automated form of global integration. It is not just connecting markets—it is aligning human decision-making, production efficiency, and cross-border collaboration on a scale never seen before.
AI acts as a catalyst for global economic integration by enabling smarter supply chains, automated financial systems, predictive analytics for trade, and adaptive manufacturing that transcends geographical limitations. From multinational corporations optimizing global logistics to small businesses accessing international markets through AI-driven e-commerce, the influence of artificial intelligence is broad and transformative.
In the following sections, we explore how AI fosters global integration, reshapes economic landscapes, and bridges gaps between developed and developing economies.
1. The Foundation of Economic Integration in the AI Age
Economic integration refers to the process where nations coordinate economic policies, remove trade barriers, and align market systems to promote free flow of goods, services, capital, and technology. Historically, it evolved in stages — from free trade agreements and customs unions to common markets and economic unions.
Now, AI adds a fifth dimension to this progression: intelligent integration. This stage is marked by the use of machine learning, automation, and data analytics to:
Synchronize economic data across borders
Predict market behavior
Improve trade efficiency
Foster innovation in global industries
AI creates digital bridges that are faster and more accurate than political treaties or traditional trade mechanisms. It ensures that integration is not just about policy coordination but about real-time decision alignment across continents.
2. AI and the Transformation of Global Trade Dynamics
Global trade is the lifeblood of economic integration. Traditionally, logistics inefficiencies, fluctuating demand, and geopolitical uncertainties hindered smooth trade flows. AI is eliminating these barriers through advanced analytics and automation.
a. Predictive Trade Analytics
AI can analyze large datasets of global demand, pricing trends, and shipping routes to forecast trade movements. This helps exporters and importers anticipate shifts in demand, reduce wastage, and optimize production levels.
For instance, platforms like IBM Watson and Google Cloud AI provide supply chain optimization solutions that monitor real-time trade conditions and suggest best routes and timings.
b. Smart Logistics and Supply Chains
AI-driven supply chains are becoming self-learning systems. Algorithms can monitor port congestion, weather disruptions, or political instability and automatically reroute shipments. Autonomous vehicles and drones further enhance delivery speed and cost efficiency.
Global logistics firms like Maersk and DHL already use AI for predictive maintenance, route optimization, and fuel management — all of which make global trade more seamless.
c. Cross-Border Payment Automation
AI-based fintech systems enable smoother international transactions. Machine learning helps detect fraud, optimize currency conversion, and reduce transaction time. Digital banks use AI algorithms to assess risk and facilitate instant credit approvals, making it easier for small and medium enterprises (SMEs) to engage in global trade.
3. AI Empowering Emerging Economies
One of the most promising aspects of AI in global integration is its potential to level the playing field between developed and developing nations.
a. Access to Global Markets
AI-driven platforms such as Alibaba’s AI commerce tools or Amazon’s recommendation systems allow small producers from Asia, Africa, or Latin America to reach global customers efficiently. AI translates languages, automates marketing, and predicts consumer demand, enabling local entrepreneurs to compete internationally.
b. Digital Skill Development
AI-based education platforms are providing upskilling opportunities across the world. Through adaptive learning systems, even remote communities can gain technical and financial literacy. This democratization of knowledge promotes workforce integration into global value chains.
c. Agriculture and Manufacturing Uplift
In regions where agriculture and low-cost manufacturing dominate, AI tools enhance productivity. Smart sensors, predictive weather models, and AI-based quality control enable local producers to meet international standards, expanding their market access and economic integration.
4. Financial Integration through AI Innovation
The financial system forms the backbone of economic connectivity. AI is revolutionizing banking, investment, and insurance sectors by creating faster, safer, and more intelligent systems.
a. Global Digital Payments
AI powers the infrastructure behind cross-border digital payments through real-time fraud detection and transaction optimization. Tools like SWIFT GPI and RippleNet use AI to provide near-instant settlements and transparent tracking — reducing the friction of international money transfers.
b. Algorithmic Trading and Market Efficiency
Stock exchanges and investment platforms rely on AI algorithms for predictive modeling, market sentiment analysis, and risk management. These systems help maintain liquidity and transparency in international markets, aligning capital flows across countries.
c. Financial Inclusion
AI-driven mobile banking platforms such as M-Pesa in Africa or Paytm in India extend access to global financial systems for previously unbanked populations. This inclusion accelerates integration by increasing participation in international commerce and remittance flows.
5. Redefining Global Supply Chains
The pandemic and geopolitical tensions have highlighted vulnerabilities in global supply chains. AI is addressing these by introducing resilient and adaptive systems.
Predictive supply chain management: AI forecasts disruptions before they occur.
Automation of inventory control: Smart sensors and robotics balance supply-demand mismatches.
Decentralized manufacturing: AI enables localized production through 3D printing and robotics, reducing dependency on a single country or supplier.
By distributing production intelligence globally, AI ensures that integration is both efficient and sustainable. Companies can collaborate seamlessly across continents with synchronized production schedules and data-sharing platforms.
6. AI and Global Labor Market Integration
AI is not just transforming how businesses operate; it’s reshaping how people work globally.
a. Remote and Cross-Border Collaboration
AI-driven communication tools like Zoom AI Companion, Microsoft Copilot, or ChatGPT enable remote teams from different countries to collaborate effectively. Natural language processing (NLP) tools overcome linguistic barriers, promoting global teamwork.
b. AI in Talent Matching
Platforms like LinkedIn Talent Insights and Indeed AI Recruiter use machine learning to match employers and job seekers across borders. This global labor fluidity supports economic integration by ensuring that talent can flow to where it’s most needed.
c. Productivity and Skill Shift
While some jobs are being automated, AI is simultaneously creating demand for new skills in data analytics, robotics, cybersecurity, and digital marketing. Global labor mobility is increasingly based on AI literacy, encouraging educational institutions and governments to align skill frameworks internationally.
7. Policy, Governance, and Ethical Coordination
As AI-driven integration accelerates, international policy alignment becomes critical.
a. AI Regulation Frameworks
Organizations such as the OECD, EU, and UNESCO are developing AI ethics and data governance standards. Harmonizing these regulations ensures safe and fair use of AI across borders, fostering trust in international trade and data exchange.
b. Data Sharing and Security
Global data flow is the currency of AI-driven integration. Establishing secure and transparent mechanisms for cross-border data exchange is essential for maintaining economic stability and protecting privacy.
c. Collaboration between Nations
Multilateral initiatives like Global Partnership on AI (GPAI) promote research collaboration, resource sharing, and collective policymaking. This cooperative model strengthens the foundation for a globally integrated AI economy.
8. The Role of AI in Sustainable Global Growth
Economic integration today must balance profit with sustainability — and AI is central to this balance.
a. Energy Efficiency
AI optimizes energy consumption in manufacturing, logistics, and transportation. Global initiatives use AI to reduce carbon footprints while maintaining economic growth.
b. Climate Monitoring and Green Trade
AI models help predict climate patterns and assist governments in designing sustainable trade policies. International collaboration on AI-driven environmental technology promotes green integration across markets.
c. Inclusive Growth
AI enables equitable access to technology, finance, and education — reducing inequality and promoting balanced global development.
9. Challenges in AI-Driven Integration
Despite its potential, AI-driven integration faces several challenges:
Digital Divide: Unequal access to AI infrastructure widens the gap between advanced and developing nations.
Job Displacement: Automation threatens traditional employment sectors if reskilling is not prioritized.
Ethical and Data Privacy Concerns: Differing regulations across nations may hinder seamless data flow.
Algorithmic Bias: AI systems can perpetuate inequality if trained on biased data.
Addressing these issues requires a coordinated global strategy emphasizing inclusivity, transparency, and shared innovation.
10. The Road Ahead: Building a Unified AI-Enabled Economy
The next decade will witness the evolution of “AI Globalization 2.0”, where human intelligence and artificial intelligence co-develop economic ecosystems. Nations investing in AI education, digital infrastructure, and ethical frameworks will lead the global integration movement.
Partnerships between governments, corporations, and academia will create a globally interoperable AI network — a system where data, ideas, and innovations move across borders as freely as goods and capital once did.
Ultimately, AI will not just integrate economies but align human progress with technological intelligence, ensuring that globalization evolves toward shared prosperity and sustainability.
Conclusion: Intelligence as the New Currency of Integration
AI has become the central nervous system of the global economy. It drives efficiency, enhances collaboration, and democratizes opportunity. As the world becomes more interconnected through intelligent systems, economic integration will no longer depend solely on trade treaties or capital flows — it will depend on data intelligence, digital cooperation, and shared ethical values.
In essence, Artificial Intelligence is not just a tool of globalization — it is its new architect. It is redefining what it means for nations, businesses, and individuals to be connected, and guiding humanity toward a more integrated, innovative, and inclusive global economy.

Best Harmonic Patterns For Beginners in Forex Gold Trading
In the today's article, I will share with you 4 best harmonic patterns for beginners. We will discuss the structure of each pattern and the rules.
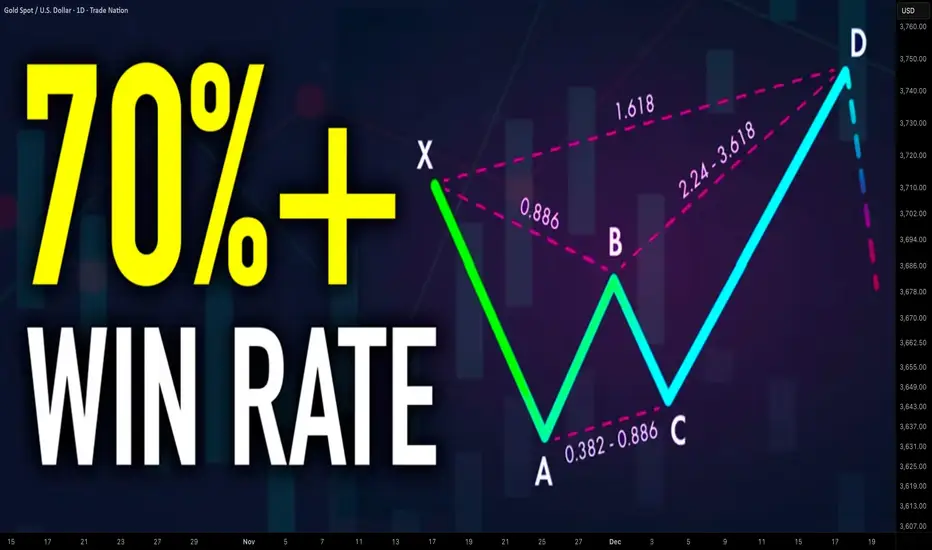
Harmonic ABCD Pattern
That pattern is based on 3 legs of a price movement:
AB leg - impulse leg,
BC leg - retracement with the range of XA leg,
CD leg - impulse leg that has the same direction, the same time horizon and the same length as the XA leg
AB and BC legs should be equal or almost equal, that makes the pattern harmonic.
The completion point of the pattern - D point can be applied for predicting a pullback.
ABCD pattern can be bullish and bearish.
In a bullish ABCD pattern, AB leg is bearish.
D point of the pattern will be a safe point to buy from.
In a bearish ABCD pattern, AB leg is bullish.
D point will be a safe place to sell from.
The next 3 patterns will be based on 4 legs of a move:
XA, AB, BC, CD and will have XABCD structure with the initial point of the pattern being X point.
D point will be a completion point of the pattern from where a pullback will be anticipated.
The type of the harmonic pattern will be identified with Fibonacci numbers. The exact placement of each point of the pattern will define the name of the pattern.
Harmonic Gartley Pattern
In Harmonic Gartley,
B point of the pattern should strictly be between 618 and 786 retracement of the XA leg.
C point should lie between 618 and 786 retracement of AB leg.
D point will be 1.272 extension of AB leg.
Bullish Gartley Pattern will be based on a bullish XA leg.
Bearish Gartley will be based on a bearish XA leg.
Harmonic Bat Pattern
In Harmonic Bat,
B point of the pattern should strictly be between 50 and 618 retracement of the XA leg.
C point should lie between 618 and 1 retracement of AB leg.
D point will be 886 retracement of XA leg.
Bullish Bat Pattern will be based on a bullish XA leg.
Bearish Bat will be based on a bearish XA leg.
Harmonic Cypher Pattern
In Harmonic Cypher,
B point of the pattern should strictly be between 382 and 618 retracement of the XA leg.
C point should lie between 1.272 and 1.414 extension of XA leg.
D point will be 786 retracement of XC leg.
Bullish Cypher will be based on a bullish XA leg.
Bearish Cypher will be based on a bearish XA leg.
These patterns are phenomenally accurate and they are very simple to recognize.
❤️Please, support my work with like, thank you!❤️
I am part of Trade Nation's Influencer program and receive a monthly fee for using their TradingView charts in my analysis.
The Power Play Between Derivatives and HedgingIntroduction
In the complex and volatile world of financial markets, risk is an ever-present companion. Investors, corporations, and governments alike constantly seek ways to manage and mitigate these uncertainties. Two powerful instruments that dominate the modern financial landscape are derivatives and hedging. Both are closely interconnected—derivatives are the tools, while hedging is often the strategy. Together, they form a dynamic power play that influences global markets, stabilizes corporate earnings, and occasionally, when misused, leads to financial turmoil. Understanding the balance between these forces is essential for grasping how financial markets truly operate.
Understanding Derivatives: The Financial Instruments of Leverage
Derivatives are financial contracts whose value is derived from an underlying asset, index, rate, or event. These underlying assets can range from stocks, bonds, commodities, and interest rates to currencies and even weather conditions. The essence of a derivative lies in its dependency—its price moves in response to the value of something else.
Types of Derivatives
Futures Contracts
Futures are standardized agreements traded on exchanges to buy or sell an asset at a predetermined price and date in the future. They are widely used in commodities, indices, and currencies. For example, an airline company might use crude oil futures to lock in future fuel prices.
Options Contracts
Options give the holder the right, but not the obligation, to buy (call) or sell (put) an asset at a specific price within a specified period. Options are extremely popular among traders and institutions because they offer flexibility in hedging and speculation.
Swaps
Swaps involve exchanging one stream of cash flows for another. Common types include interest rate swaps and currency swaps. For instance, a company with variable-rate debt may enter into a swap to fix its interest payments and stabilize costs.
Forwards
Forwards are customized over-the-counter (OTC) agreements similar to futures but not traded on exchanges. They are tailored for specific needs, making them highly flexible yet riskier due to counterparty exposure.
Purpose of Derivatives
Derivatives serve multiple purposes:
Risk Management: They allow investors and corporations to hedge against adverse price movements.
Speculation: Traders use derivatives to profit from market volatility or price predictions.
Arbitrage: Derivatives help exploit price differences in markets to earn risk-free profits.
Leverage: A small amount of capital can control large positions, magnifying both gains and losses.
In essence, derivatives amplify financial capabilities, offering both protection and peril depending on how they are used.
The Art of Hedging: Controlling the Uncontrollable
Hedging is a strategy designed to reduce or eliminate the risk of adverse price movements in assets. It’s akin to buying insurance against potential financial loss. A hedge doesn’t necessarily eliminate risk—it transfers or mitigates it.
How Hedging Works
Suppose a wheat farmer is concerned that prices might fall by harvest time. By selling wheat futures now, the farmer locks in a price and ensures predictable income regardless of future market fluctuations. Similarly, an importer concerned about currency appreciation may use forward contracts to secure a fixed exchange rate.
Hedging typically involves taking an offsetting position in a related asset or derivative to counterbalance potential losses. If the market moves unfavorably in one position, the gain in the hedge offsets the loss, thereby stabilizing overall performance.
Common Hedging Techniques
Forward and Futures Hedging – Locking in prices today for future transactions.
Options Hedging – Purchasing options to protect against downside risk while retaining upside potential.
Swap Hedging – Managing exposure to interest rates or currency fluctuations.
Portfolio Diversification – Spreading investments across asset classes to reduce overall volatility.
Hedging, in short, is about stability and foresight—it prioritizes security over speculative gain.
Derivatives as the Engine of Hedging
The relationship between derivatives and hedging is symbiotic. Derivatives enable hedging strategies, providing the mechanism to offset risk exposure across markets. Without derivatives, hedging would be limited to traditional methods like asset diversification or insurance, which are often slower, less efficient, and more costly.
For instance:
Commodity producers use futures and options to stabilize revenues.
Exporters and importers hedge against foreign exchange risks through currency forwards and swaps.
Investors protect portfolios from market downturns using index options or equity futures.
Banks manage interest rate risk using interest rate swaps and caps.
This interplay creates a more stable financial ecosystem—when used prudently. Derivatives make markets more liquid and efficient, allowing participants to distribute risk where it can best be managed.
The Power and Peril: When Derivatives Overwhelm Hedging
While derivatives are powerful risk management tools, their misuse can amplify market instability. The same leverage that makes them effective hedging instruments can also turn them into speculative weapons.
Historical Examples of Misuse
Barings Bank Collapse (1995)
A single trader, Nick Leeson, made unauthorized derivatives trades in the Singapore futures market, resulting in losses exceeding £800 million. His speculation, disguised as hedging, bankrupted one of Britain’s oldest banks.
Long-Term Capital Management (LTCM) Crisis (1998)
LTCM used highly leveraged derivative positions to exploit small market inefficiencies. When markets turned volatile, the fund’s positions spiraled out of control, threatening the global financial system.
Global Financial Crisis (2008)
The widespread use of credit default swaps (CDS) on mortgage-backed securities created massive systemic risk. What began as a hedging tool evolved into a speculative bubble, culminating in a global meltdown.
These cases highlight that derivatives without proper risk control can undermine financial stability. The thin line between hedging and speculation defines whether derivatives act as a shield or a sword.
Corporate Hedging Strategies: Real-World Applications
Corporations across sectors rely heavily on derivative-based hedging to protect against market uncertainties.
1. Currency Risk Management
Multinational corporations face constant foreign exchange volatility. For instance, Infosys and Tata Consultancy Services (TCS) use currency forwards and options to manage rupee-dollar exchange rate exposure. These hedges protect profit margins despite currency fluctuations.
2. Commodity Price Protection
Oil producers, airlines, and food companies frequently hedge input costs. Southwest Airlines, for example, famously used long-term crude oil futures to secure low fuel prices during the 2000s, giving it a massive competitive advantage.
3. Interest Rate Risk Control
Financial institutions use interest rate swaps to stabilize returns. A bank holding floating-rate loans may enter into a swap to receive fixed payments, shielding itself from rising rates.
4. Portfolio Risk Hedging
Institutional investors employ derivatives like put options on stock indices to guard against market downturns. These hedges act as “insurance policies” for portfolios, especially during economic uncertainty.
In these scenarios, derivatives serve as precision tools that allow corporations to forecast and control financial outcomes.
Regulatory Oversight and Risk Management
Given the complexity and potential risks, global regulators have tightened oversight of derivatives markets. The Dodd-Frank Act (2010) in the United States and similar regulations in Europe and Asia mandate greater transparency and reporting for derivative trades.
Key Regulatory Measures:
Central Clearing: Standardized derivatives must pass through clearinghouses to reduce counterparty risk.
Reporting Requirements: All trades must be recorded in trade repositories to improve market transparency.
Margin Requirements: Participants must post collateral to prevent excessive leverage.
Risk Management Standards: Firms must establish internal controls and limits on derivative exposures.
These measures aim to restore balance—allowing derivatives to support hedging rather than fuel speculation.
Technological Influence: Algorithmic and AI-Driven Hedging
In the digital era, technology has revolutionized derivative trading and hedging strategies. Algorithmic models and artificial intelligence (AI) now play key roles in managing risk dynamically.
AI-Based Risk Prediction: Machine learning models analyze real-time market data to anticipate price movements and adjust hedges instantly.
Automated Hedging Systems: Advanced algorithms execute complex hedging strategies across multiple asset classes simultaneously.
Blockchain and Smart Contracts: These technologies enhance transparency and efficiency in derivative settlements.
Such innovations have made hedging more precise, faster, and cost-effective—but also more dependent on data integrity and cybersecurity.
The Strategic Balance: Hedging vs. Speculation
The power play between derivatives and hedging ultimately lies in their dual nature. The same instrument can serve either purpose—risk mitigation or risk creation—depending on how it’s used.
Hedging Focus: The objective is protection. Gains are secondary; stability is paramount.
Speculative Focus: The objective is profit. Risk-taking is intentional, often amplified by leverage.
A mature financial system depends on equilibrium between these forces. Without hedgers, markets would lack stability. Without speculators, liquidity would vanish. Together, they form a dynamic yet delicate ecosystem that drives modern finance.
Future Outlook: Evolving Role of Derivatives and Hedging
As global markets grow more interconnected and digitalized, the role of derivatives and hedging will continue to expand.
Green Derivatives: Instruments linked to carbon credits and ESG benchmarks are emerging, helping companies hedge sustainability risks.
Crypto Derivatives: With digital assets gaining traction, crypto futures and options are reshaping speculative and hedging opportunities.
AI-Driven Risk Management: Predictive analytics will make hedging more adaptive to real-time market conditions.
Decentralized Finance (DeFi): Blockchain-based derivative platforms are redefining transparency and access.
The future promises both efficiency and complexity—requiring even stronger governance and risk literacy.
Conclusion
The power play between derivatives and hedging defines the heartbeat of modern finance. Derivatives, with their vast potential, empower investors and corporations to manage risk, enhance returns, and navigate uncertainty. Hedging, on the other hand, channels this power responsibly, ensuring stability amid volatility. Yet, when derivatives shift from tools of protection to instruments of speculation, the balance of power tilts dangerously.
Ultimately, the key lies not in choosing between derivatives and hedging, but in mastering their synergy. When wielded wisely, they create a resilient, efficient, and innovative financial system capable of weathering the storms of global uncertainty.
Evolution of Corporate Influence in World TradeIntroduction
The evolution of corporate influence in world trade represents one of the most transformative developments in global economic history. From the early trading companies of the 17th century to today’s multinational conglomerates and digital giants, corporations have continuously reshaped global commerce, policy, and power dynamics. Their role has expanded far beyond mere trade intermediaries — corporations now shape labor markets, technological innovation, geopolitics, environmental policy, and international relations. This essay explores the historical evolution of corporate power, its mechanisms of influence, and the profound implications it has for global trade and governance.
1. The Early Foundations: Mercantilism and Trading Empires
The Rise of Charter Companies
The earliest forms of corporate influence in global trade emerged during the age of mercantilism (16th to 18th centuries). European powers such as Britain, the Netherlands, Portugal, and Spain established state-chartered trading companies to explore and exploit overseas markets.
Notable examples include:
The British East India Company (1600)
The Dutch East India Company (VOC, 1602)
The French East India Company (1664)
These companies enjoyed monopolies granted by royal charter, allowing them to act as quasi-sovereign entities. They could wage wars, negotiate treaties, mint currency, and establish colonies — effectively merging commerce with imperialism.
Corporate Power and Colonial Expansion
Such corporations were instrumental in establishing global trade networks in spices, silk, tea, and other commodities. However, their influence went beyond trade: they facilitated colonial expansion, exploited local populations, and restructured indigenous economies. The intertwining of corporate and state interests laid the foundation for what would later become the modern model of corporate globalization.
2. Industrialization and the Birth of Modern Corporations
Industrial Revolution and Capital Formation
The Industrial Revolution in the 18th and 19th centuries marked the birth of the modern corporation. With advancements in steam power, mechanization, and transport, trade expanded rapidly. To finance large-scale industrial projects, the joint-stock company model emerged, enabling shared ownership and limited liability — key features that made large-scale enterprises sustainable.
Expansion of International Trade
Corporations such as Standard Oil, U.S. Steel, and Siemens became pioneers of industrial capitalism. They drove innovation, mass production, and international competition. Global trade became increasingly structured around industrial goods, rather than raw materials alone. These firms began to establish foreign subsidiaries, export products, and influence global commodity prices.
Corporate-State Symbiosis
Governments supported corporate expansion through trade agreements, colonial protection, and infrastructure development (railways, ports, telegraph lines). This partnership between corporations and states reinforced the idea that corporate success was synonymous with national economic strength.
3. The Early 20th Century: Corporations and Global Power
Monopolies, Trusts, and Regulation
By the early 20th century, corporate concentration led to monopolies and trusts that controlled entire industries. For instance, Standard Oil dominated the petroleum industry, while U.S. Steel shaped the steel market. Such dominance triggered anti-trust movements and regulatory reforms, such as the Sherman Antitrust Act (1890) in the United States, aiming to curb excessive corporate power.
Corporations in Global Conflict
During both World Wars, corporations became strategic actors. Industrial firms produced weapons, vehicles, and logistics for wartime economies. Post-war reconstruction further expanded corporate reach, especially under U.S. leadership. The Marshall Plan (1948), for example, not only rebuilt Europe but also created markets for American corporations, embedding them into global trade networks.
4. The Post-War Era: Multinational Expansion
The Bretton Woods System
After World War II, the establishment of institutions like the International Monetary Fund (IMF), World Bank, and General Agreement on Tariffs and Trade (GATT) provided a stable framework for global commerce. Corporations flourished under this system, expanding operations across borders with relative security.
The Rise of Multinational Corporations (MNCs)
From the 1950s onward, multinational corporations became the dominant players in world trade. Companies like Coca-Cola, IBM, Unilever, and General Motors established production and distribution networks worldwide. They pursued foreign direct investment (FDI) to gain access to new markets, labor, and resources.
Technology and Supply Chains
Technological advancements in communication, shipping, and computing revolutionized corporate operations. The emergence of global supply chains allowed firms to outsource production, reduce costs, and manage logistics more efficiently. Trade became not just about exports and imports but about cross-border production networks — the hallmark of modern globalization.
5. The Late 20th Century: Globalization and Deregulation
Neoliberal Policies and Market Liberalization
The 1980s and 1990s marked a new era of neoliberal globalization. Policies promoted by the World Trade Organization (WTO) and international financial institutions emphasized free trade, privatization, and deregulation. This environment enabled corporations to expand aggressively into emerging markets.
Corporate Mergers and Financialization
Massive mergers and acquisitions consolidated corporate power further. Financial markets became increasingly integrated, allowing corporations to access global capital easily. Corporations not only produced goods but also engaged in complex financial activities — hedging, speculation, and portfolio diversification — amplifying their influence over global capital flows.
The Rise of Emerging Market Corporations
During this period, corporations from emerging economies — such as Samsung (South Korea), Huawei (China), and Tata Group (India) — began to challenge Western dominance. These firms leveraged domestic growth and international partnerships to expand their footprint in world trade.
6. The Digital Age: Tech Giants and Data-Driven Trade
The Internet Revolution
The 21st century has been defined by the rise of the digital economy. Companies like Google, Amazon, Apple, Meta, and Microsoft dominate global commerce through data, platforms, and digital infrastructure. These corporations transcend traditional trade barriers by operating in cyberspace, reshaping consumer behavior and global business models.
E-Commerce and Digital Trade
Digital platforms have revolutionized global trade by enabling small businesses to access international markets with minimal cost. However, large corporations still dominate these ecosystems, often setting rules on pricing, logistics, and data ownership. Amazon’s marketplace, for example, is both a facilitator and a competitor to millions of sellers worldwide.
Data as a Trade Commodity
In the digital era, data has become a new form of economic power. Tech corporations collect, analyze, and monetize vast quantities of consumer information, giving them unprecedented control over market trends, consumer preferences, and even policymaking. The debate over data sovereignty and digital governance illustrates the growing intersection of corporate power and national security.
7. Corporate Influence on Global Policy and Governance
Lobbying and Policy Shaping
Corporations exert significant influence on trade policy through lobbying, think tanks, and participation in international organizations. They shape regulatory standards on intellectual property, environmental protection, and taxation. For instance, global pharmaceutical companies have heavily influenced World Trade Organization (WTO) rules on patent protection.
Public-Private Partnerships (PPPs)
Corporations increasingly collaborate with governments and international institutions on infrastructure, health, and sustainability initiatives. While such partnerships can drive progress, they also blur the lines between public interest and private profit.
Corporate Social Responsibility (CSR)
Amid growing scrutiny, corporations have embraced CSR and ESG (Environmental, Social, and Governance) standards. These frameworks aim to align business goals with global development priorities such as the UN Sustainable Development Goals (SDGs). However, critics argue that CSR is often used as a branding tool rather than a commitment to systemic change.
8. Challenges and Criticisms of Corporate Power
Economic Inequality and Market Dominance
While corporations drive innovation and growth, they also exacerbate economic inequality. Market monopolization, labor exploitation, and wealth concentration undermine equitable development. For instance, tech giants control entire sectors, stifling competition and small business growth.
Environmental Impact
Corporations are major contributors to global environmental degradation, from deforestation to carbon emissions. Although sustainability initiatives have gained traction, corporate-driven globalization continues to prioritize profit over ecological balance.
Tax Avoidance and Regulation Gaps
Through complex financial structures and tax havens, many multinational corporations minimize their tax liabilities. This erodes national revenues, limiting the capacity of governments to invest in public welfare.
9. The Future of Corporate Influence
Sustainability and Green Trade
Corporations are now under pressure to lead the transition to a green economy. Renewable energy firms, electric vehicle manufacturers, and sustainable agriculture companies are emerging as global trade leaders. Future corporate influence will depend on how effectively they balance profit with environmental and social responsibility.
Decentralization and Digital Empowerment
The advent of blockchain, Web3, and decentralized finance (DeFi) may reduce centralized corporate power. These technologies allow peer-to-peer trade, potentially redistributing influence from giant corporations to individuals and small enterprises.
Geopolitical Realignment
The rise of China’s corporate champions (e.g., Alibaba, Tencent, BYD) and Western tech dominance is shaping a new bipolar corporate world order. Geoeconomic competition between these blocs will define the next phase of global trade, where corporations act as proxies for national power.
Conclusion
The evolution of corporate influence in world trade reflects a continuous expansion of economic power and global reach. From colonial trading monopolies to multinational giants and digital empires, corporations have been both engines of prosperity and agents of inequality. Their ability to innovate, integrate markets, and shape global policy has transformed the world economy, but also raised pressing questions about accountability, fairness, and sustainability.
In the coming decades, corporate influence will remain a defining force — but the challenge for global governance lies in ensuring that this influence serves not just shareholders, but society and the planet as a whole.
Geopolitical Tensions and Energy MarketsIntroduction
Energy markets are among the most geopolitically sensitive sectors in the global economy. The production, transportation, and consumption of oil, gas, and other energy sources are deeply intertwined with the political and strategic interests of nations. Geopolitical tensions—ranging from wars and sanctions to diplomatic conflicts and trade restrictions—can dramatically alter the dynamics of energy supply, demand, and pricing. The 21st century has witnessed several such disruptions, from the U.S.–Iran confrontations and Russia–Ukraine war to Middle East instability and U.S.–China trade tensions. These events reveal a clear pattern: energy is not merely a commodity; it is a strategic weapon and a cornerstone of national security.
This essay explores how geopolitical tensions influence energy markets globally, analyzing the historical context, current landscape, major case studies, and future implications for energy security and transition.
The Geopolitical Nature of Energy
Energy, particularly oil and natural gas, has long been at the center of global power dynamics. The distribution of energy resources is highly uneven—Middle Eastern nations hold roughly half of the world’s oil reserves, while Russia, the U.S., and a few others dominate gas and shale production. This geographic concentration creates dependency relationships between energy-producing and energy-consuming countries.
For instance, Europe has traditionally depended heavily on Russian natural gas, while China and India rely on Middle Eastern oil. Such dependencies grant exporting nations substantial geopolitical leverage. Conversely, import-dependent economies must ensure access through alliances, trade routes, and sometimes military presence, as seen in the U.S. naval presence in the Persian Gulf.
Energy is therefore both an economic resource and a political instrument. The price of oil and gas, the stability of supply chains, and the policies of major producers like OPEC and Russia all have direct implications for global economic health and security.
Historical Context: Energy and Geopolitics
The relationship between geopolitics and energy markets has a long and turbulent history:
The 1973 Oil Embargo – The Arab members of OPEC cut oil supplies to Western nations supporting Israel during the Yom Kippur War, causing a global oil shock. Prices quadrupled, inflation surged, and energy security became a top priority for Western governments.
Iranian Revolution (1979) – The overthrow of the Shah and subsequent instability in Iran, one of the world’s major oil producers, led to another sharp increase in oil prices.
Gulf War (1990–91) – Iraq’s invasion of Kuwait raised fears of disrupted oil supplies. The U.S.-led coalition intervened not just for political reasons but also to safeguard global energy flows from the Persian Gulf.
Russia–Ukraine Conflict (2014 onwards) – Russia’s annexation of Crimea and subsequent tensions with the West led to sanctions, pipeline disputes, and a reassessment of Europe’s dependence on Russian gas.
These events highlight that geopolitical conflicts often trigger major shifts in energy markets, influencing both pricing and investment trends.
Recent Geopolitical Tensions Affecting Energy Markets
1. Russia–Ukraine War (2022–present)
Perhaps the most consequential recent example of geopolitics disrupting energy markets is the Russian invasion of Ukraine. Russia was a leading exporter of oil, natural gas, and coal. The European Union’s decision to impose sanctions and phase out Russian energy imports triggered a seismic shift in global energy flows.
Impact on Europe: European countries scrambled to secure alternative sources of natural gas, turning to liquefied natural gas (LNG) from the U.S., Qatar, and Australia. Germany rapidly built LNG terminals, while the EU boosted renewable energy investment to reduce dependence on imports.
Impact on Prices: Oil and gas prices surged to multi-year highs in 2022. The benchmark Brent crude briefly crossed $120 per barrel, while European gas prices hit unprecedented levels.
Global Realignment: The crisis deepened Russia’s energy partnership with China and India, as both nations increased imports of discounted Russian oil. This realignment signaled a shift in energy geopolitics toward a more multipolar world.
2. Middle East Instability
The Middle East remains a focal point of geopolitical tension, with conflicts in Israel–Palestine, Iran–Saudi rivalry, and Yemen affecting energy production and supply routes.
Strait of Hormuz: Nearly 20% of global oil passes through this narrow maritime chokepoint. Any threat to its stability, such as Iranian naval maneuvers or Western sanctions, instantly raises oil price volatility.
Iran and Sanctions: U.S. sanctions on Iran’s oil exports have repeatedly tightened global supply, forcing importers like India and China to diversify their sourcing strategies.
3. U.S.–China Strategic Competition
The energy market is also influenced by the broader strategic rivalry between the U.S. and China. As China is the world’s largest importer of oil and gas, its energy security policies have global repercussions.
Energy Supply Routes: China has invested heavily in pipelines and maritime routes through the Belt and Road Initiative (BRI) to reduce vulnerability to U.S.-controlled sea lanes.
Technology and Energy Transition: The U.S. and China are competing not only for fossil fuel security but also for dominance in renewable energy technologies, electric vehicles, and rare earth materials used in batteries.
4. OPEC+ Policy and Internal Tensions
The Organization of the Petroleum Exporting Countries (OPEC) and its allies (OPEC+) continue to play a central role in stabilizing or manipulating oil prices. However, internal political and economic tensions often create uncertainty.
Disagreements between Saudi Arabia and Russia over production quotas have led to volatile price swings.
Saudi Arabia’s Vision 2030 plan aims to diversify its economy, but oil revenue remains essential, linking its domestic stability to global oil demand.
Energy as a Strategic Weapon
Energy resources are frequently used as instruments of political leverage. For example:
Russia has repeatedly used gas supply as a geopolitical tool, cutting or limiting deliveries to Ukraine and Europe during disputes.
The U.S. uses its position as the world’s largest oil and gas producer to influence markets through strategic petroleum reserves and export controls.
OPEC decisions to cut or increase production can serve political objectives beyond pure market stabilization.
Such actions demonstrate that energy is not merely an economic commodity—it is a strategic asset used to advance national interests or punish adversaries.
Impact on Energy Prices and Global Inflation
Geopolitical tensions typically lead to supply disruptions or fears thereof, which in turn drive price volatility. Oil and gas prices are especially sensitive to perceived risk in producing regions.
For example:
The 2022–2023 European energy crisis pushed natural gas prices in Europe up by over 400%, triggering widespread inflation.
High energy costs ripple through the global economy, increasing transportation, manufacturing, and food prices.
Inflationary pressures have forced central banks to tighten monetary policies, contributing to slower economic growth.
Thus, geopolitical events in one region can have global macroeconomic consequences, illustrating the interconnectedness of energy and financial stability.
Energy Security and Policy Responses
Governments worldwide are adapting to growing geopolitical risks by prioritizing energy security and diversification.
Diversification of Supply: Countries are seeking new suppliers to reduce dependence on politically unstable regions. For example, the EU’s LNG diversification strategy post-Ukraine war.
Strategic Reserves: Many nations maintain strategic petroleum reserves to cushion against supply shocks.
Investment in Renewables: The transition toward renewable energy sources such as solar, wind, and hydrogen is increasingly viewed as a way to enhance long-term energy independence.
Regional Cooperation: Initiatives like the European Energy Union or India’s International Solar Alliance aim to strengthen collaborative resilience.
The Energy Transition and Geopolitical Realignment
The global push toward clean energy introduces a new layer of geopolitical complexity. While renewable energy reduces reliance on fossil fuel exporters, it also creates new dependencies—on minerals such as lithium, cobalt, and nickel used in batteries and solar panels.
China’s Dominance: China currently dominates the global supply chain for critical minerals and clean energy technologies. This gives it significant strategic leverage in the emerging energy economy.
New “Green” Geopolitics: Countries rich in rare earth elements, such as Chile, the Democratic Republic of Congo, and Australia, are becoming new centers of strategic competition.
Energy Transition Risks: Fossil fuel-dependent nations like Saudi Arabia, Russia, and Nigeria face economic vulnerability if demand for hydrocarbons declines faster than they can diversify.
Thus, while the energy transition may reduce some traditional geopolitical risks, it will likely create new ones centered around technology, minerals, and control of renewable infrastructure.
Future Outlook
The future of energy geopolitics will be shaped by several key trends:
Regionalization of Energy Trade: The post-globalization era may see more regional energy blocs, such as Asia’s growing intra-regional trade or Europe’s internal energy integration.
Technological Sovereignty: Nations will compete to control green technology supply chains—solar panels, hydrogen production, and carbon capture systems.
Strategic Energy Corridors: Pipelines, undersea cables, and new shipping routes (such as the Arctic route) will emerge as contested zones of influence.
Hybrid Energy Warfare: Cyberattacks on energy infrastructure, such as the 2021 Colonial Pipeline incident in the U.S., underscore the growing vulnerability of digitalized energy systems.
Conclusion
Geopolitical tensions and energy markets are inseparable. The global energy landscape is not determined solely by supply and demand fundamentals but also by power politics, alliances, and conflicts. From the oil crises of the 1970s to the Russia–Ukraine war, the world has repeatedly witnessed how geopolitical shocks can reshape energy flows, drive inflation, and influence economic stability.
As the world transitions to cleaner energy, new forms of energy geopolitics are emerging—centered on technology, critical minerals, and renewable dominance. Ensuring stable, affordable, and sustainable energy supplies in such a volatile geopolitical environment will require international cooperation, strategic diversification, and robust investment in energy innovation.
In essence, the 21st century’s energy security challenge lies not only in managing fossil fuel dependencies but also in navigating the geopolitical complexities of a rapidly transforming global energy order.

Digital Assets and Central Bank Digital Currencies (CBDCs)Introduction
The digital revolution has transformed nearly every aspect of modern life — from communication to commerce — and finance is no exception. One of the most profound shifts underway in the global financial landscape is the emergence of digital assets and Central Bank Digital Currencies (CBDCs). These innovations represent the next phase of money’s evolution, where technology and monetary policy converge to redefine how value is stored, transferred, and governed.
While digital assets like cryptocurrencies have emerged from the private sector and decentralized communities, CBDCs represent the formal entry of sovereign governments into the digital money ecosystem. Together, they are reshaping the foundations of the global financial system. This essay explores the nature, development, benefits, risks, and future implications of digital assets and CBDCs, highlighting their distinct roles and their potential to coexist in the financial architecture of the 21st century.
Understanding Digital Assets
Digital assets are electronic representations of value, ownership, or rights that are stored and transacted using digital systems, often based on blockchain or distributed ledger technology (DLT). These assets can represent various forms of value — including cryptocurrencies, security tokens, non-fungible tokens (NFTs), and stablecoins.
The key characteristics of digital assets include:
Digitization: Unlike traditional assets that require physical representation (such as cash or gold), digital assets exist purely in digital form.
Blockchain Technology: Many digital assets operate on decentralized blockchain networks, ensuring transparency, security, and immutability.
Programmability: Digital assets can include smart contracts, allowing automated execution of financial agreements without intermediaries.
Decentralization: Most cryptocurrencies operate without central authorities, relying instead on peer-to-peer verification mechanisms.
Among digital assets, Bitcoin — launched in 2009 — remains the most prominent. It introduced the idea of a decentralized currency not controlled by any government or institution. Following Bitcoin’s success, thousands of other cryptocurrencies emerged, each with unique features and purposes.
Types of Digital Assets
Digital assets can be broadly classified into several categories:
Cryptocurrencies:
Cryptocurrencies like Bitcoin (BTC) and Ethereum (ETH) function as decentralized digital money. They rely on blockchain networks to verify transactions and maintain transparency. Their value is typically determined by market supply and demand rather than by central banks.
Stablecoins:
Stablecoins are designed to minimize price volatility by being pegged to traditional assets like the U.S. dollar, gold, or a basket of currencies. Examples include Tether (USDT) and USD Coin (USDC). They bridge the gap between fiat currency stability and blockchain efficiency.
Security Tokens:
These represent ownership in real-world assets such as stocks, real estate, or bonds, but are traded digitally. Security tokens bring traditional financial instruments into the blockchain ecosystem, offering greater liquidity and accessibility.
Utility Tokens:
These grant access to specific blockchain-based platforms or services. For example, using BNB to pay for transaction fees on Binance.
Non-Fungible Tokens (NFTs):
NFTs represent unique digital items — such as art, collectibles, or intellectual property — that cannot be exchanged on a one-to-one basis like regular tokens.
Central Bank Digital Currencies (CBDCs): Concept and Design
While cryptocurrencies are decentralized and privately created, Central Bank Digital Currencies (CBDCs) are government-issued digital currencies representing a nation’s official currency in electronic form. A CBDC is essentially a digital version of fiat money — issued, regulated, and backed by a country’s central bank.
CBDCs aim to combine the efficiency and innovation of digital payment systems with the stability and trust of traditional central banking. Unlike private cryptocurrencies, CBDCs are legal tender, meaning they must be accepted for all debts, public and private, within the issuing country.
Types of CBDCs
CBDCs can be categorized into two primary forms:
Retail CBDCs:
Intended for use by the general public for everyday transactions — such as payments, savings, and remittances. They function much like digital cash.
Wholesale CBDCs:
Designed for financial institutions and interbank settlements, enhancing efficiency in large-scale payments and cross-border transfers.
Technological Architecture
CBDCs can adopt either a centralized ledger system or a distributed ledger (blockchain).
Centralized systems allow the central bank to maintain complete control over issuance and transactions.
Distributed ledger systems increase transparency and resilience but require sophisticated cybersecurity measures.
Some countries may adopt hybrid models, combining the advantages of both systems to ensure security, privacy, and efficiency.
The Rise of CBDCs: Global Landscape
CBDC development has accelerated rapidly. According to the Bank for International Settlements (BIS), over 130 countries, representing more than 95% of global GDP, are exploring or developing CBDCs.
Leading CBDC Projects
China: The Digital Yuan (e-CNY) is one of the most advanced CBDCs, currently in large-scale pilot testing across major cities.
Europe: The European Central Bank (ECB) is progressing toward launching the Digital Euro to enhance payment efficiency and sovereignty.
India: The Reserve Bank of India (RBI) introduced the e₹ (Digital Rupee) pilot program for wholesale and retail use, focusing on reducing cash dependency.
Bahamas: The Sand Dollar became the world’s first fully operational CBDC in 2020, designed to improve financial inclusion.
Nigeria: The eNaira aims to facilitate faster payments and expand access to digital financial services.
This global momentum reflects the recognition that CBDCs could transform not only domestic payments but also international trade and monetary policy transmission.
Benefits of Digital Assets and CBDCs
1. Financial Inclusion
Digital assets and CBDCs can extend financial services to the unbanked population, particularly in developing countries. With just a smartphone, individuals can access a digital wallet, enabling participation in the economy without needing a traditional bank account.
2. Efficiency and Cost Reduction
Digital currencies streamline payment systems by eliminating intermediaries, reducing transaction times, and lowering costs for both domestic and cross-border payments.
3. Transparency and Security
Blockchain technology provides immutable and traceable records of transactions, reducing fraud and enhancing trust. Governments can track illicit financial activities more effectively.
4. Monetary Policy Innovation
CBDCs offer central banks greater control over monetary policy. They can enable direct stimulus payments, programmable money for targeted spending, and more efficient interest rate transmission.
5. Enhanced Cross-Border Transactions
CBDCs and stablecoins could revolutionize global trade settlements by making cross-border payments faster, cheaper, and more transparent than traditional systems like SWIFT.
6. Reduction in Cash Handling
The digitization of money reduces the costs and logistical challenges of printing, transporting, and securing physical currency.
Challenges and Risks
Despite their potential, digital assets and CBDCs face significant hurdles:
1. Privacy Concerns
CBDCs could give governments access to vast amounts of personal financial data. Balancing transparency and individual privacy is a critical challenge.
2. Cybersecurity Risks
Digital currencies are susceptible to hacking, data breaches, and technical failures. Ensuring robust cybersecurity infrastructure is essential.
3. Financial Stability Risks
The widespread adoption of digital currencies could disrupt traditional banking systems by reducing deposits, affecting banks’ ability to lend.
4. Technological Infrastructure
Developing and maintaining secure digital ecosystems requires significant investment, especially in developing countries with limited digital infrastructure.
5. Interoperability
Without global standards, different CBDCs may not easily interact with one another, limiting their effectiveness in international trade.
6. Regulatory Uncertainty
The evolving regulatory environment for digital assets creates uncertainty for investors and institutions. Clear and consistent regulations are necessary to foster confidence.
CBDCs vs. Cryptocurrencies
While both CBDCs and cryptocurrencies exist digitally, their core philosophies diverge sharply.
Feature Cryptocurrencies CBDCs
Issuer Private or decentralized networks Central banks
Control Decentralized Centralized
Legal Tender No Yes
Volatility High Stable
Transparency Public blockchain Permissioned or restricted access
Purpose Alternative to traditional money Digital evolution of existing money
CBDCs may eventually coexist with cryptocurrencies, serving different purposes — CBDCs for stable, regulated payments and crypto assets for investment, innovation, or decentralized finance (DeFi).
Digital Assets and CBDCs: Impact on the Global Economy
The integration of digital currencies is expected to reshape global finance in several ways:
Redefining the Role of Banks:
Commercial banks might face reduced deposit bases if individuals hold CBDCs directly with central banks. This could alter the structure of credit markets and financial intermediation.
Enhancing Cross-Border Trade:
CBDCs can simplify foreign exchange and international remittances, potentially bypassing traditional intermediaries and reducing transaction times from days to seconds.
Geopolitical Influence:
Countries pioneering CBDC technology could gain strategic advantages in global finance. For example, China’s Digital Yuan could challenge the dominance of the U.S. dollar in international trade.
Acceleration of De-dollarization:
CBDCs could support the trend of de-dollarization by promoting local currency usage in international settlements, reducing dependence on the U.S. dollar.
Innovation in Financial Services:
The programmable nature of digital currencies can foster innovation in areas like automated taxation, welfare distribution, and smart contracts.
The Road Ahead: The Future of Digital Finance
The evolution toward a fully digital monetary ecosystem appears inevitable. However, achieving a balanced system that combines innovation, inclusion, and stability will require global cooperation.
Central banks, regulators, and private innovators must collaborate to establish interoperability frameworks, cybersecurity standards, and data privacy protections. Moreover, education and digital literacy will be critical to ensure equitable access to these new financial tools.
In the long run, the coexistence of digital assets, CBDCs, and traditional money will likely define a hybrid financial ecosystem — one that blends decentralization and regulation, efficiency and security, innovation and oversight.
Conclusion
Digital assets and Central Bank Digital Currencies (CBDCs) are more than technological innovations; they represent a paradigm shift in how value circulates across the globe. Digital assets, driven by decentralization and market innovation, have democratized finance and expanded access to wealth creation. Meanwhile, CBDCs offer the potential to modernize monetary systems, improve payment efficiency, and strengthen financial sovereignty.
As we move further into the digital era, the challenge lies not in choosing between these forms of money but in integrating them responsibly. The future of global finance will depend on striking the right balance between innovation and regulation, ensuring that digital currencies enhance — rather than disrupt — global financial stability. The next decade will likely witness a harmonized system where both private digital assets and public CBDCs coexist, shaping the foundation of a more inclusive, transparent, and efficient financial world.

ESG and the Sustainable Investing Revolution1. Understanding ESG Investing
ESG investing is the practice of incorporating environmental, social, and governance factors into investment decisions, alongside traditional financial metrics. The idea is that companies that are responsible stewards of resources, communities, and governance are more likely to deliver sustainable returns over time.
Environmental factors examine how a company impacts nature — such as its carbon footprint, energy efficiency, waste management, and use of renewable resources.
Social factors focus on human capital issues like employee welfare, diversity, community engagement, and respect for human rights.
Governance factors assess corporate ethics, leadership structure, executive pay, transparency, and shareholder rights.
ESG investing doesn’t reject profitability; instead, it broadens the definition of value creation. It recognizes that environmental degradation, social inequality, and poor governance can ultimately undermine financial performance. Hence, ESG acts as a risk management framework that identifies both threats and opportunities.
2. The Historical Evolution of Sustainable Investing
The roots of sustainable investing can be traced back centuries, when religious and ethical groups avoided investing in “sin stocks” such as tobacco, alcohol, or weapons. However, modern ESG investing began to take shape in the 1960s and 1970s, coinciding with rising environmental awareness and civil rights movements.
The Socially Responsible Investing (SRI) movement of the 1980s and 1990s laid the foundation for ESG, as investors began screening out companies with unethical practices. The 21st century saw the formalization of ESG frameworks, with key milestones such as:
2004: The United Nations launched the “Who Cares Wins” initiative, coining the term ESG.
2006: The UN Principles for Responsible Investment (UN PRI) were established, encouraging investors to integrate ESG principles.
2015: The Paris Agreement and UN Sustainable Development Goals (SDGs) set global sustainability targets.
2020s: ESG became mainstream, with trillions of dollars flowing into sustainable funds.
Today, ESG investing is no longer optional; it is an expectation from institutional investors, regulators, and consumers alike.
3. The Drivers Behind the ESG Revolution
Several powerful forces have propelled the ESG revolution forward:
a. Climate Change and Environmental Risks
The increasing frequency of extreme weather events, global warming, and biodiversity loss have made climate risks financially material. Companies that fail to adapt to environmental realities face supply chain disruptions, regulatory fines, and reputational damage. Investors now view climate resilience as a critical factor in long-term valuation.
b. Regulatory and Policy Changes
Governments and financial regulators worldwide have introduced sustainability disclosure requirements. The European Union’s Sustainable Finance Disclosure Regulation (SFDR), India’s Business Responsibility and Sustainability Reporting (BRSR) framework, and U.S. SEC’s climate risk proposals compel companies and funds to be transparent about their ESG performance.
c. Changing Consumer and Investor Preferences
Millennials and Gen Z investors, who prioritize social and environmental impact, are driving demand for ESG products. Similarly, consumers are favoring brands that demonstrate corporate responsibility, pushing companies toward sustainable practices.
d. Technological Advancements
Big data, artificial intelligence, and blockchain technologies have improved ESG measurement, reporting, and transparency. For instance, satellite imagery helps track deforestation, while blockchain verifies supply chain ethics.
e. Corporate Accountability
The rise of shareholder activism and public scrutiny has made it harder for corporations to ignore ESG concerns. Shareholders are voting for climate resolutions, demanding diversity on boards, and insisting on ethical governance.
4. ESG Investment Strategies
ESG investing is not a single approach but a spectrum of strategies tailored to investor goals and risk appetite. The main strategies include:
a. Negative Screening
Excluding industries or companies that fail ESG criteria — such as fossil fuels, weapons, or tobacco — from portfolios. This traditional SRI approach aligns investments with ethical principles.
b. Positive Screening
Selecting companies that perform better than peers on ESG metrics. For example, choosing renewable energy firms over oil producers.
c. ESG Integration
Embedding ESG considerations into fundamental analysis alongside financial data. This approach seeks to identify ESG risks and opportunities that may affect long-term returns.
d. Thematic Investing
Focusing on specific sustainability themes, such as clean energy, electric vehicles, gender equality, or water conservation.
e. Impact Investing
Investing directly in projects or enterprises that generate measurable social and environmental benefits, alongside financial returns — such as microfinance, green bonds, or sustainable infrastructure.
f. Shareholder Advocacy
Using ownership rights to influence corporate behavior through voting, dialogue, and engagement.
5. ESG Metrics and Reporting Challenges
While ESG investing has grown rapidly, one major challenge remains: standardization. There is no single global framework for ESG reporting, leading to inconsistencies and “greenwashing.”
Several frameworks attempt to address this issue:
Global Reporting Initiative (GRI)
Sustainability Accounting Standards Board (SASB)
Task Force on Climate-related Financial Disclosures (TCFD)
International Sustainability Standards Board (ISSB)
Despite progress, ESG ratings can still vary widely between providers. A company rated “AAA” by one agency might receive a lower rating from another, reflecting different methodologies. Investors must therefore exercise due diligence and avoid overreliance on a single rating source.
6. ESG Performance and Returns
A persistent myth surrounding ESG investing is that it sacrifices financial returns. However, multiple studies have shown the opposite. Companies with strong ESG profiles often demonstrate:
Lower cost of capital
Greater operational efficiency
Stronger risk management
Better long-term profitability
During the COVID-19 pandemic, ESG funds outperformed traditional funds, underscoring their resilience. Sustainable businesses tend to attract loyal customers, committed employees, and long-term investors — all of which enhance financial stability.
7. The Rise of Green Finance and Innovation
The ESG revolution has spurred innovation across financial markets. Green finance — encompassing green bonds, sustainability-linked loans, and ESG ETFs — is now a multi-trillion-dollar industry.
Green Bonds: Used to finance environmentally friendly projects like renewable energy, energy-efficient buildings, and sustainable transportation.
Sustainability-linked Loans: Offer lower interest rates to borrowers who meet ESG performance targets.
ESG ETFs: Provide diversified exposure to companies with high ESG scores, democratizing sustainable investing for retail investors.
Additionally, carbon trading, renewable energy funds, and social impact bonds are transforming how capital flows toward sustainability goals.
8. Regional Perspectives on ESG Investing
a. United States
The U.S. ESG market is driven by institutional investors and corporate disclosure requirements. While political debates occasionally challenge ESG mandates, major asset managers like BlackRock and Vanguard continue to advocate for sustainability integration.
b. Europe
Europe leads the ESG revolution with stringent regulations, sustainability benchmarks, and investor awareness. The EU Taxonomy defines what qualifies as sustainable, ensuring clarity and preventing greenwashing.
c. Asia-Pacific
In Asia, ESG adoption is rapidly accelerating. Countries like Japan, Singapore, and India have launched ESG funds and mandatory disclosure frameworks. India’s BRSR mandate for top-listed companies is a key milestone in corporate sustainability reporting.
d. Emerging Markets
ESG investing is unlocking opportunities in developing countries through clean energy transitions, inclusive finance, and social impact projects. However, challenges include data quality and regulatory gaps.
9. The Role of Technology in ESG Advancement
Technology has become a game-changer for sustainable investing.
Artificial Intelligence (AI) analyzes massive ESG datasets for insights.
Blockchain enhances transparency in supply chains and ESG reporting.
Fintech platforms allow investors to track the real-world impact of their portfolios.
Smart grids and IoT enable efficient energy usage and carbon tracking.
These innovations empower investors to make data-driven sustainability decisions, enhancing accountability and trust.
10. Challenges and Criticisms of ESG Investing
Despite its popularity, ESG investing faces several criticisms:
a. Greenwashing
Some companies exaggerate their sustainability credentials to attract investors, leading to misleading claims.
b. Data Inconsistency
Different ESG rating systems and lack of standardization create confusion.
c. Short-Termism
Investors may focus on ESG scores rather than long-term impact.
d. Political Backlash
In certain regions, ESG is seen as politically motivated, sparking debates about the role of capitalism in social change.
e. Implementation Complexity
Integrating ESG into traditional investment frameworks requires expertise, reliable data, and alignment with financial objectives.
11. The Future of ESG and Sustainable Investing
The future of ESG investing lies in greater integration, standardization, and impact measurement. Key trends include:
Mandatory ESG disclosures across global markets.
AI-driven ESG analytics for precision and transparency.
Integration with the circular economy, emphasizing resource reuse and waste reduction.
Focus on social equity, including gender inclusion, human rights, and diversity.
Alignment with global net-zero targets by 2050.
As capital continues to flow into sustainable investments, ESG will reshape not only financial markets but also the broader global economy.
12. Conclusion: A New Era of Responsible Capitalism
The ESG and Sustainable Investing Revolution marks the dawn of a new era — one where profit and purpose coexist. It challenges the outdated notion that financial success must come at the expense of the environment or society. Instead, it promotes responsible capitalism, where investors, corporations, and governments collaborate to create a resilient and inclusive economy.
In the coming decades, ESG will not merely be an investment trend but a core determinant of global economic stability. The revolution has already begun — and those who embrace sustainability today will be the market leaders of tomorrow.
The future of finance is not just about earning returns; it’s about earning them responsibly — ensuring that growth today does not compromise the prosperity of future generations.

De-Dollarization and Global Currency ShiftsIntroduction
For over seven decades, the U.S. dollar has been the undisputed king of global finance — the preferred reserve currency, the benchmark for international trade, and the foundation of global capital markets. However, recent years have seen increasing talk and tangible actions toward de-dollarization — the gradual movement away from dependence on the U.S. dollar in global trade, finance, and reserves. This shift is not merely theoretical but increasingly visible in trade agreements, reserve allocations, and cross-border payment systems. Understanding this process requires exploring its historical roots, current dynamics, major players, and the profound implications for the global economy.
1. Historical Dominance of the U.S. Dollar
The dollar’s dominance began after World War II, cemented through the Bretton Woods Agreement of 1944, which established the dollar as the central currency in the international monetary system. Under this system, other currencies were pegged to the dollar, which itself was backed by gold at a fixed rate of $35 per ounce. The U.S. economy, being the largest and most stable, became the anchor of global trade and finance.
Even after the Nixon Shock of 1971, when the U.S. abandoned the gold standard, the dollar maintained its supremacy due to America’s economic might, deep financial markets, and the establishment of the petrodollar system — where oil and other commodities were priced and traded in U.S. dollars. This gave the U.S. an “exorbitant privilege,” enabling it to run large deficits and influence global financial flows without losing credibility.
2. The Concept of De-Dollarization
De-dollarization refers to the global trend of countries reducing their reliance on the U.S. dollar for international trade, reserves, and financial transactions. It encompasses several dimensions:
Trade De-dollarization: Using alternative currencies for bilateral or multilateral trade settlements.
Financial De-dollarization: Diversifying reserves and foreign assets away from the dollar.
Institutional De-dollarization: Creating mechanisms that bypass U.S.-dominated systems like SWIFT.
While the dollar still dominates, de-dollarization is gradually reshaping the landscape, driven by economic pragmatism, geopolitical tensions, and the desire for monetary sovereignty.
3. Factors Driving De-Dollarization
a. Geopolitical Motivations
The most significant catalyst has been geopolitics. The U.S. has frequently used the dollar as a geopolitical weapon, imposing sanctions on nations like Russia, Iran, and Venezuela. This weaponization of the dollar has alarmed countries that fear similar vulnerabilities. For example, after Russia’s exclusion from the SWIFT system in 2022, Moscow and Beijing accelerated moves to use their national currencies for trade.
b. Economic Diversification
Emerging economies, especially China, India, Brazil, and Russia, are seeking greater autonomy in financial dealings. Holding large dollar reserves exposes them to U.S. monetary policy and inflation risks. Diversifying into gold, yuan, or euro assets reduces exposure to dollar volatility.
c. Rise of Alternative Economic Blocs
The BRICS alliance (Brazil, Russia, India, China, and South Africa) has become a strong advocate for a multipolar currency system. Their growing share of global GDP and trade makes it feasible to trade among themselves in local currencies, reducing the dollar’s centrality.
d. Technological Innovation and Digital Currencies
Blockchain technology and Central Bank Digital Currencies (CBDCs) are providing infrastructure for cross-border payments independent of the dollar system. China’s digital yuan and experiments by the European Central Bank and Reserve Bank of India are examples of monetary innovation accelerating de-dollarization.
e. U.S. Fiscal and Monetary Policies
Massive U.S. debt, persistent deficits, and inflationary pressures have raised concerns about long-term dollar stability. As the Federal Reserve’s interest rate policies cause volatility in global markets, many nations seek alternatives to reduce vulnerability to U.S. economic cycles.
4. Key Players in the De-Dollarization Movement
China
China is at the forefront of de-dollarization. Through its Belt and Road Initiative (BRI), it has expanded yuan-denominated trade and investment. The Cross-Border Interbank Payment System (CIPS) is Beijing’s alternative to SWIFT, facilitating international settlements in yuan. The digital yuan (e-CNY) further strengthens China’s ability to bypass the dollar in trade.
Russia
Following Western sanctions after the annexation of Crimea (2014) and the 2022 Ukraine war, Russia drastically reduced its dollar holdings, increasing reserves in gold and yuan. Russian oil and gas are now traded with countries like China and India in local currencies or through barter mechanisms.
India
India has begun signing bilateral trade agreements that allow settlement in Indian Rupees (INR). For example, the INR-Vostro account system facilitates trade with countries like Russia and Sri Lanka. India’s cautious yet steady participation highlights its interest in a diversified currency regime without abruptly destabilizing its financial relations with the West.
Middle East and Africa
Saudi Arabia, traditionally a key pillar of the petrodollar system, has signaled openness to accepting yuan or euros for oil sales, particularly with China. African nations engaged with BRICS and China’s infrastructure projects are also using local currency or yuan settlements, contributing to the multipolar trend.
European Union
The euro remains the second-most used currency in global reserves. The EU’s promotion of the euro in energy and technology trade aims to strengthen its global role and reduce dependence on U.S. financial systems, particularly in the face of unilateral sanctions.
5. Mechanisms of De-Dollarization
a. Bilateral Currency Swaps
Central banks are entering currency swap agreements, enabling direct trade in local currencies. China has over 40 such agreements worldwide, including with nations like Argentina, Pakistan, and Russia.
b. Local Currency Settlements
Countries like India, Brazil, and Indonesia are developing systems for local currency trade settlements, bypassing the dollar in invoicing and payment processing.
c. Multilateral Platforms
The Asian Infrastructure Investment Bank (AIIB) and the New Development Bank (BRICS Bank) are examples of financial institutions providing loans and investments in local currencies rather than dollars.
d. Gold Accumulation
Several nations have increased gold reserves as a hedge against dollar volatility. Central banks worldwide, led by China and Russia, are buying gold at record levels, viewing it as a neutral asset outside U.S. control.
6. Implications for Global Trade and Finance
a. Reduced Dollar Demand
As trade and financial flows diversify, global demand for U.S. dollars may decline gradually. This could weaken the dollar’s exchange rate and reduce the U.S.’s ability to finance its deficits cheaply.
b. Rise of Multipolar Currency System
A more balanced currency system may emerge, dominated by the U.S. dollar, euro, and Chinese yuan, with regional currencies playing niche roles. This diversification could enhance global stability but complicate exchange rate management and liquidity flows.
c. Shifts in Reserve Composition
According to IMF data, the dollar’s share of global reserves has declined from over 70% in 2000 to about 58% in 2024. This trend is expected to continue as central banks increase allocations to gold, yuan, and other assets.
d. New Trade Alliances
Countries prioritizing local currency trade are forming new alliances and payment networks, reshaping global trade routes. For instance, the India-Russia-China corridor and BRICS payment system are notable examples.
e. Impact on U.S. Influence
De-dollarization could gradually diminish U.S. geopolitical leverage. The ability to impose sanctions, control global liquidity, or influence monetary policy worldwide would be reduced. However, this process will likely be slow, given the depth and liquidity of U.S. financial markets.
7. Challenges and Limitations
While the momentum toward de-dollarization is real, several constraints limit its pace:
a. Lack of Deep Capital Markets
The U.S. still offers the largest, most liquid, and transparent capital markets. Alternatives like the yuan or rupee lack full convertibility, regulatory clarity, and global trust.
b. Network Effects
Once a currency dominates, it benefits from self-reinforcing network effects. Most global commodities are priced in dollars, and firms prefer it due to stability and universal acceptance.
c. Political and Institutional Trust
Many countries still view the U.S. legal and financial framework as safer than those of emerging powers. China’s capital controls and Russia’s geopolitical isolation hinder full global acceptance of their currencies.
d. Technological Fragmentation
Although CBDCs and digital platforms offer alternatives, interoperability and security issues remain unresolved. Competing systems could lead to inefficiency rather than integration.
8. Future Outlook: The Road Ahead
The world is unlikely to see the immediate end of the dollar era, but a gradual rebalancing is underway. The next decade could witness:
A tripolar currency system led by the U.S. dollar, euro, and Chinese yuan.
Expansion of digital and regional currencies for trade within Asia, Africa, and Latin America.
Declining U.S. dominance in global reserves but continued dollar primacy due to market depth.
Growth of commodity-backed and digital settlement systems to stabilize cross-border payments.
The dollar’s resilience should not be underestimated — it remains a symbol of trust, backed by strong institutions and deep markets. Yet, as emerging powers grow and technology disrupts traditional finance, the unipolar dollar era is transforming into a multipolar monetary order.
Conclusion
De-dollarization represents one of the most significant shifts in the global economic landscape of the 21st century. It is not an overnight revolution but a gradual evolution driven by geopolitical tensions, technological progress, and the rise of new economic powers. While the U.S. dollar will likely remain dominant for the foreseeable future, its uncontested supremacy is fading. The emerging multipolar currency world — led by the dollar, yuan, and euro — will redefine global finance, trade, and geopolitics.
In essence, de-dollarization is not just a financial adjustment; it is a statement of sovereignty, resilience, and the world’s ongoing journey toward a more balanced and diversified economic order.

Emerging Market Growth and Capital FlowsIntroduction
Emerging markets (EMs) are the engines of modern global growth. These are nations in transition from developing to developed economic status—countries such as India, China, Brazil, Indonesia, and South Africa—representing dynamic economies characterized by rapid industrialization, expanding middle classes, and evolving financial systems. The term “emerging markets” encapsulates both potential and volatility. On one hand, these economies are drivers of global output, trade, and innovation. On the other, they remain vulnerable to external shocks, geopolitical changes, and fluctuations in global capital flows.
At the heart of emerging market performance lies the intricate relationship between economic growth and capital flows. The interaction between these two factors determines the sustainability of development, the resilience of financial systems, and the prospects for long-term prosperity. Understanding this connection is essential to grasp how global liquidity, investor sentiment, and policy environments shape the trajectory of the world’s most dynamic regions.
The Economic Landscape of Emerging Markets
Emerging markets have witnessed profound transformations over the past three decades. From the liberalization of India’s economy in 1991 to China’s opening up and integration into global supply chains, EMs have become integral to global growth. According to the IMF, emerging and developing economies now account for more than 60% of global GDP (on a purchasing power parity basis), compared to less than 40% in 1990.
Several features distinguish these economies:
Rapid Industrialization and Urbanization – Transitioning from agriculture-based to industrial and service-driven structures, EMs are undergoing a massive structural shift that spurs productivity and consumption.
Demographic Advantage – Younger populations, rising literacy rates, and expanding labor forces fuel consumption and entrepreneurship.
Growing Financial Integration – Enhanced access to global capital markets and increased foreign direct investment (FDI) have improved financing options for infrastructure and business development.
Technological Leapfrogging – Emerging economies often skip traditional stages of development by adopting digital technologies, fintech, and e-commerce at scale.
However, growth in these regions is not linear. EMs are susceptible to capital volatility, commodity price swings, and currency fluctuations—all of which can amplify economic cycles.
Understanding Capital Flows
Capital flows refer to the movement of money across borders for investment, trade, or business production. They are broadly classified into:
Foreign Direct Investment (FDI): Long-term investment in productive assets such as factories, infrastructure, or business ownership. FDI is considered stable and beneficial as it transfers technology, skills, and management expertise.
Foreign Portfolio Investment (FPI): Investments in financial assets like stocks and bonds. While it enhances liquidity and financial depth, FPI can be volatile and prone to sudden reversals.
Official Flows: Movements from governments and international financial institutions (such as IMF or World Bank), including loans, grants, and aid.
Private Debt and Bank Lending: Cross-border loans and credits to corporations or governments, often sensitive to interest rate differentials and credit risk perceptions.
Capital flows are influenced by push and pull factors:
Push factors include global conditions such as low interest rates in developed markets, risk appetite, and monetary policy stances of advanced economies (e.g., U.S. Federal Reserve).
Pull factors relate to domestic fundamentals such as growth potential, political stability, institutional quality, and market reforms in the recipient emerging economy.
Drivers of Growth in Emerging Markets
The robust growth in EMs can be attributed to several structural and cyclical drivers:
1. Demographic and Consumption Power
Emerging markets collectively host nearly 85% of the world’s population. This demographic dividend translates into expanding consumer bases and rising household incomes. For example, India’s middle class is expected to exceed 500 million by 2030, driving demand in housing, technology, healthcare, and mobility.
2. Industrial and Infrastructure Expansion
Investment in roads, ports, energy grids, and digital networks not only boosts productivity but also attracts long-term foreign investors. Governments and development banks play a vital role in facilitating such projects.
3. Trade and Global Integration
EMs have become crucial participants in global supply chains. For instance, Vietnam and Mexico have benefited from shifts in manufacturing away from China, reflecting the China+1 diversification strategy.
4. Financial Deepening and Reforms
Many EMs have liberalized their financial systems, improved central bank independence, and developed domestic capital markets. The establishment of local bond markets in countries like Indonesia and Brazil reduces dependence on foreign borrowing.
5. Technological Adoption
Digital transformation is reshaping emerging economies. Fintech in Africa, e-commerce in Southeast Asia, and digital payments in India have improved financial inclusion, enabling millions to participate in the formal economy.
The Role of Capital Flows in Emerging Market Growth
Capital flows play a dual role in emerging economies: they are both enablers of growth and sources of vulnerability.
Positive Impacts
Financing Development Gaps:
EMs often face domestic savings constraints. Foreign capital fills this gap, enabling investment in infrastructure, technology, and industrial capacity.
Technology and Knowledge Transfer:
FDI brings innovation, managerial skills, and modern production techniques, enhancing competitiveness.
Financial Market Development:
Portfolio inflows contribute to liquidity, improving price discovery and broadening financial participation.
Exchange Rate Stability:
Inflows can strengthen currencies, reducing the cost of imports and helping control inflation.
Negative Impacts and Vulnerabilities
Volatility and Sudden Stops:
Portfolio flows can reverse quickly due to global shocks—known as “sudden stops”. These outflows can trigger currency depreciation, inflation, and financial crises (e.g., 1997 Asian Financial Crisis).
Overvaluation of Assets:
Excessive inflows can inflate asset bubbles in stock or real estate markets, leading to financial instability.
Debt Accumulation:
Easy access to foreign debt may encourage over-borrowing, creating vulnerabilities when global interest rates rise.
Exchange Rate Pressures:
Inflows appreciate local currencies, hurting export competitiveness. Conversely, outflows cause depreciation and capital flight.
Historical Perspective: Episodes of Capital Flow Volatility
1. Asian Financial Crisis (1997–1998):
Large inflows of short-term capital into Southeast Asian economies led to asset bubbles. When global sentiment shifted, rapid outflows caused currency collapses and severe recessions.
2. Global Financial Crisis (2008):
After the crisis, major central banks adopted near-zero interest rates and quantitative easing, prompting massive capital inflows into EMs in search of yield. This “liquidity wave” boosted growth but also heightened vulnerability to reversal.
3. Taper Tantrum (2013):
When the U.S. Federal Reserve signaled tapering of its asset purchases, EM currencies and bond markets experienced sharp sell-offs. This episode underscored how dependent EMs are on global monetary conditions.
4. Pandemic Era and Beyond (2020–2023):
COVID-19 caused the largest capital outflow in EM history in early 2020, followed by a surge in inflows as global liquidity expanded. By 2023–2024, as interest rates in developed markets rose again, EMs faced renewed pressure.
Policy Frameworks and Resilience Strategies
Emerging markets have learned from past crises and built stronger frameworks to manage capital flows and enhance stability.
Flexible Exchange Rate Regimes:
Allowing currencies to adjust to market forces reduces pressure on foreign reserves and discourages speculative attacks.
Foreign Reserve Accumulation:
Countries like China and India maintain large reserves as buffers against capital outflows and external shocks.
Macroprudential Policies:
Tools such as capital requirements, debt limits, and countercyclical buffers mitigate systemic risks in the financial sector.
Capital Controls (Selective):
Some EMs employ temporary restrictions to curb speculative inflows or prevent destabilizing outflows.
Strengthening Domestic Institutions:
Transparent governance, stable legal systems, and credible monetary authorities attract long-term investors.
The Emerging Market Investment Landscape
Global investors are increasingly viewing EMs as essential components of diversified portfolios. Key reasons include:
Higher Growth Potential: EMs typically offer GDP growth rates 2–3 times higher than developed markets.
Valuation Opportunities: Equity and bond markets in EMs often trade at lower valuations relative to fundamentals.
Diversification Benefits: Economic cycles in EMs are not perfectly correlated with those in developed nations, reducing portfolio risk.
However, investors must navigate country-specific risks, including political instability, currency volatility, and regulatory unpredictability. Institutional investors now adopt sophisticated risk assessment frameworks, incorporating environmental, social, and governance (ESG) factors into EM investments.
The Future Outlook: Emerging Markets in a Changing Global Order
The future of emerging markets will be shaped by several transformative trends:
Regional Integration:
Initiatives such as the African Continental Free Trade Area (AfCFTA) and ASEAN Economic Community (AEC) will deepen trade and capital linkages.
Green Transition:
EMs will attract capital for renewable energy, sustainable infrastructure, and climate adaptation—opening vast new investment frontiers.
Digital Economy Expansion:
The rise of digital currencies, fintech ecosystems, and e-commerce will fuel productivity gains and broaden financial inclusion.
Geopolitical Realignments:
As global supply chains diversify away from single-country dependence, countries like India, Vietnam, and Mexico will emerge as key manufacturing hubs.
Resilience through Domestic Capital Markets:
Developing robust local investor bases and bond markets will reduce dependency on volatile foreign inflows.
Conclusion
Emerging market growth and capital flows are inextricably intertwined, reflecting both opportunity and fragility. While capital inflows can accelerate industrialization, innovation, and prosperity, their volatility can destabilize economies if not managed prudently. Over time, emerging economies have become more resilient—adopting flexible exchange rates, prudent fiscal policies, and sound macroeconomic frameworks.
As the global economic order evolves, EMs are expected to contribute more than two-thirds of global growth in the coming decade. The challenge lies in sustaining this momentum through diversification, innovation, and institutional strength. The management of capital flows—ensuring that they are harnessed for productive purposes rather than speculative gains—will define whether emerging markets truly fulfill their promise as the growth engines of the 21st century.

Understanding Psychological LevelsDefinition:
In Trading, Psychological levels are often called round numbers or psy levels.
This is because the price ends in zeros and fives naturally attracting a trader’s attention.
Examples:
• Forex: 1.0000, 1.0500, 1.1000
• Stocks: $50, $100, $150, $200, $250
• Cryptocurrency: $10,000, $15,000, $20,000, $25,000
These levels are crucial as traders instinctively see targets in round numbers. (Or Incremental levels such as 5, 10, 15, 20, 25, 30 and so on...
This causes many buy, sell, and stop orders to cluster around the same price zones, creating self-reinforcing areas of interest in the market. Again, price sits at 113.2k – Psychological level is 115k.
___________________________________________________________________________________
Why Psychological Levels Matter in Trading
1) Human Bias:
Traders and investors often place orders at simple, rounded numbers. This makes their charts and order list “Clean.”
2) Institutional Targeting:
Large groups, whales or organizations use these levels to find liquidity or trigger stops. (Eg, BTC swept 125k before dumping)
3) Market Memory:
When a Psychological level reacts, traders remember it, and it often becomes relevant again in the future. (Turns into a prev liquidity sweep.)
5) Order Clustering:
Stop losses, take profits, and pending orders frequently build up around these areas. (As above, it builds liquidity.)
__________________________________________________________________________________
How to Identify Psychological Levels
Begin with marking clean, round (or quarterly) numbers on your chart. These are often major levels such as 4.0000, 5.0000, or 6.0000.
See the example below:
Then identify the midpoints/quarter points between them, like 4.5, 5.5, 6.5, 7.5, 8.5
See the example below:
For stronger assessments, look for psychological levels that align with other forms & tools of technical confluence—such as previous S & R, Supply/Demand, Highs & Lows, Fibonacci retracements, trendlines, or volume clusters.
See the example below:
When multiple forms of technical evidence converge near a round number, the level tends to have greater impact.
__________________________________________________________________________________
Trading Around Psychological Levels
When price approaches a psychological level, three common behaviors can occur:
1) Rejection:
Price touches the level and reverses quickly, suggesting strong defense by buyers or sellers. (Liquidity Sweep)
2) Break and Retest:
Price breaks through the level, then revisits it to confirm it as new support or resistance.
3) Compression or Grind:
Price consolidates near the level before a breakout as liquidity builds up.
Practical Application:
Enable alerts slightly before major psychological levels to observe reactions in real time (for example, 4.45 instead of 4.5 ). Wait for confirmation using price action such as a clear rejection wick, an engulfing candle, or a BOS (Break of Structure). Combine this analysis with liquidity or other forms of technical tools for a stronger assessment.
__________________________________________________________________________________
Trader Behavior at These Levels
Market reactions at psychological levels are largely directed by emotion and herd (Group) behavior. Fear of missing out can push price through a round number with momentum & speed while profit-taking can trigger short-term reversals & rejections. Stop hunts are also common, where smart money briefly pushes prices beyond a round level to collect liquidity before reversing. (From 4.0 up to 4.25 then down again)
Because many traders watch these same levels, reactions often repeat, reinforcing their significance.
__________________________________________________________________________________
Example: BTC/USD for $125k
When Bitcoin approaches $125k, many retail traders view it as a significant threshold. They might place short orders just below it or stop just above. Institutions recognize this and may intentionally push prices above $125k (sweeping $126k) to trigger those stops and fill large positions.
Once that liquidity is collected, price can reverse, and the $125k area may later serve as a new resistance zone.
This type of liquidity hunt and reversal pattern occurs frequently across all markets.
__________________________________________________________________________________
Practical Tips
1) Never trade purely based on a round number. Always wait for confirmation through structure or price action. (Retests, MSS, BOS, candle patterns etc)
2) Use alerts & alarms rather than fixed lines; prices often wick slightly above or below the exact level.
3) On higher timeframes, psychological levels often act as major turning zones. On lower timeframes, they tend to attract short-term reactions. (Lower the time frame, the more reactions = constant noise)
4) Combine psychological levels with liquidity, order flow, or volume analysis for a more complete view.
__________________________________________________________________________________
Summary
Psychological levels are where human reactions and liquidity meet. They represent areas of emotional and institutional/organizational interest rather than fixed points of reversal.
By understanding how traders behave around these zones and observing how price reacts to them, you can determine key movements with greater confidence.

Fibonacci Beyond the ObviousFibonacci Beyond the Obvious
The Professional Approach — WerkTrader Edition 🎯
1️⃣ Introduction – More Than Just a Sequence
Fibonacci is not magic, myth, or a decorative tool for colorful charts.
It is a mathematical ratio that appears in nature, architecture, music – and yes, in markets.
If you only know Fibonacci as the 61.8 retracement, you understand the concept,
but not the depth.
A true analyst doesn’t use Fibonacci to draw lines –
he uses it to measure structure,
to see where the market stands in relation to itself.
2️⃣ The Principle of Self-Similarity
Markets are fractal.
They move in repeating proportions, regardless of timeframe.
A 38.2 pullback on the 15-minute chart can have the same character
as a 61.8 retracement on the daily.
Professionals call this Fractal Alignment –
multiple timeframes reacting to the same ratio,
and that’s exactly where the decisive moves occur.
3️⃣ Fibonacci Timing – The Invisible Factor
Most traders measure price, not time.
But Fibonacci also works horizontally.
13, 21, 34, 55 – not as price levels,
but as candle intervals between significant highs and lows.
These Fibonacci Time Projections reveal
when market cycles overlap –
often the moment before price reacts to a known zone.
Institutional models use this quietly,
while retail traders almost always overlook it.
4️⃣ Fibonacci in Orderflow
Fibonacci zones are not magical support lines –
they are points of liquidity interaction.
At 61.8 %, three groups often collide:
1️⃣ Retail shorts fading the retracement,
2️⃣ Smart-money algorithms collecting liquidity,
3️⃣ Position builders using the pullback for entry.
Fibonacci is not a signal – it’s a trigger area,
a place where energy releases.
5️⃣ Asymmetry and Precision
The famous ratio φ ≈ 1.618 is mathematically perfect,
but markets are not.
A professional observes the deviation from the ideal –
often just 1–2 %.
Those small over- or undershoots reveal who dominates:
reaction or manipulation.
This is called Fibonacci Deviation Bias –
a subtle detail that shows whether a zone was merely tested
or truly broken.
6️⃣ Cluster Theory – The Art of Overlap
A single level is coincidence.
But when multiple retracements or extensions
align within the same price area,
a cluster is formed.
This overlap of different swings is called Confluence.
The more Fibonacci relationships converge,
the stronger the reaction.
A professional doesn’t look for the “perfect number” –
he looks for the connection of proportions.
Mathematics confirms itself where ratios intersect.
7️⃣ Fibonacci & Harmonic Patterns – Geometry of Confirmation
Harmonic patterns are the advanced geometry of Fibonacci relationships.
They consist of several precisely measured retracements and extensions,
forming a geometric reversal structure –
like the Gartley, Bat, Butterfly, or Crab.
Each one is built on the same base ratios:
XA → AB = 61.8 %,
BC = 38.2–88.6 %,
CD = 127–161.8 %.
When these measurements meet at a single point,
they create the PRZ (Potential Reversal Zone) –
the mathematical intersection between order and chaos.
The more Fibonacci connections overlap,
the stronger the confirmation.
That’s not coincidence – that’s confluence in its purest form.
8️⃣ Fibonacci as a Language
Fibonacci is not a strategy – it’s a language of proportion.
It doesn’t tell you where to buy,
it tells you where to listen.
The market doesn’t speak in words,
it speaks in ratios.
Those who understand them see structure
where others see only lines.
9️⃣ Conclusion – The Silence of Numbers
Fibonacci is not a myth.
It is the quietest form of truth in the market.
Numbers themselves do not speak –
but they show you where the market reacts,
where mathematics meets psychology,
and where patience becomes power.
Fewer lines.
More meaning.
This is Fibonacci – beyond the obvious.
WerkTrader 🎯

IMF’s Crucial Role in the Global EconomyIntroduction
The International Monetary Fund (IMF) stands as one of the most influential international financial institutions in the world. Established in 1944, it has played a pivotal role in maintaining global monetary stability, providing financial assistance to countries in distress, and shaping the world’s economic policies. Over the decades, the IMF has evolved from a post-war reconstruction tool into a global financial watchdog that guides nations through crises, fosters economic cooperation, and promotes sustainable development. Its crucial role is rooted in the principles of global economic interdependence, stability, and inclusive growth.
Historical Background and Foundation
The IMF was conceived during the Bretton Woods Conference in July 1944, held in New Hampshire, USA. This conference was attended by representatives of 44 nations who sought to rebuild the international economic order after the devastation of World War II. The primary architects, John Maynard Keynes from Britain and Harry Dexter White from the United States, envisioned a system that would ensure exchange rate stability and prevent the kind of competitive devaluations and trade barriers that contributed to the Great Depression.
The IMF officially came into existence on December 27, 1945, with 29 member countries signing its Articles of Agreement. Its initial mission was to oversee the fixed exchange rate system and provide short-term balance of payments assistance. Over time, as the world economy evolved—especially after the collapse of the Bretton Woods system in 1971—the IMF adapted its functions to address new global challenges.
Objectives of the IMF
The IMF’s mandate, as outlined in its Articles of Agreement, revolves around several key objectives:
Promoting International Monetary Cooperation – The IMF provides a forum for consultation and collaboration on international monetary issues among its 190+ member countries.
Ensuring Exchange Rate Stability – It aims to maintain stable exchange rates and prevent competitive devaluations that can destabilize trade and investment flows.
Facilitating Balanced Growth of Trade – The IMF works to promote the expansion of international trade, which contributes to economic growth and employment.
Providing Financial Assistance – It extends financial resources to member countries facing balance of payments problems, enabling them to stabilize their economies.
Reducing Global Poverty – Through concessional lending and structural reform programs, the IMF seeks to alleviate poverty, especially in developing nations.
These objectives make the IMF not just a lender of last resort but a central institution for economic governance, coordination, and stability.
Structure and Governance
The IMF’s structure reflects its global membership and collaborative nature. Its main organs include:
The Board of Governors – Composed of one governor from each member country, usually the finance minister or central bank governor. It meets annually to make key policy decisions.
The Executive Board – Consists of 24 Executive Directors representing member countries or groups of countries. It handles the day-to-day operations and decisions.
The Managing Director – The head of the IMF, appointed by the Executive Board, oversees the institution’s operations. Traditionally, the Managing Director is European, while the President of the World Bank is American—a reflection of post-war political arrangements.
Quota System – Each member’s financial contribution (quota) determines its voting power and access to IMF resources. The quota reflects the country’s relative size in the global economy.
While this structure is designed to balance representation, there have been debates about reforming the quota system to give emerging economies like China, India, and Brazil greater influence.
Functions of the IMF
The IMF’s role extends across several crucial domains:
1. Surveillance
IMF surveillance involves the monitoring of global, regional, and national economies to identify potential risks and recommend corrective measures. Through the Article IV Consultations, the IMF reviews each member country’s economic policies and provides policy advice. These reviews promote transparency, fiscal discipline, and effective governance.
The IMF also publishes the World Economic Outlook (WEO) and the Global Financial Stability Report (GFSR), which are highly respected analyses of global economic trends and risks.
2. Financial Assistance
When countries face severe economic crises, such as currency collapses or balance of payments deficits, the IMF provides financial support. This assistance is typically conditional on the implementation of policy reforms—known as IMF programs or conditionalities.
Some of the key lending instruments include:
Stand-By Arrangements (SBA): For short-term balance of payments problems.
Extended Fund Facility (EFF): For longer-term structural issues.
Poverty Reduction and Growth Trust (PRGT): For low-income countries at concessional rates.
Rapid Financing Instrument (RFI): For emergency assistance, such as during the COVID-19 pandemic.
These programs are designed to stabilize economies, restore investor confidence, and lay the groundwork for recovery.
3. Technical Assistance and Capacity Development
The IMF helps countries strengthen their institutions and human capital through training and technical assistance. This covers areas like fiscal policy, central banking, statistics, and legal frameworks. Such capacity-building programs are crucial for developing nations seeking to modernize their economies and manage resources effectively.
IMF’s Role in Global Financial Crises
The IMF has been central in managing several major financial crises throughout history. Its interventions have often defined the path of global recovery.
1. The Latin American Debt Crisis (1980s)
During the 1980s, many Latin American countries defaulted on their debts due to rising interest rates and falling commodity prices. The IMF stepped in with stabilization programs aimed at restructuring debt and curbing inflation. Although these programs helped restore macroeconomic stability, they were also criticized for imposing austerity measures that deepened poverty.
2. The Asian Financial Crisis (1997–1998)
The crisis that began in Thailand spread rapidly across East Asia, leading to currency collapses and severe recessions. The IMF provided substantial financial packages to countries like Indonesia, South Korea, and Thailand. However, its insistence on fiscal austerity and structural reforms was controversial, with some critics arguing that these policies worsened the downturn. Nonetheless, the IMF later adapted its approach, incorporating lessons from this crisis.
3. The Global Financial Crisis (2008–2009)
The 2008 crisis marked a turning point for the IMF. For the first time in decades, advanced economies sought IMF advice and support. The institution played a key role in coordinating global stimulus measures, advising on monetary easing, and supporting emerging economies with emergency funds. The IMF also increased its lending capacity and introduced flexible credit lines to respond more effectively to future shocks.
4. The COVID-19 Pandemic (2020–2022)
The pandemic triggered an unprecedented global economic shutdown. The IMF acted swiftly, approving over $250 billion in financial support to more than 90 countries. It created emergency lending mechanisms and temporarily suspended debt payments for low-income countries. The IMF also emphasized inclusive recovery, digital transformation, and climate resilience as new priorities.
IMF’s Role in Developing Economies
Beyond crisis management, the IMF plays a vital role in supporting developing and low-income nations. Through its Poverty Reduction and Growth Trust (PRGT) and Extended Credit Facility (ECF), the IMF offers low-interest or interest-free loans to promote sustainable growth.
The IMF’s support extends to:
Encouraging fiscal responsibility and public financial management.
Advising on tax reforms to improve revenue collection.
Supporting exchange rate stability and foreign reserve management.
Promoting structural reforms that attract investment and create jobs.
However, the IMF’s involvement in developing countries is often debated. Critics argue that its policy prescriptions sometimes prioritize financial stability over social welfare. In response, the IMF has increasingly integrated social spending protections and climate policies into its programs.
Criticisms and Controversies
Despite its critical role, the IMF has faced substantial criticism over the years:
Austerity Measures:
IMF programs often require governments to cut public spending and increase taxes, leading to social unrest and inequality.
Sovereignty Concerns:
Countries receiving IMF loans must often implement policy reforms dictated by the Fund, which some view as external interference.
Western Dominance:
The United States and European countries hold disproportionate voting power, raising questions about fairness and representation.
One-Size-Fits-All Policies:
Critics argue that the IMF’s macroeconomic models do not always account for the unique conditions of individual economies.
Slow Adaptation to Climate and Inequality Issues:
Although the IMF has recently embraced climate finance and inclusive growth, its traditional focus on fiscal stability sometimes limits flexibility.
Despite these criticisms, the IMF has made significant efforts to reform its approach—introducing debt sustainability analyses, gender equality frameworks, and climate resilience funding.
IMF’s Modern Role: A Shift Toward Sustainability
In recent years, the IMF’s priorities have broadened beyond financial stability to encompass inclusive and sustainable development. Key initiatives include:
Climate Change:
The IMF now assesses climate risks in its surveillance and offers support for green transitions through its Resilience and Sustainability Trust (RST).
Digital Finance:
It monitors the rise of central bank digital currencies (CBDCs) and crypto-assets, ensuring global financial stability in the digital era.
Gender Equality and Social Inclusion:
Recognizing that inequality can undermine growth, the IMF integrates social spending and gender equality goals into its programs.
Debt Transparency:
It promotes clear reporting of public debt to avoid hidden liabilities that could trigger future crises.
These reforms signify the IMF’s evolution into a comprehensive guardian of global stability, addressing not only monetary issues but also social and environmental challenges.
Conclusion
The International Monetary Fund remains a cornerstone of the global financial system. From its origins in the post-war era to its modern-day role in managing crises, supporting development, and promoting sustainability, the IMF has continuously adapted to a changing world.
Its crucial role lies in balancing economic stability with social progress, bridging the gap between nations, and offering a safety net in times of uncertainty. Despite its flaws and criticisms, the IMF’s presence ensures that no nation stands alone in the face of economic turbulence. As globalization deepens and new challenges—like digital disruption and climate change—emerge, the IMF’s role will become even more essential in shaping a resilient, inclusive, and sustainable world economy.
Global Property SurgeUnderstanding the Boom in Real Estate Markets Worldwide
Over the past decade, the world has witnessed an extraordinary surge in property prices across both developed and emerging economies. This global property surge has reshaped housing markets, altered wealth distribution, and prompted major policy responses from governments and central banks. The phenomenon is driven by a complex interplay of economic, demographic, and geopolitical factors — including low interest rates, pandemic-era shifts, urbanization, foreign investments, and the evolving role of real estate as an asset class. In this comprehensive analysis, we explore the causes, characteristics, impacts, and potential future trajectories of the global property surge in approximately 1500 words.
1. Historical Context: From Stability to Surge
Historically, property markets tended to move in relatively predictable cycles driven by local demand, income growth, and credit conditions. However, since the early 2010s, global real estate has transformed into a highly interconnected financial asset class. Following the 2008 global financial crisis, central banks worldwide adopted ultra-low interest rates and quantitative easing to stimulate growth. These measures made borrowing cheaper than ever, encouraging both households and investors to pour money into real estate.
The 2020–2022 COVID-19 pandemic further accelerated this surge. As economies locked down and stock markets turned volatile, real estate emerged as a safe and tangible store of value. Work-from-home trends reshaped living preferences, boosting demand for suburban and rural properties. The combination of limited supply, cheap money, and changing lifestyles ignited property booms from Sydney to Toronto, from London to Mumbai.
2. Key Drivers of the Global Property Surge
a. Ultra-Low Interest Rates
Central banks like the U.S. Federal Reserve, the European Central Bank, and the Bank of Japan slashed interest rates to near zero. Low borrowing costs reduced mortgage repayments, allowing buyers to afford higher-priced homes. Simultaneously, investors searching for yield turned to real estate for better returns than traditional savings or bonds.
b. Limited Supply and Urbanization
Global population growth and rapid urbanization intensified housing shortages. In cities like Hong Kong, London, and San Francisco, land scarcity and restrictive zoning regulations created supply bottlenecks. The imbalance between supply and demand pushed property values higher year after year.
c. Foreign and Institutional Investment
Real estate has increasingly attracted foreign and institutional investors. Sovereign wealth funds, private equity firms, and pension funds view property as a stable, inflation-resistant asset. Foreign capital inflows into major cities — especially from China, the Middle East, and Europe — have inflated prices, sometimes pricing out local buyers.
d. Inflation Hedge and Store of Value
Real estate serves as a traditional hedge against inflation. As currencies depreciate and costs rise, tangible assets like land and housing tend to maintain or increase in value. With rising inflation in the 2020s, investors flocked to property markets as a defensive strategy.
e. Digitalization and Real Estate Technology
Technological innovation in property transactions, data analytics, and financing platforms has made global real estate more accessible. PropTech companies, blockchain-based land registries, and digital marketplaces have simplified international investment, leading to greater capital mobility.
3. Regional Dynamics of the Surge
a. North America
The U.S. and Canadian housing markets have experienced dramatic growth. In the U.S., cities such as Austin, Miami, and Phoenix saw price increases of over 30–40% between 2020 and 2023. Cheap mortgages, limited inventory, and migration from urban to suburban areas fueled this boom. In Canada, markets like Toronto and Vancouver reached record highs, supported by foreign investments and immigration.
b. Europe
European property markets saw uneven growth. While Southern Europe (Spain, Italy, Greece) recovered slowly post-crisis, Northern and Western Europe — especially Germany, the Netherlands, and the U.K. — saw soaring prices. London and Berlin became magnets for global investors, though affordability concerns led to regulatory crackdowns, including rent caps and foreign buyer taxes.
c. Asia-Pacific
Asia witnessed one of the strongest property surges. In China, years of urban expansion and speculative investment drove housing prices to unsustainable levels, prompting government intervention. Australia and New Zealand saw housing affordability crisis levels, leading to tax reforms and stricter lending standards. Meanwhile, India’s urban centers — Mumbai, Bengaluru, Delhi — witnessed a post-pandemic revival driven by economic recovery and infrastructure growth.
d. Middle East and Africa
The Middle East, particularly Dubai, experienced a renewed boom as foreign investors sought tax advantages and luxury developments. Dubai’s property market rebounded sharply after 2020, supported by economic diversification and visa reforms. In Africa, cities like Nairobi, Lagos, and Cape Town saw increasing investment, driven by rapid urbanization and diaspora capital.
e. Latin America
Latin American real estate saw mixed trends. Countries with political instability or currency devaluation, like Argentina and Venezuela, struggled to attract stable investments. However, Mexico, Brazil, and Chile benefited from growing middle-class demand and tourism-driven development.
4. Socioeconomic Impacts of the Property Boom
a. Widening Wealth Inequality
Property ownership has become a key determinant of wealth. Rising prices have benefited asset owners while excluding younger generations and lower-income groups. In many cities, housing affordability has deteriorated, creating “generation rent” — people who can afford only to rent, not buy.
b. Rising Rent and Living Costs
As housing becomes scarce and expensive, rents have risen significantly, putting pressure on household budgets. This has fueled social and political debates over housing as a human right versus a financial asset.
c. Urban Sprawl and Environmental Strain
The search for affordable housing has pushed development to suburban and rural areas, leading to urban sprawl, deforestation, and increased commuting times. The construction boom has also raised concerns over sustainability and carbon emissions.
d. Financial Risks and Market Speculation
Rapid price escalation often breeds speculative behavior. Investors purchasing properties solely for price appreciation can inflate bubbles. If interest rates rise or economies slow, property markets risk sharp corrections. China’s Evergrande crisis exemplifies how overleveraged real estate sectors can threaten financial stability.
5. Government and Policy Responses
To control overheating housing markets, many governments have introduced a range of policy measures:
Monetary Tightening: Central banks, including the U.S. Federal Reserve and European Central Bank, began raising interest rates in 2022–2023 to curb inflation. This cooled some markets, but prices in high-demand areas remain resilient.
Macroprudential Regulations: Countries like Canada and New Zealand imposed stricter mortgage rules, such as higher down payments and limits on investor loans, to prevent excessive speculation.
Foreign Buyer Restrictions: Governments in Australia, Canada, and Singapore restricted foreign property purchases to protect local affordability.
Affordable Housing Initiatives: Some nations launched large-scale housing projects, rent control laws, and subsidies for first-time buyers to restore balance.
Property Taxes: Higher property or vacancy taxes were introduced in major cities to discourage speculative holdings and vacant investment properties.
6. Post-Pandemic Adjustments and Interest Rate Shifts
As the global economy emerged from the pandemic, inflation surged due to supply chain disruptions and energy price shocks. Central banks responded by hiking interest rates aggressively. This marked a turning point for global property markets.
In the U.S., mortgage rates more than doubled from their 2021 lows, cooling demand and leading to slight price corrections in overheated markets. Europe saw similar slowdowns, while Asia-Pacific remained more mixed. Despite short-term adjustments, structural shortages and urban migration continued to support long-term price growth.
7. The Rise of Alternative Real Estate Segments
The property surge also extended beyond residential housing:
Commercial Real Estate: While traditional office spaces suffered from remote work trends, logistics and warehousing boomed due to e-commerce expansion.
Luxury and Vacation Homes: Wealthy investors turned to luxury villas, second homes, and resort properties in scenic destinations like Bali, Dubai, and the Mediterranean.
Green and Smart Buildings: Sustainability-focused real estate gained prominence as investors prioritized energy efficiency, green certifications, and smart technologies.
Co-living and Co-working Spaces: Urban millennials increasingly preferred flexible living and working arrangements, fostering a new sub-sector of real estate innovation.
8. Long-Term Outlook: Boom, Plateau, or Correction?
The question remains: Is the global property surge sustainable? Analysts offer varying views.
a. Optimistic Scenario
Proponents argue that global housing demand remains structurally strong due to urbanization, migration, and demographic growth. Limited land supply and construction delays will continue to support prices. Moreover, real estate remains a hedge against inflation and currency depreciation.
b. Pessimistic Scenario
Skeptics warn of overvaluation and the potential for price corrections, particularly in overheated markets like Canada, Australia, and parts of Asia. Rising borrowing costs and declining affordability could lead to reduced demand, defaults, and even mini-bubbles bursting.
c. Moderate Scenario
The most likely outcome may be a gradual stabilization. Prices could plateau as rising interest rates cool demand while long-term fundamentals like population growth and supply shortages sustain a baseline of value. Governments will play a crucial role in balancing affordability with market stability.
9. Future Trends in Global Real Estate
Looking ahead, several transformative trends will define the next phase of the global property market:
Sustainability and Green Development: Energy-efficient and carbon-neutral buildings will dominate future construction.
Digital Real Estate and Tokenization: Blockchain-based property ownership and fractional investment models will democratize access to global assets.
Remote Work and Hybrid Cities: The reshaping of cities will continue as flexible work arrangements reduce the need for dense office districts.
Demographic Shifts: Aging populations in developed nations and youth-driven demand in emerging economies will create divergent regional patterns.
Governmental Regulation: More countries will adopt policies to cool speculative demand and promote affordable housing.
Conclusion
The global property surge is more than a housing trend — it is a reflection of broader economic transformations, technological advancements, and societal changes. While property markets have delivered immense wealth to owners and investors, they have also deepened inequality and raised pressing policy challenges.
As the world navigates a new era of higher interest rates, inflationary pressures, and climate imperatives, real estate must evolve beyond speculation and luxury toward sustainability, inclusivity, and affordability. The future of global property lies in balancing financial opportunity with social responsibility — ensuring that homes are not just investments but foundations of human stability and progress.

Investing in the World Market: A Global PerspectiveIntroduction
In today’s interconnected global economy, investing is no longer limited by national borders. The expansion of technology, communication, and international finance has enabled investors from every corner of the world to participate in global markets. Whether it’s buying shares in a European automaker, investing in Asian technology startups, or purchasing U.S. Treasury bonds, the opportunities for global investing have multiplied. Investing in the world market allows individuals and institutions to diversify portfolios, access high-growth economies, and reduce risk through global exposure. However, it also introduces complexities such as currency risk, geopolitical tensions, and varying regulatory frameworks.
This essay explores the concept of world market investing, its benefits, key strategies, associated risks, and how investors can position themselves for long-term global success.
1. Understanding the World Market
The world market refers to the aggregate of all financial markets where securities, commodities, currencies, and other assets are traded internationally. It includes stock exchanges, bond markets, forex, and derivatives markets across developed and emerging economies.
Key components of the world market include:
Global Equity Markets – Stocks traded across countries such as the U.S., Japan, China, the U.K., Germany, and India.
Bond Markets – Governments and corporations issue debt instruments to global investors seeking fixed returns.
Foreign Exchange Market (Forex) – The world’s largest financial market, where currencies are traded 24/7.
Commodities Market – Trading in physical goods like oil, gold, and agricultural products.
Emerging Market Investments – Investments in rapidly growing economies offering higher potential returns.
Investing in these markets provides investors with access to diverse economic cycles, industries, and currencies, making it an essential part of modern portfolio management.
2. Evolution of Global Investing
The journey of world market investing has evolved significantly over time. Before the 1980s, most investors focused on domestic assets due to limited access to foreign exchanges. However, with globalization and technological advancements, financial integration accelerated.
1980s–1990s: Globalization of capital markets began. Mutual funds and international ETFs emerged, allowing small investors to access foreign equities.
2000s: The rise of the internet, deregulation, and electronic trading platforms opened cross-border investing to retail participants.
2010s–2020s: The integration of artificial intelligence, fintech platforms, and online brokers such as Interactive Brokers and eToro made investing in foreign markets seamless and affordable.
Today, investors can diversify portfolios globally within minutes, using technology that once was accessible only to large institutions.
3. Why Invest in the World Market?
a. Diversification
Global investing reduces the risk of concentration in one economy. When one region underperforms, another may thrive. For instance, during the 2008 U.S. financial crisis, some Asian markets showed resilience.
b. Access to Growth Opportunities
Developing economies in Asia, Africa, and Latin America are expected to lead global economic expansion. Investing internationally allows participation in this growth story.
c. Currency Benefits
Investing in multiple currencies can protect against domestic currency depreciation. For example, if an investor from India holds U.S. dollar assets, a fall in the rupee can boost returns when converted back to local currency.
d. Exposure to Global Innovation
Technology and biotechnology companies in the U.S. and Asia are leading global innovation. Investing internationally provides exposure to sectors not available domestically.
e. Inflation Hedge
Certain global assets, like commodities and real estate investment trusts (REITs), can serve as inflation hedges, maintaining purchasing power across economic cycles.
4. Types of World Market Investments
a. International Stocks and ETFs
Investors can directly buy foreign company shares or invest through exchange-traded funds (ETFs) that track international indexes such as the MSCI World Index or FTSE Global All Cap Index.
b. Global Mutual Funds
Mutual funds that invest across several countries provide professional management and diversification for investors who prefer a hands-off approach.
c. Bonds and Fixed Income Securities
Sovereign bonds from developed nations (e.g., U.S. Treasuries) offer safety, while emerging market bonds offer higher yields.
d. Commodities
Investing in gold, oil, and agricultural products can provide portfolio stability during market volatility.
e. Real Estate and REITs
Global REITs allow investors to access real estate markets in cities like London, Singapore, or New York without buying property directly.
f. Alternative Assets
Private equity, hedge funds, and infrastructure investments are increasingly global, offering diversification beyond traditional asset classes.
5. Strategies for Global Market Investing
a. Top-Down Approach
This involves analyzing global macroeconomic trends, identifying strong economies, and then selecting sectors or companies within those regions.
b. Bottom-Up Approach
Investors focus on company fundamentals — profitability, valuation, and management quality — irrespective of location.
c. Regional Allocation Strategy
Investors allocate funds across continents or countries to balance risk. For instance, 40% in North America, 30% in Asia-Pacific, 20% in Europe, and 10% in emerging markets.
d. Thematic Investing
Investing based on global themes such as renewable energy, digital transformation, or aging populations.
e. Passive vs Active Management
Passive Investing (via ETFs or index funds) tracks global indexes with low cost.
Active Investing involves fund managers seeking to outperform through research-driven decisions.
f. Dollar-Cost Averaging
Investing a fixed amount regularly in global funds can reduce timing risk and average out entry costs.
6. Risks in World Market Investing
a. Currency Risk
Fluctuations in exchange rates can impact returns. A strong domestic currency can reduce the value of foreign investments when converted back.
b. Political and Geopolitical Risk
Elections, trade wars, sanctions, or conflicts (like U.S.-China tensions or the Russia-Ukraine war) can disrupt markets and reduce investor confidence.
c. Economic Instability
Recessions or debt crises in major economies can spill over globally, affecting emerging markets.
d. Regulatory Differences
Foreign investment laws, taxation, and reporting standards vary widely, adding complexity for global investors.
e. Liquidity Risk
Some international markets have lower trading volumes, making it harder to enter or exit positions efficiently.
f. Cultural and Information Barriers
Differences in business practices and language can lead to misinterpretation of company data or performance indicators.
7. Tools and Platforms for Global Investing
The rise of digital platforms has democratized access to international markets. Some popular tools include:
Online Brokerage Accounts: Interactive Brokers, Charles Schwab, and eToro allow global trading from one account.
Global ETFs and Index Funds: Products from Vanguard, iShares, and SPDR track international markets efficiently.
Robo-Advisors: Automated platforms like Betterment and Wealthfront build globally diversified portfolios based on risk tolerance.
Mobile Apps: Platforms like Groww, Zerodha, and INDmoney now provide Indian investors with direct access to U.S. equities.
These innovations have simplified global investing, reducing transaction costs and improving transparency.
8. Role of Emerging Markets
Emerging markets such as India, China, Brazil, and Indonesia play a growing role in global investing. They offer rapid GDP growth, young populations, and expanding middle classes.
However, these markets also come with higher volatility due to political instability, currency fluctuations, and limited regulatory oversight. Investors must weigh the potential for high returns against these risks.
A balanced global portfolio often includes a mix of developed markets (for stability) and emerging markets (for growth).
9. The Importance of Diversification
Diversification remains the cornerstone of world market investing. By spreading investments across different regions, sectors, and currencies, investors can mitigate risks associated with any single economy or event.
For example, during the European debt crisis, U.S. and Asian markets provided stability. Similarly, when technology stocks in the U.S. underperform, commodity-rich nations or Asian manufacturing hubs may deliver better returns.
Effective diversification smooths portfolio performance and enhances long-term wealth creation.
10. Long-Term Outlook of Global Investing
The future of world market investing is being shaped by several powerful trends:
a. Technological Advancements
Artificial intelligence, blockchain, and digital trading platforms are revolutionizing access to global assets. Tokenization of securities may allow fractional ownership of foreign companies or properties.
b. Sustainable Investing (ESG)
Environmental, Social, and Governance (ESG) factors are becoming global standards. Investors increasingly favor companies with sustainable and ethical business models.
c. Global Economic Shifts
The economic center of gravity is gradually moving toward Asia, especially China and India. Investors who position early in these markets may benefit from the next wave of growth.
d. Increased Retail Participation
Retail investors, empowered by mobile apps and online education, are participating in world markets like never before.
e. Institutional Globalization
Large funds, pension plans, and sovereign wealth funds continue to allocate significant capital across borders, maintaining liquidity and integration in global markets.
11. Steps for Successful Global Investing
Define Financial Goals: Determine whether your focus is growth, income, or capital preservation.
Assess Risk Tolerance: International markets can be volatile; align investments with your comfort level.
Start with Global Funds: Beginners can use global mutual funds or ETFs before direct stock investing.
Monitor Currency Movements: Keep track of forex trends affecting international returns.
Stay Informed: Follow global economic indicators, interest rate changes, and geopolitical developments.
Rebalance Regularly: Adjust your portfolio periodically to maintain target allocations.
12. Conclusion
Investing in the world market is not just an option—it’s a necessity in the modern financial era. Global markets offer unmatched opportunities for diversification, innovation exposure, and growth potential. With the right knowledge, risk management, and tools, investors can turn global investing into a long-term wealth-building strategy.
While risks such as currency fluctuations, geopolitical instability, and economic cycles persist, prudent diversification and disciplined investing can mitigate them effectively. The global financial landscape will continue to evolve, offering investors new frontiers of opportunity in technology, sustainability, and emerging economies.
In essence, the future of investing is global — and those who embrace it stand to benefit from the ever-expanding opportunities of the interconnected world economy.

The Impact of International Trade PolicyIntroduction
International trade policy plays a central role in shaping the global economic landscape. It encompasses the set of laws, agreements, and regulations that govern how countries trade goods, services, and capital across borders. The policies that a nation adopts determine its trade openness, competitiveness, and relationship with other economies. These decisions influence economic growth, employment, industrialization, innovation, and even geopolitical alliances. Over time, trade policy has evolved from protectionist models to liberalized frameworks, reflecting changing political ideologies and global economic realities.
The impact of international trade policies is profound. They influence prices, productivity, income distribution, and global supply chains. Whether it’s tariffs, quotas, free trade agreements, or export subsidies, every trade measure carries consequences for domestic industries and the international community. Understanding the implications of these policies helps policymakers strike a balance between protecting local interests and promoting global cooperation.
1. The Nature and Objectives of International Trade Policy
International trade policy refers to the set of strategies and regulations that guide a country’s transactions with other nations. The primary objectives of trade policy include:
Promoting Economic Growth:
Trade policies aim to enhance national income through exports and foreign investments. By opening markets, countries can leverage comparative advantages and increase efficiency.
Protecting Domestic Industries:
Some trade policies impose tariffs or quotas to shield local producers from foreign competition, particularly in emerging sectors.
Ensuring Balance of Payments Stability:
Trade regulations help maintain equilibrium between imports and exports, reducing dependence on foreign debt.
Encouraging Employment:
Strategic trade policies promote industries that create jobs and sustain livelihoods.
Advancing Geopolitical Goals:
Trade policies are also used to strengthen diplomatic ties or exert economic pressure, such as through sanctions or preferential trade agreements.
Fostering Innovation and Technology Transfer:
Open trade environments often accelerate the diffusion of technology and innovation across borders.
Ultimately, international trade policy reflects the economic philosophy of a nation—whether it leans toward protectionism or free trade liberalization.
2. Major Instruments of Trade Policy
Trade policy uses a range of instruments to regulate international transactions:
a. Tariffs
Tariffs are taxes imposed on imported goods. They raise import prices, protecting domestic industries from cheaper foreign products. However, high tariffs can provoke retaliation and reduce global trade efficiency.
b. Quotas
Quotas limit the quantity of goods that can be imported or exported. While they protect local industries, they often lead to inefficiencies and higher consumer prices.
c. Export Subsidies
Subsidies encourage domestic firms to export by lowering production costs. While this can boost competitiveness, it may distort market competition and lead to trade disputes.
d. Trade Agreements
Bilateral, regional, or multilateral agreements—such as NAFTA (now USMCA), the European Union, or ASEAN—facilitate freer movement of goods and services by reducing barriers.
e. Non-Tariff Barriers
These include product standards, licensing requirements, and customs procedures that indirectly restrict trade.
f. Exchange Rate Policies
A country’s currency valuation can influence trade competitiveness. A depreciated currency makes exports cheaper and imports costlier, affecting trade balances.
Each of these instruments has a specific impact on domestic markets and the global economy.
3. Historical Evolution of International Trade Policy
The history of trade policy reflects the global struggle between protectionism and liberalization.
Mercantilist Era (16th–18th Century):
Nations viewed wealth in terms of gold and silver reserves. They imposed high tariffs to maximize exports and minimize imports.
Free Trade Movement (19th Century):
The Industrial Revolution and the works of economists like Adam Smith and David Ricardo popularized the idea of comparative advantage, leading to lower tariffs and greater global trade.
Post–World War II Liberalization:
The establishment of the General Agreement on Tariffs and Trade (GATT) in 1947 marked a turning point toward multilateral trade liberalization.
World Trade Organization (WTO) Era (1995–Present):
The WTO institutionalized global trade rules and dispute resolution mechanisms, promoting freer and fairer international commerce.
Recent Protectionist Resurgence:
Events like Brexit, U.S.–China trade tensions, and supply chain disruptions have reignited debates over economic nationalism and trade protectionism.
This historical evolution shows that trade policy continuously adapts to changing political and economic dynamics.
4. Economic Impact of International Trade Policy
a. Impact on Economic Growth
Open trade policies generally promote higher growth. Countries like South Korea, Singapore, and Germany have leveraged export-led strategies to achieve rapid industrialization. By contrast, overly restrictive policies often hinder competitiveness and innovation.
b. Impact on Employment
Trade liberalization can both create and destroy jobs. While export industries grow and employ more workers, import-competing sectors may experience layoffs. Hence, labor retraining and social safety nets are crucial to manage transitions.
c. Impact on Prices and Inflation
Trade liberalization reduces the cost of imported goods, benefiting consumers with lower prices. Conversely, protectionist tariffs increase costs and contribute to inflationary pressures.
d. Impact on Industrial Development
Strategic trade policies can nurture infant industries by protecting them from international competition until they become globally competitive—a strategy used successfully by Japan and China.
e. Impact on Income Distribution
Trade liberalization often benefits skilled workers and capital owners, while unskilled labor may face downward pressure on wages. Thus, inequality may rise without inclusive policies.
5. Political and Social Implications
International trade policy is not merely economic—it is deeply political. Trade decisions influence national sovereignty, labor rights, and even cultural identity.
Political Influence:
Governments use trade policy as a diplomatic tool. Sanctions, embargoes, or preferential agreements can shift power balances in international relations.
Social Consequences:
Global trade can reshape social structures. While it creates wealth, it can also lead to job displacement and social unrest if benefits are unevenly distributed.
Environmental Impact:
Trade policies can either encourage sustainable practices through green standards or exacerbate environmental degradation through overexploitation of resources.
6. The Role of International Institutions
Institutions like the World Trade Organization (WTO), International Monetary Fund (IMF), and World Bank play critical roles in shaping and enforcing trade policy.
World Trade Organization (WTO):
The WTO ensures that trade flows as smoothly and fairly as possible by setting global rules and resolving disputes.
International Monetary Fund (IMF):
The IMF stabilizes exchange rates and provides financial assistance to countries facing balance-of-payments crises, indirectly supporting trade stability.
World Bank:
The World Bank supports trade-related infrastructure and development projects to integrate developing nations into the global economy.
These institutions provide a framework for cooperation, transparency, and accountability in global trade.
7. Regional Trade Agreements and Blocs
Regional integration has become a cornerstone of modern trade policy. Examples include:
European Union (EU):
A single market allowing free movement of goods, services, labor, and capital among member states.
North American Free Trade Agreement (NAFTA/USMCA):
Strengthens trade ties between the U.S., Canada, and Mexico by reducing tariffs and harmonizing regulations.
Association of Southeast Asian Nations (ASEAN):
Promotes economic cooperation and market integration in Southeast Asia.
African Continental Free Trade Area (AfCFTA):
Aims to create a unified market across Africa, enhancing intra-continental trade.
These agreements stimulate economic cooperation and regional stability while creating large integrated markets that attract foreign investment.
8. Trade Policy Challenges in the 21st Century
Modern trade policy faces several emerging challenges:
Protectionism and Trade Wars:
Rising nationalism has led to tariff battles, particularly between major economies like the U.S. and China.
Digital Trade and E-Commerce:
Policies must adapt to data flows, digital services, and cybersecurity concerns in global online commerce.
Supply Chain Disruptions:
Events like the COVID-19 pandemic exposed the vulnerabilities of global supply chains, prompting calls for “reshoring” or “friend-shoring.”
Climate Change and Green Trade Policies:
Nations are incorporating environmental standards into trade deals to encourage sustainable production and carbon reduction.
Inequality and Labor Standards:
Policymakers must address the social costs of globalization, ensuring fair wages and ethical labor practices.
Technological Advancements:
Automation, AI, and robotics influence trade competitiveness, requiring rethinking of industrial and education policies.
9. Impact on Developing Economies
For developing countries, trade policy can be a double-edged sword.
Positive Impacts:
Trade liberalization opens access to global markets, encourages investment, and fosters technology transfer. Nations like Vietnam and Bangladesh have used export-oriented strategies to lift millions out of poverty.
Negative Impacts:
Weak infrastructure, lack of competitiveness, and dependency on raw material exports make developing economies vulnerable to global shocks. Poorly designed liberalization can lead to deindustrialization and income inequality.
Therefore, balanced trade policies that combine openness with domestic capacity building are crucial for sustainable development.
10. The Future of International Trade Policy
Looking ahead, the future of trade policy will likely focus on sustainability, digitalization, and inclusivity. The next generation of trade agreements will emphasize:
Green Trade: Incentivizing low-carbon production and renewable energy trade.
Digital Economy Governance: Regulating data flows, privacy, and digital taxation.
Resilient Supply Chains: Diversifying trade partners and promoting regional production hubs.
Inclusive Growth: Ensuring that trade benefits reach small businesses, women, and underrepresented communities.
Geopolitical Cooperation: Strengthening trade diplomacy to mitigate conflicts and foster global stability.
The trade policy of the future will balance national security with economic efficiency and social welfare.
Conclusion
International trade policy is one of the most powerful tools in shaping global prosperity and stability. Its impacts span economic growth, employment, innovation, and geopolitical relations. While liberalization has fostered unprecedented global integration, it has also exposed vulnerabilities—inequality, environmental strain, and dependence on fragile supply chains.
The challenge for policymakers lies in designing trade frameworks that are fair, resilient, and sustainable. Balancing national interests with global cooperation remains the cornerstone of effective trade policy. In an increasingly interconnected world, the success of any nation’s trade policy depends not only on its domestic priorities but also on its capacity to collaborate, adapt, and lead within the global economic system.

Scalping in the World Market:A Deep Dive into High-Speed TradingIntroduction
In the fast-paced world of financial markets, every second counts. Among the various trading strategies that traders employ to profit from price movements, scalping stands out as one of the most intense and rapid forms of trading. Scalping is a short-term trading technique where traders aim to make numerous small profits by taking advantage of minor price fluctuations throughout the trading day. It is practiced across the world markets — including equities, forex, commodities, and cryptocurrencies — and requires a unique blend of precision, technology, and psychological discipline.
Scalping has evolved alongside technological innovation. With the rise of algorithmic trading, high-frequency trading (HFT), and global interconnectivity, scalping has become a refined art and a science of exploiting micro-movements in price within seconds or even milliseconds. This essay explores the concept of scalping in global markets, its mechanisms, advantages, challenges, and the evolving landscape shaped by automation and regulation.
1. Understanding Scalping
Scalping is the fastest form of intraday trading, where traders open and close multiple positions within seconds or minutes. Unlike swing or positional traders who rely on long-term price trends, scalpers depend on the market’s immediate momentum and liquidity.
The goal of scalping is to accumulate small gains repeatedly, which, when aggregated, can lead to substantial daily profits. For example, a trader may target just 3 to 10 pips in the forex market or ₹0.50–₹1 in an Indian stock like Reliance Industries — but execute 100–200 trades in a single day.
Scalpers rely heavily on:
High liquidity (to enter and exit positions instantly),
Tight spreads (to minimize transaction costs),
Leverage (to amplify small price movements),
Fast execution (to avoid slippage).
2. The Core Principles of Scalping
Successful scalping requires adherence to certain core principles:
Speed and Timing:
Execution speed is critical. Scalpers use advanced trading platforms and direct market access (DMA) to ensure orders are executed without delay.
Volume and Frequency:
Scalpers execute numerous trades throughout the day. Profit per trade is small, but consistency is key.
Risk Management:
Because price movements are small, even a minor loss can offset several successful trades. Scalpers often use tight stop-loss levels.
Market Liquidity:
Scalping is most effective in highly liquid markets such as EUR/USD in forex, Nifty and Sensex futures in India, or S&P 500 in the U.S. where bid-ask spreads are minimal.
Psychological Discipline:
Scalping demands quick decision-making, emotional control, and strict adherence to rules. Hesitation or greed can lead to instant losses.
3. Scalping Across Global Markets
Scalping strategies are implemented differently across various global markets, depending on market structure, volatility, and liquidity.
a) Forex Market
The foreign exchange (forex) market is the most popular arena for scalping due to its 24-hour global operation and massive liquidity.
Key features include:
Pairs like EUR/USD, GBP/USD, and USD/JPY are ideal for scalping.
Traders focus on economic releases (like U.S. Non-Farm Payrolls or CPI data) that trigger sharp but brief volatility.
Scalpers exploit spreads and momentum using tools like tick charts, moving averages, and momentum indicators (RSI, Stochastic).
Automated systems or forex scalping bots are widely used to detect and act on price anomalies in milliseconds.
b) Stock Market
In equity markets, scalping is common among day traders and proprietary trading firms.
Examples include:
U.S. stocks like Apple, Tesla, and Nvidia, known for high daily volumes.
In India, Nifty 50 constituents such as HDFC Bank, Reliance, and Infosys attract scalpers due to tight spreads and liquidity.
Stock scalpers look for momentum patterns, news-based volatility, or order book imbalances. They might buy thousands of shares for seconds, targeting minimal profits before closing the position.
c) Futures and Commodities
Scalping in commodities and futures markets involves exploiting volatility in contracts like crude oil, gold, or agricultural futures.
Traders use tools like order flow analysis and depth of market (DOM) screens to gauge real-time liquidity and trading pressure.
d) Cryptocurrency Markets
The crypto market, operating 24/7, has become a paradise for scalpers.
Crypto scalpers focus on pairs like BTC/USDT, ETH/USDT, and SOL/USDT.
Due to crypto’s volatility and decentralized nature, price gaps can occur frequently — ideal for short bursts of profit.
However, exchange fees and latency issues can reduce profitability if not managed carefully.
4. Tools and Technologies Used in Scalping
Scalping in the modern world market is inseparable from technology. Traders leverage powerful tools and systems to execute high-speed trades.
Advanced Trading Platforms:
Tools like MetaTrader 5, NinjaTrader, and ThinkorSwim offer real-time data and one-click execution.
Direct Market Access (DMA):
Allows traders to bypass brokers’ delays and interact directly with exchange order books.
Algorithmic Trading Systems:
Algorithms identify opportunities based on pre-set criteria — momentum, volatility, or volume spikes — and execute trades automatically.
High-Frequency Trading (HFT):
HFT firms use co-located servers near exchange data centers to minimize latency, executing thousands of trades per second.
Scalping Indicators:
Popular technical indicators for scalping include:
Moving Averages (MA & EMA crossover)
Bollinger Bands
Relative Strength Index (RSI)
Volume Weighted Average Price (VWAP)
Stochastic Oscillator
Order Book and Tape Reading:
Scalpers often study the Level 2 market data or time and sales (T&S) to identify buy/sell pressure.
5. Common Scalping Strategies
Several refined strategies are used across markets:
a) Market-Making Scalping
The trader continuously buys and sells around the current market price, profiting from bid-ask spreads. This is common among institutional scalpers.
b) Momentum Scalping
Scalpers enter trades in the direction of strong momentum, capturing the initial burst of price movement before retracement.
c) Breakout Scalping
When price breaks through key support or resistance levels, scalpers enter immediately to profit from quick follow-through moves.
d) News-Based Scalping
Economic or corporate news creates temporary volatility. Scalpers take advantage of short-lived surges in liquidity and price movement.
e) Range Scalping
When the market is moving sideways, traders buy at support and sell at resistance repeatedly for small gains.
6. Advantages of Scalping in Global Markets
Quick Profits:
Scalping allows traders to capitalize on even the smallest market fluctuations multiple times a day.
Reduced Overnight Risk:
Since all positions are closed within the day, scalpers avoid overnight news or gap risks.
Constant Opportunities:
In volatile and liquid markets like forex or crypto, there are always micro-movements to trade.
Lower Exposure to Market Trends:
Long-term trends or macroeconomic shifts have minimal effect on a scalper’s strategy.
Compounding Potential:
Small profits, if made consistently and reinvested, can lead to exponential growth over time.
7. Challenges and Risks of Scalping
While potentially lucrative, scalping carries significant challenges:
High Transaction Costs:
Multiple trades lead to substantial brokerage and commission expenses, reducing net profit margins.
Execution Speed Dependency:
Delays in order execution or slippage can turn profitable setups into losses within seconds.
Psychological Stress:
Constant focus, speed, and decision-making can be mentally exhausting.
Limited Profit Margin:
Each trade yields very little. A few losing trades can wipe out hours of gains.
Broker Restrictions:
Some brokers discourage scalping due to its demand for resources and liquidity. They may impose minimum time limits on trade duration.
Market Noise:
Scalping often occurs amid unpredictable short-term noise, increasing the risk of false signals.
8. Regulatory and Ethical Considerations
Scalping operates within a complex regulatory framework that varies by region:
In the U.S., the SEC and FINRA monitor trading activity to prevent market manipulation and unfair HFT practices.
In India, SEBI imposes strict margin and trading rules for intraday traders to prevent excessive risk-taking.
In Europe, ESMA (European Securities and Markets Authority) oversees algorithmic trading to maintain transparency and fairness.
While scalping itself is legal, front-running, spoofing, or quote stuffing are illegal activities often associated with unethical HFT scalping.
9. The Role of Artificial Intelligence in Scalping
Modern scalping has been revolutionized by artificial intelligence (AI) and machine learning (ML).
AI systems can:
Analyze millions of data points in real-time,
Detect micro-trends invisible to humans,
Adapt strategies dynamically to changing volatility.
For example, reinforcement learning algorithms continuously optimize execution timing, while predictive analytics models forecast micro price shifts milliseconds ahead.
AI-based scalping bots now dominate global markets — especially in forex, equities, and crypto exchanges — representing a new era of autonomous high-frequency trading.
10. Future of Scalping in Global Markets
The future of scalping is being shaped by several trends:
Technological Evolution:
Quantum computing and ultra-low latency networks will further accelerate trade execution.
Tighter Regulation:
Regulators may impose stricter measures to curb manipulation and ensure market fairness.
Increased Retail Participation:
With access to zero-commission platforms and advanced analytics tools, retail traders are now entering the scalping domain.
Integration of AI and Blockchain:
Blockchain-based exchanges offering transparent and decentralized order books could redefine scalping strategies.
Cross-Market Scalping:
Traders may increasingly arbitrage between stock indices, forex pairs, and crypto assets, exploiting correlation inefficiencies.
Conclusion
Scalping represents the essence of high-speed global trading, combining technology, psychology, and precision to extract profits from fleeting market inefficiencies. It is not for everyone — the intensity, costs, and risks are substantial — but for disciplined and technologically equipped traders, it offers a consistent edge in liquid markets.
As global markets continue to evolve with innovations in AI, automation, and digital assets, scalping will remain at the cutting edge of trading strategy. The future of scalping will likely be smarter, faster, and more data-driven than ever before — shaping the pulse of the world’s financial ecosystems one tick at a time.
Global Trade and Its Impact on Currency ShiftsIntroduction
In the complex web of global economics, trade and currency movements are inseparably linked. The value of a nation’s currency is not determined in isolation but reflects the balance of its trade relationships, capital flows, and macroeconomic conditions. Global trade—comprising exports, imports, and cross-border investments—plays a crucial role in determining currency demand and supply. When trade flows shift due to policy changes, geopolitical developments, or technological advancements, they often trigger corresponding movements in currency values.
This essay explores how global trade impacts currency shifts by examining trade balances, exchange rate mechanisms, capital flows, commodity cycles, and geopolitical factors. It also delves into how trade-driven currency shifts affect economies, businesses, and global financial stability.
1. The Link Between Trade and Currency Value
At its core, global trade affects currency through demand and supply dynamics. When a country exports goods or services, foreign buyers must purchase its currency to pay for those exports. This increases demand for the exporter’s currency, leading to appreciation. Conversely, when a country imports more than it exports, it must convert its currency to buy foreign goods, increasing the supply of its currency in global markets and potentially leading to depreciation.
For example, when global demand for German automobiles or Japanese electronics rises, the euro and yen often strengthen because international buyers must acquire those currencies to pay for imports. Similarly, when the United States runs persistent trade deficits, the U.S. dollar experiences downward pressure—although it often remains strong due to its status as the world’s reserve currency.
In short, trade balances—exports minus imports—directly influence currency demand and valuation.
2. Trade Balances and Exchange Rates
A nation’s current account balance is a key determinant of long-term exchange rate movements. The current account includes trade in goods and services, net income from abroad, and net transfer payments. A trade surplus indicates more exports than imports, leading to net foreign currency inflows and upward pressure on the domestic currency. A trade deficit has the opposite effect.
Example: The U.S. Dollar and Trade Deficit
Despite running consistent trade deficits, the U.S. dollar remains relatively strong due to high global demand for U.S. assets, Treasury securities, and the dollar’s dominance in international trade settlements. However, persistent deficits can create structural vulnerabilities, particularly if foreign investors lose confidence in U.S. fiscal sustainability.
Example: China’s Trade Surplus and Yuan Stability
China’s consistent trade surpluses, driven by its manufacturing exports, have historically supported the yuan (renminbi). Although China manages its currency through capital controls and intervention, its export-led model generates strong foreign exchange inflows that support currency stability.
Thus, trade balances serve as a key long-term anchor for currency valuation, even as short-term movements may be driven by speculation and interest rate differentials.
3. Exchange Rate Regimes and Trade Impacts
Exchange rate systems also shape how global trade affects currencies. Broadly, exchange rate regimes can be divided into floating, fixed, and managed float systems.
Floating Exchange Rates (e.g., U.S., U.K., Japan): Market forces of supply and demand determine currency value. Trade imbalances quickly translate into currency shifts.
Fixed Exchange Rates (e.g., Gulf nations pegged to USD): Governments or central banks maintain a fixed value against another currency. Trade impacts are mitigated through central bank intervention.
Managed Float (e.g., China, India): Authorities allow market forces some role but intervene periodically to stabilize the currency.
In floating systems, an increase in exports strengthens the currency, which can eventually make exports less competitive—a self-correcting mechanism. In contrast, countries with fixed exchange rates must adjust through monetary or fiscal policy rather than currency depreciation.
4. Capital Flows and Trade-Linked Currency Movements
Global trade and capital flows are two sides of the same coin. A country running a trade surplus typically becomes a net lender to the rest of the world, investing its excess savings abroad. Conversely, a trade-deficit country must borrow or attract capital inflows to finance its deficit.
This dynamic influences currency movements through the financial account of the balance of payments. For instance:
If a country imports more than it exports, but foreign investors purchase its bonds, equities, or real estate, the inflow of foreign capital can offset currency depreciation.
However, if capital inflows dry up due to political or economic instability, the currency can weaken sharply, as seen during the Asian Financial Crisis (1997–1998), when several Southeast Asian currencies collapsed following rapid capital flight.
Therefore, trade imbalances often lead to corresponding capital flow adjustments that can amplify or counteract currency shifts.
5. Commodity Prices and Terms of Trade
Commodity-dependent economies are highly sensitive to global trade trends and price cycles. When the prices of key exports—like oil, metals, or agricultural goods—rise, commodity exporters’ currencies appreciate, while importers’ currencies depreciate.
Case Study: The “Petro-Currency” Effect
Currencies of oil-exporting nations like Saudi Arabia, Russia, and Canada tend to strengthen when oil prices rise because global buyers must purchase their currencies to pay for energy imports. Conversely, when oil prices fall, these currencies often weaken, reflecting reduced export revenues.
Terms of Trade (ToT)
The terms of trade—the ratio of export prices to import prices—also affect currency value. An improvement in ToT means a country can purchase more imports for the same amount of exports, increasing demand for its currency. For instance, Australia’s dollar (AUD) tends to appreciate when global iron ore and coal prices rise, improving its ToT.
6. Trade Policies and Tariffs
Trade policies, tariffs, and trade agreements directly influence currency movements. When countries impose tariffs, restrict imports, or provide export subsidies, they alter trade flows and thereby currency demand.
Protectionist measures can strengthen domestic currency temporarily if they reduce imports, but over time they may harm competitiveness and productivity, leading to depreciation.
Free trade agreements (FTAs) can stimulate exports and foreign investment, strengthening the domestic currency.
For example, the signing of the North American Free Trade Agreement (NAFTA) increased trade between the U.S., Canada, and Mexico, supporting the Mexican peso and Canadian dollar through higher trade inflows.
7. Geopolitical Events and Global Supply Chains
Geopolitical tensions—wars, sanctions, or trade conflicts—often disrupt global trade flows and cause currency volatility. Trade sanctions can restrict export markets, reduce foreign currency inflows, and weaken affected nations’ currencies.
The Russia-Ukraine conflict (2022–) provides a striking example. Western sanctions reduced Russian exports to Europe, weakening the ruble temporarily, though capital controls later stabilized it. Meanwhile, European currencies like the euro were pressured by surging energy import costs.
The COVID-19 pandemic also exposed the fragility of global supply chains. Trade disruptions caused sharp fluctuations in currencies, particularly in emerging markets dependent on exports of manufactured goods or commodities.
8. The Role of Trade Deficits and Surpluses in Global Imbalances
Persistent trade surpluses and deficits create global financial imbalances that can drive long-term currency misalignments. Countries like China, Germany, and Japan often run large surpluses, accumulating foreign reserves and exporting capital. The U.S., on the other hand, runs chronic deficits financed by foreign investment in U.S. assets.
These imbalances influence global currency trends:
Surplus countries accumulate foreign exchange reserves, often investing them in U.S. Treasury bonds, which supports the dollar.
Deficit countries face currency depreciation risks if investor confidence wanes.
Efforts to rebalance global trade, such as by encouraging domestic consumption in surplus countries or reducing dependence on imports in deficit nations, are central to achieving currency equilibrium.
9. Central Bank Intervention and Trade Dynamics
Central banks often intervene in currency markets to stabilize exchange rates and protect trade competitiveness. For example:
The People’s Bank of China (PBoC) actively manages the yuan to maintain export competitiveness.
The Swiss National Bank (SNB) has intervened to prevent excessive appreciation of the Swiss franc, which could hurt exports.
The Bank of Japan (BoJ) frequently monitors the yen’s strength, as a strong yen can undermine Japan’s export-led economy.
Such interventions can take the form of buying/selling foreign currency reserves, adjusting interest rates, or implementing capital controls.
However, excessive intervention can attract criticism of “currency manipulation,” as seen in U.S.-China trade tensions during the 2010s.
10. The Dollar’s Dominance and Global Trade
The U.S. dollar’s dominance in international trade settlements has a unique impact on global currency dynamics. Most commodities, including oil and gold, are priced in dollars, creating constant global demand for USD regardless of America’s trade balance.
This “exorbitant privilege” allows the U.S. to run persistent deficits while maintaining a strong currency. However, as more nations explore de-dollarization—conducting trade in local or regional currencies—the long-term structure of global currency demand could shift.
Emerging blocs like BRICS are actively exploring alternatives to the dollar, which, if realized, could lead to a more multipolar currency system and alter global trade-currency relationships.
11. Technological and Structural Shifts in Trade
Technological advancements, such as digital trade, automation, and supply chain diversification, also influence currency trends. For instance:
Digital trade platforms reduce transaction costs, increasing global capital mobility and influencing forex markets.
Reshoring and nearshoring production—seen after COVID-19—alter traditional trade balances, thereby impacting currencies.
E-commerce exports by small and medium enterprises are increasing foreign exchange inflows in emerging economies.
Moreover, innovations like blockchain and central bank digital currencies (CBDCs) could reshape how global trade is settled, potentially reducing dependence on traditional reserve currencies and changing how trade flows affect exchange rates.
12. Long-Term Implications of Trade-Driven Currency Shifts
Global trade’s influence on currency shifts extends far beyond financial markets—it affects inflation, employment, investment, and overall economic stability.
Currency Appreciation: Makes imports cheaper, reducing inflation but potentially harming export competitiveness.
Currency Depreciation: Boosts exports but raises import costs, potentially fueling inflation.
Volatility: Frequent currency fluctuations can complicate long-term business planning, investment decisions, and government policy-making.
Therefore, nations strive for a balanced trade and exchange rate policy—neither excessive appreciation nor chronic depreciation—to maintain competitiveness and price stability.
Conclusion
Global trade remains one of the most powerful forces shaping currency values. Trade balances, commodity cycles, capital flows, and geopolitical developments all contribute to how currencies move in global markets. A country’s ability to manage these forces—through prudent macroeconomic policies, diversified trade relationships, and stable political governance—determines its currency’s resilience.
As globalization evolves and new trade patterns emerge, currency dynamics will continue to adapt. The rise of regional trade blocs, digital currencies, and de-dollarization movements may gradually reshape how global trade impacts currencies in the 21st century. Yet, the fundamental principle remains unchanged: trade is the lifeblood of currency demand, and currency shifts are the mirror reflection of a nation’s position in the global economic system.
Forex Options TradingIntroduction
Forex options trading is one of the most sophisticated and flexible instruments available in the global foreign exchange (FX) market. It allows traders and institutions to hedge currency exposure, speculate on exchange rate movements, and diversify portfolio risk. Unlike the traditional spot forex market—where currencies are directly exchanged—forex options provide the right but not the obligation to buy or sell a currency pair at a predetermined rate before a specific date.
Forex options trading has gained immense popularity among institutional traders, hedge funds, and advanced retail investors due to its ability to manage risk, amplify returns, and create structured payoff profiles. Understanding how forex options work, their mechanics, strategies, and advantages is crucial to navigate this dynamic part of the financial landscape.
What Are Forex Options?
A forex option (FX option) is a derivative contract that gives its holder the right—but not the obligation—to exchange one currency for another at a fixed exchange rate (called the strike price) on or before a specified date (expiration date).
There are two primary types of options:
Call Option – Gives the trader the right to buy a currency pair at the strike price.
Put Option – Gives the trader the right to sell a currency pair at the strike price.
The buyer of the option pays a premium to the seller (writer) for this right. If the market moves in favor of the holder, the option can be exercised for a profit; if not, the holder can let it expire, losing only the premium paid.
How Forex Options Differ from Spot Forex
In spot forex trading, two currencies are exchanged at the current market price, with profit or loss depending on the movement of the exchange rate. The exposure is direct and continuous.
In forex options trading, however:
Traders are not required to take delivery of the currency.
The potential loss is limited to the option premium.
It offers more flexibility through combinations and strategies.
For example, a trader expecting the EUR/USD to rise may buy a call option instead of buying EUR/USD directly. If the market moves upward, the option gains value; if it falls, the trader’s maximum loss is limited to the premium.
Key Terms in Forex Options Trading
Strike Price: The exchange rate at which the currency pair can be bought or sold.
Expiration Date: The date when the option contract expires.
Premium: The cost paid to purchase the option.
In the Money (ITM): When exercising the option results in profit.
Out of the Money (OTM): When exercising the option would result in a loss.
At the Money (ATM): When the spot rate equals the strike price.
Notional Value: The total value of the underlying currency represented by the option.
Types of Forex Options
1. Vanilla Options
These are the standard call and put options. They have fixed strike prices, expiration dates, and predictable payoff structures. Most retail forex brokers offer these types of options.
Example: A trader buys a EUR/USD call option at 1.1000 expiring in 30 days. If EUR/USD rises to 1.1200 before expiration, the trader profits from the difference minus the premium.
2. Exotic Options
These are more complex instruments that have unique payoff structures and are primarily traded over the counter (OTC) by institutional participants.
Types include:
Barrier Options: Activated or deactivated when the currency hits a certain price level.
Digital (Binary) Options: Pay a fixed amount if the currency closes above/below the strike price.
Asian Options: Payoffs depend on the average exchange rate over a period.
Lookback Options: Payoff depends on the best or worst exchange rate during the life of the option.
Exotic options are useful for customized hedging and speculative strategies.
How Forex Options Work
Forex options operate through an agreement between two parties — the buyer (holder) and seller (writer). The process includes:
Selection of Currency Pair: For instance, EUR/USD or USD/JPY.
Choosing the Type: Call (buy) or Put (sell) option.
Setting Strike Price and Expiration: Determines at what level and for how long the option is valid.
Paying the Premium: The buyer pays an upfront cost to the seller.
Monitoring Market Movement: If the spot rate moves favorably, the option’s value increases.
Expiration or Exercise: The trader either exercises the option or lets it expire.
Example:
A trader buys a 1-month EUR/USD call option at 1.1000 for a premium of $200.
If the spot rate rises to 1.1200, the option is worth 200 pips, giving a profit (minus premium).
If EUR/USD falls below 1.1000, the option expires worthless, and the trader loses only $200.
Determinants of Option Premium
The price (premium) of an option depends on multiple factors:
Spot Price: Current exchange rate of the currency pair.
Strike Price: Difference between strike and spot influences value.
Time to Expiration: More time means higher premium (greater potential movement).
Volatility: Higher volatility increases option value since larger price swings raise potential profits.
Interest Rate Differential: The difference between the interest rates of the two currencies affects pricing.
Market Sentiment: Supply and demand dynamics influence option premiums.
These factors are mathematically modeled using the Garman-Kohlhagen model, an adaptation of the Black-Scholes model for forex options.
Advantages of Forex Options Trading
Limited Risk: Loss is limited to the premium, unlike spot forex where margin calls can occur.
Leverage and Flexibility: High potential returns with smaller capital outlay.
Hedging Tool: Protects against unfavorable currency moves for international investors or businesses.
Profit in Any Market Condition: Traders can profit in bullish, bearish, or neutral markets through strategic combinations.
No Margin Calls: Since the premium is paid upfront, traders are not exposed to margin requirements.
Diversification: Adds a non-linear component to portfolios, balancing risk.
Risks Involved
Premium Cost: Options can be expensive during volatile periods.
Time Decay (Theta): Option value decreases as expiration approaches.
Complexity: Advanced understanding is required to structure profitable trades.
Low Liquidity: Some exotic options or minor pairs may have limited buyers/sellers.
Over-the-Counter (OTC) Risks: Lack of regulation or standardization in OTC markets increases counterparty risk.
Forex Options Trading Strategies
1. Long Call
Objective: Profit from a rise in the currency pair.
Risk: Limited to premium.
Reward: Unlimited upside potential.
2. Long Put
Objective: Profit from a decline in the currency pair.
Risk: Premium only.
Reward: Significant if price drops below strike.
3. Straddle
Buy both a call and a put with the same strike and expiry.
Profits from large volatility in either direction.
4. Strangle
Buy OTM call and OTM put. Cheaper than straddle but needs larger movement.
5. Butterfly Spread
Combines multiple options to profit from low volatility conditions.
6. Protective Put (Hedging)
Used by exporters or importers to lock in currency rates and minimize loss.
For example, a U.S. company expecting payment in euros in three months might buy a EUR/USD put option to hedge against a euro depreciation.
Forex Options in Institutional Use
Large corporations and financial institutions use FX options for risk management and speculation:
Exporters and Importers hedge against unfavorable exchange rate movements.
Hedge Funds exploit volatility and market inefficiencies.
Banks use options to create structured products for clients.
Central Banks may use options for managing foreign reserves.
Institutions often trade exotic options, customized for their unique exposure, such as knock-in/knock-out options or dual-currency deposits.
Market Participants and Platforms
Forex options can be traded on:
Over-the-Counter (OTC) Markets: Customized contracts between banks, corporations, and institutional traders.
Exchange-Traded Platforms: Such as the Chicago Mercantile Exchange (CME) offering standardized options on currency futures.
Major participants include:
Commercial banks
Hedge funds
Corporations
Central banks
Retail traders (through brokers)
Regulations and Market Oversight
Forex options markets are regulated by national authorities to ensure transparency and prevent abuse:
U.S. – Commodity Futures Trading Commission (CFTC) and National Futures Association (NFA)
U.K. – Financial Conduct Authority (FCA)
Europe – European Securities and Markets Authority (ESMA)
India – Reserve Bank of India (RBI) and SEBI
Regulation ensures fair pricing, standardized reporting, and counterparty protection, especially in OTC contracts.
Example of a Real Trade
Suppose a trader expects the USD/JPY to appreciate from 150.00 to 152.00 within two weeks.
Strategy: Buy a USD/JPY call option at strike 150.00
Premium: 0.50 yen
Notional Amount: $100,000
If USD/JPY rises to 152.00, profit = (2.00 - 0.50) × $100,000 = $1,500.
If USD/JPY falls or stays flat, loss = premium paid = $500.
This flexibility illustrates how options protect traders from downside risk while maintaining upside exposure.
Future Trends in Forex Options Trading
Algorithmic and AI-Based Pricing Models: Improving precision in volatility forecasting and premium determination.
Retail Market Expansion: Brokers now offer simplified forex options to retail investors.
Blockchain and Tokenized Derivatives: Potentially increasing transparency and settlement efficiency.
Increased Regulation: Standardization of OTC markets to minimize systemic risk.
Integration with Decentralized Finance (DeFi): Smart contract-based forex options may revolutionize accessibility.
Conclusion
Forex options trading is a powerful instrument that combines elements of flexibility, risk management, and profit potential. By offering the right but not the obligation to execute trades, it enables both speculative and defensive positioning in the volatile global currency market. From multinational corporations hedging against currency risk to retail traders capitalizing on market volatility, forex options cater to a wide spectrum of participants.
However, success in forex options trading requires an understanding of market mechanics, volatility, and pricing dynamics. While the potential for gains is significant, improper use or lack of knowledge can lead to losses through expensive premiums or misjudged strategies.
Ultimately, forex options stand as a cornerstone of modern currency trading—providing unparalleled control over risk and reward in the global financial ecosystem.
Forex Reserves Impact on TradingIntroduction
Foreign exchange reserves, commonly known as forex reserves, are a nation’s holdings of foreign currencies and other reserve assets maintained by its central bank. These reserves play a crucial role in maintaining economic stability, influencing exchange rate movements, and shaping the trading environment for both domestic and international investors. In today’s globalized economy, the magnitude and management of a country’s forex reserves can directly impact trade dynamics, currency valuation, investor confidence, and overall market liquidity.
Forex reserves act as the financial backbone of a nation, providing a buffer against external shocks and ensuring smooth functioning of international trade. Their impact on trading—whether in goods, currencies, or capital markets—is profound and multifaceted. To understand their true significance, one must analyze the composition, functions, and strategic management of forex reserves, and how they shape economic policy and market behavior.
1. Understanding Forex Reserves
Definition:
Forex reserves are assets held by a central bank in foreign currencies, used primarily to back liabilities and influence monetary policy. These reserves usually comprise foreign banknotes, deposits, bonds, treasury bills, gold, and the International Monetary Fund’s (IMF) Special Drawing Rights (SDRs).
Composition of Forex Reserves:
Foreign Currency Assets (FCA): The largest component, often held in USD, EUR, GBP, or JPY.
Gold Reserves: Serve as a hedge against currency depreciation and inflation.
SDRs (Special Drawing Rights): International reserve assets allocated by the IMF.
Reserve Tranche Position (RTP): The portion of a country’s quota in the IMF that it can access without conditions.
For instance, as of 2025, countries like China, India, Japan, and Switzerland hold significant forex reserves, influencing not just their domestic trade stability but also global market trends.
2. Objectives of Maintaining Forex Reserves
Central banks hold forex reserves for several key reasons:
Stabilizing the Currency:
Reserves are used to control excessive volatility in the exchange rate by buying or selling foreign currency in the market.
Meeting Balance of Payments (BoP) Needs:
Reserves ensure that a country can meet its international payment obligations without disrupting trade flows.
Boosting Investor Confidence:
Large reserves signal a country’s ability to handle economic shocks, thereby attracting foreign investment.
Supporting Imports:
Forex reserves cover essential imports like oil, food, and machinery during crises or capital outflows.
Debt Servicing:
Countries use reserves to repay foreign loans and interest, ensuring sovereign creditworthiness.
Crisis Management:
During times of financial or geopolitical stress, reserves act as an insurance mechanism, maintaining trade stability.
3. Link Between Forex Reserves and Trade
Forex reserves influence trade in several direct and indirect ways:
a. Exchange Rate Stability
One of the most immediate impacts of forex reserves on trading is their role in stabilizing the exchange rate. A stable currency enhances export competitiveness and ensures predictability for importers and exporters.
High reserves give the central bank the power to defend its currency against speculative attacks, preventing rapid depreciation.
Low reserves may lead to currency volatility, increasing uncertainty for international traders.
For example, during the 2013 “taper tantrum,” India’s forex reserves helped the Reserve Bank of India (RBI) manage the rupee’s fall against the U.S. dollar, ensuring smoother trade operations.
b. Trade Competitiveness
A country with adequate reserves can maintain favorable exchange rate conditions to support its exporters. By managing currency appreciation, the central bank can ensure that domestic products remain competitive in global markets.
Conversely, countries with low reserves may face currency depreciation, increasing the cost of imports and disrupting supply chains.
c. Import Cover and Payment Security
Forex reserves determine a nation’s ability to pay for imports during economic downturns. The term “import cover” measures how many months of imports can be covered by reserves.
A healthy import cover (usually 8–10 months) ensures uninterrupted trade even during crises. This is especially critical for countries heavily dependent on imported energy or raw materials.
d. Trade Financing and Confidence
Strong reserves improve a country’s creditworthiness, enabling banks and businesses to obtain cheaper foreign financing. This lowers trade financing costs and promotes export-oriented growth.
4. Impact on the Currency and Forex Market
Forex reserves play a dominant role in shaping currency trading and speculation in the forex market.
a. Currency Appreciation or Depreciation
When a country’s central bank sells foreign currency from its reserves to buy domestic currency, it creates upward pressure on the local currency (appreciation).
When it buys foreign currency, it increases supply of local currency, leading to depreciation.
Such interventions are critical in managing the value of the currency to align with trade objectives.
b. Speculative Trading and Market Sentiment
Traders closely monitor changes in forex reserves as an indicator of future policy action.
Increasing reserves often signal capital inflows and strong fundamentals, boosting investor sentiment.
Falling reserves may indicate possible currency weakness or economic stress, leading to speculative short positions in the currency.
Thus, forex reserves indirectly shape forex trading patterns, risk perceptions, and hedging strategies among institutional traders.
c. Volatility Management
High reserves allow a central bank to intervene effectively during extreme volatility in the currency market.
This reassures investors and businesses that the country can maintain market order—reducing panic trading or speculative attacks on the domestic currency.
5. Influence on Domestic and Global Trade Dynamics
a. Domestic Trade and Investment
Forex reserves affect domestic interest rates, inflation, and liquidity—all of which influence local trading conditions. For instance, when central banks accumulate reserves by buying foreign currency, they inject domestic liquidity, which can lower interest rates and stimulate investment.
However, excessive liquidity may cause inflation or asset bubbles if not managed carefully.
b. Global Trade Relationships
Countries with large reserves often gain stronger negotiating positions in global trade forums. They can offer trade credits, fund bilateral projects, or extend currency swap lines, enhancing their influence in international trade relations.
For example, China’s massive forex reserves have allowed it to promote the yuan in global transactions and fund infrastructure projects under the Belt and Road Initiative, indirectly shaping global trade flows.
6. Forex Reserves and Stock Market Trading
The level and trend of forex reserves also affect stock market trading in several ways:
Investor Confidence:
Rising reserves reflect macroeconomic stability, attracting foreign portfolio investment (FPI) into equity markets.
Currency Risk Mitigation:
Stable reserves mean lower currency risk, encouraging foreign investors to hold domestic assets.
Liquidity Flows:
Central bank actions to accumulate or utilize reserves can influence domestic liquidity, impacting stock valuations and trading volumes.
Market Correlation:
Historically, stock market indices in emerging economies like India and Brazil show positive correlation with rising forex reserves, as both signify strong capital inflows and growth prospects.
7. Case Studies
a. China
China holds the world’s largest forex reserves—over $3 trillion—primarily to maintain yuan stability and support export competitiveness. Its large reserves have allowed the People’s Bank of China (PBoC) to manage exchange rates tightly, ensuring predictable trade conditions and global supply chain dominance.
b. India
India’s forex reserves surpassed $650 billion in 2024, providing an import cover of over 10 months. This robust buffer has shielded the Indian rupee from global shocks, such as oil price volatility or geopolitical tensions, supporting steady trade growth and stable investor sentiment.
c. Russia
In 2022, Russia’s large reserves helped it initially resist Western sanctions, but the freezing of reserves held abroad revealed the geopolitical vulnerability of such assets. It underscored the importance of diversification and gold holdings within reserve management.
8. Risks and Challenges in Managing Forex Reserves
While high reserves offer stability, they also come with certain challenges:
Opportunity Cost:
Investing in low-yield foreign assets like U.S. Treasuries offers limited returns compared to potential domestic investments.
Exchange Rate Risk:
Changes in the value of reserve currencies (like the dollar or euro) can cause valuation losses.
Sterilization Costs:
To neutralize inflationary effects of reserve accumulation, central banks often conduct sterilization operations, which can be costly.
Geopolitical Risks:
Holding reserves in foreign countries exposes them to political or sanction risks, as seen in recent global conflicts.
Liquidity vs. Return Trade-off:
Central banks must balance between maintaining highly liquid assets and earning sufficient returns from their reserves.
9. The Future of Forex Reserves and Global Trading
In the evolving digital and geopolitical landscape, the nature and impact of forex reserves are changing rapidly:
Shift Toward Diversification:
Central banks are diversifying away from the U.S. dollar toward the euro, yen, and gold to reduce dependency risks.
Role of Digital Currencies:
The rise of Central Bank Digital Currencies (CBDCs) may alter how countries manage and deploy reserves in cross-border transactions.
Strategic Reserves for Energy and Technology:
Beyond currencies and gold, some nations are considering “strategic reserves” of essential commodities and technologies to ensure trade resilience.
Climate and ESG Considerations:
Reserves may increasingly be managed with environmental, social, and governance (ESG) principles in mind, influencing sustainable investment flows.
Conclusion
Forex reserves serve as the cornerstone of a nation’s economic and financial stability. Their role in influencing trade—both directly through currency stability and indirectly through investor confidence—is undeniable. Adequate reserves not only enable smooth import-export operations but also protect the economy from external shocks, currency crises, and global volatility.
For traders and investors, forex reserves act as a barometer of macroeconomic health. A rising reserve position signals strength, stability, and confidence, while a falling one warns of potential risks in the trade and capital markets.
In a globalized trading environment where currency values, capital flows, and policy decisions are deeply interconnected, the management of forex reserves remains a central pillar of economic strategy. Ultimately, the efficient accumulation, diversification, and utilization of these reserves determine a nation’s ability to sustain trade growth, maintain currency credibility, and foster long-term economic prosperity.

Trading Strategies and Index InvestmentsIntroduction
In the modern financial world, investors and traders have access to a wide array of instruments and strategies designed to achieve specific goals — from short-term profit to long-term wealth creation. Two fundamental pillars of market participation are trading strategies and index investments. While trading strategies focus on short-term price movements to generate returns, index investing emphasizes passive, long-term exposure to market performance. Understanding both approaches helps investors diversify their portfolios, manage risk, and align financial decisions with market dynamics.
1. Understanding Trading Strategies
Trading strategies are systematic methods used to determine when to buy or sell securities such as stocks, commodities, forex, or indices. These strategies are based on technical analysis, fundamental analysis, quantitative models, or a combination of these. The goal is to maximize profit while minimizing risk.
1.1 Types of Trading Strategies
a) Day Trading
Day trading involves buying and selling financial instruments within the same trading day. Traders aim to capitalize on small price fluctuations using leverage and high liquidity. It requires constant monitoring of markets, technical charts, and news.
Key tools: Moving averages, RSI (Relative Strength Index), MACD, candlestick patterns.
Example: A trader buys Nifty 50 futures at 22,000 and sells at 22,050 within the day, making profit from intraday volatility.
b) Swing Trading
Swing trading focuses on capturing medium-term price movements lasting from a few days to several weeks. Traders rely on trend analysis and chart patterns to identify potential reversals or continuations.
Example: Buying Reliance Industries stock after a bullish breakout and holding it for two weeks until the trend peaks.
c) Position Trading
Position traders hold assets for weeks or months, relying heavily on macroeconomic trends and company fundamentals rather than daily price swings.
Example: Holding gold futures during a geopolitical crisis anticipating long-term price appreciation.
d) Scalping
Scalping is an ultra-short-term trading strategy where traders make dozens or even hundreds of trades daily, seeking tiny profits per trade.
Example: Buying and selling Bank Nifty options multiple times a day to exploit minute market inefficiencies.
e) Algorithmic and Quantitative Trading
Algorithmic trading uses automated systems and mathematical models to execute trades based on predefined rules. It eliminates human emotion and allows high-frequency transactions.
Example: A quantitative model buys stocks when the 50-day moving average crosses above the 200-day moving average (Golden Cross).
1.2 Technical vs. Fundamental Strategies
Technical Trading
This approach relies on chart patterns, price action, and market indicators. Technical traders assume that all information is already reflected in the price and focus on market psychology and trends.
Popular tools: Fibonacci retracements, Bollinger Bands, trendlines, and support/resistance zones.
Fundamental Trading
Fundamental traders base their decisions on economic data, company earnings, interest rates, and macroeconomic events. They focus on intrinsic value rather than short-term volatility.
Example: Buying undervalued stocks based on P/E ratio, dividend yield, or balance sheet strength.
1.3 Risk Management in Trading
Risk management is the cornerstone of successful trading. Without disciplined control, even the best strategy can fail.
Position Sizing: Limiting exposure per trade (usually 1–2% of capital).
Stop-Loss Orders: Automatically exiting trades when losses reach a certain threshold.
Diversification: Trading across multiple instruments or sectors to reduce correlation risk.
Risk-Reward Ratio: Maintaining a ratio of at least 1:2 ensures that potential profits exceed potential losses.
Psychological Control: Avoiding emotional decisions like revenge trading or over-leveraging.
1.4 Modern Trading Approaches
High-Frequency Trading (HFT)
HFT uses algorithms and ultra-fast computing to exploit microsecond-level inefficiencies in markets. It is popular among institutional players rather than retail investors.
Momentum Trading
This strategy involves buying securities showing upward momentum and selling those losing strength.
Example: Buying Tesla shares after a strong breakout due to earnings surprise.
Contrarian Trading
Contrarians go against the market sentiment — buying when others are fearful and selling when others are greedy.
News-Based Trading
Market prices react quickly to economic announcements, corporate earnings, and geopolitical news. Traders use economic calendars and news scanners to exploit volatility.
2. Index Investments: The Passive Approach
While trading strategies focus on active management and short-term profit, index investing represents the opposite — a long-term, passive, and cost-efficient strategy. Index investments track a specific market index, such as the S&P 500 (USA), Nifty 50 (India), or FTSE 100 (UK).
2.1 What is an Index?
An index is a statistical measure representing the performance of a basket of securities. It reflects the overall health of a market or sector.
Examples:
S&P 500 – Tracks 500 large-cap U.S. companies.
Nifty 50 – Represents 50 leading Indian companies.
Dow Jones Industrial Average (DJIA) – Tracks 30 U.S. blue-chip companies.
2.2 Index Funds and ETFs
Index Funds
Index mutual funds invest in all the components of a specific index, aiming to replicate its returns. They have low management costs since they don’t require active decision-making.
Exchange-Traded Funds (ETFs)
ETFs also track indices but trade like stocks on exchanges. Investors can buy and sell ETF units throughout the day.
Example: Nifty BeES (Nippon India ETF Nifty BeES) mirrors the Nifty 50 index.
Advantages of ETFs and Index Funds:
Low fees and expense ratios.
High transparency (holdings are publicly known).
Diversification across sectors and companies.
Suitable for long-term investors seeking steady growth.
2.3 Benefits of Index Investing
Diversification – Investing in an index spreads risk across multiple companies and industries.
Low Cost – Minimal management fees compared to actively managed funds.
Consistent Returns – Historically, major indices outperform most active traders over the long term.
Simplicity – No need for constant analysis or market timing.
Compounding Growth – Reinvested dividends and long-term market appreciation enhance total returns.
2.4 Index Investing Strategies
a) Buy-and-Hold Strategy
Investors purchase an index fund and hold it for several years, ignoring short-term volatility. This strategy relies on the long-term growth of markets.
b) Dollar-Cost Averaging (DCA)
Investing a fixed amount periodically (monthly or quarterly) regardless of price helps reduce the impact of market timing.
c) Sector Index Investing
Instead of broad indices, investors can choose sectoral indices (e.g., Nifty IT, Nifty Bank) to capitalize on specific industry growth.
d) Thematic Index Investing
Focuses on emerging themes like green energy, artificial intelligence, or ESG (Environmental, Social, Governance) factors.
e) Smart Beta Investing
Combines passive and active investing by weighting stocks in an index based on factors such as value, momentum, or volatility rather than market capitalization.
2.5 Risks in Index Investing
Even though index investing is relatively safer, it is not risk-free:
Market Risk – When the entire market declines, index funds also lose value.
Tracking Error – Slight deviation between the index and fund performance.
Sector Concentration – Some indices may be heavily weighted in certain sectors (e.g., tech in NASDAQ).
Inflation Risk – Returns may not always outpace inflation during stagnant periods.
3. Trading vs. Index Investing: A Comparative Overview
Aspect Trading Strategies Index Investments
Objective Short-term profit Long-term wealth creation
Time Horizon Minutes to weeks Years to decades
Approach Active management Passive management
Risk Level High (depends on leverage) Moderate
Skill Requirement High (technical & analytical) Low to medium
Costs Brokerage, slippage, taxes Low management fees
Emotion Factor High — psychological discipline needed Low — less frequent decisions
Return Pattern Variable, can be volatile Steady, tracks market average
Tools Used Charts, indicators, news Index funds, ETFs
4. Integrating Both Approaches
A balanced investor can combine trading and index investing to benefit from both short-term opportunities and long-term stability.
4.1 Core-Satellite Strategy
Core: 70–80% of portfolio in index funds for stable, market-linked growth.
Satellite: 20–30% allocated to active trading or thematic opportunities for higher alpha.
4.2 Hedging with Index Derivatives
Traders can use index futures and options to hedge portfolios during volatile times.
Example: An investor holding Nifty 50 index funds can short Nifty futures to protect against downside risk.
4.3 Periodic Rebalancing
Regularly reviewing and adjusting portfolio allocations ensures alignment with risk tolerance and market conditions.
5. Global and Indian Market Context
5.1 Global Perspective
In the U.S., index investing has surged in popularity due to consistent outperforming results. The S&P 500 index funds like Vanguard 500 (VFIAX) or SPDR S&P 500 ETF (SPY) have become cornerstones of retirement portfolios.
Algorithmic trading, on the other hand, dominates global markets, with over 70% of equity trades in developed markets being automated.
5.2 Indian Context
In India, index funds and ETFs have seen exponential growth, with retail investors embracing passive investing due to SEBI’s promotion of low-cost instruments. Popular indices include Nifty 50, Sensex, and Nifty Next 50.
Simultaneously, trading culture has expanded, driven by easy digital access, discount brokers, and rising financial literacy.
6. Future Trends
AI-Driven Trading – Artificial intelligence and machine learning are revolutionizing trading strategy optimization.
Smart Beta Indexes – Blending active and passive principles for better returns.
Sustainable Investing – ESG indices gaining global traction.
Fractional ETFs and Global Index Exposure – Enabling small investors to own portions of global markets.
Increased Retail Participation – Technology platforms making markets accessible to millions of small investors.
Conclusion
Trading strategies and index investments represent two contrasting yet complementary philosophies of market participation. Traders thrive on volatility, precision, and short-term opportunities, while index investors rely on patience, discipline, and compounding over time. The real strength lies in understanding one’s goals, risk appetite, and market behavior to strike the right balance.
In an era of algorithmic systems, digital platforms, and globalized finance, both trading and index investing will continue to evolve. For sustained financial success, investors must integrate knowledge, adaptability, and discipline — using active trading to seize opportunities and index investing to build enduring wealth.