understanding harmonic 5-0 patterns What is the 5-0 harmonic pattern?
Just as it is with the shark pattern, the 5-0 harmonic pattern is a relatively new pattern. Carney discovered it and wrote about this pattern in the second book in his harmonic series, ‘Harmonic Trading: Volume Two’.
The 5-0 pattern is easily one of the wonkiest looking patterns. Depending on the amount of knowledge you have about harmonic patterns, the 5-0 will look different, and this is mainly because the 5-0 pattern begins a 0. If you are familiar with seeing XABCD, then 0XABCD will undoubtedly look different.
The patterns are relatively new but are getting more popular lately. It stands out from the other harmonic patterns because it is meant to begin a new trend rather than discover retracement. There are two types of this pattern, bullish and bearish.
The convergence zones discovered with the help of the shark pattern makes it possible for us to accurately detect the rebound but doesn’t necessarily lead to the restoration of the previous trend. On the other hand, regular rollbacks aim to determine the ability of the forces dominant on the market in the previous period (bears or bulls) to get the initiative back to their disposal. If they are not sufficient, the last reversal of the previous trend occurs, but already within another pattern – 5-0 harmonic pattern.
How to identify the 5-0 pattern?
The 5-0 pattern begins with either an uptrend or a downtrend which gets exhausted and draws zigzag like corrective movements. The qualities of the 5-0 pattern to look at include:
AB movement has to be 1.13 to 1.618 retracement of XA.
BC movement has to be 1.618 to 2.24 retracement of an AB.
CD movement ought to be 0.5 retracements of BC
C should be between 0.886 and 1.13 of 0X movement
If the conditions are satisfied, we can trade the last leg of CD. They entering at C with a stop below 2.24 of AB retracement and aiming at 50 percent correction of BC movement.
The 5-0 harmonic pattern is traded when the price is getting to point D. The stop-loss is positioned a few points below/above the farthest possible D level. Unlike a lot of the other patterns, 5-0 doesn’t have specific targets because it usually begins a new trend. Here the pattern fib ratios don’t matter much. Entries might be done with a limit order or on price reversals away from point D. All entries have to be confirmed for risk/reward ratio. Entries having less risk/reward have to be taken cautiously or discarded altogether.
In our example, current stock AUBANK has shown a classic 0xabcd pattern or in other words 5-0 harmonic pattern. It is a bearish 5-0 pattern where most of the XABCD pattern swing traders would have forced either to become a long term investor or book a loss who have not booked at
.50 retracement as everything has happened too fast to react on.
As technology is developing everyday , so as the traps are becoming too much knotty to decode and survive as a swing trader, for a swing trader"s job is to find swings every time and dive with the trend and this type of complex patterns ends up his/her dream as a bad bad nightmare.
So, this effort by me is especially for the swing traders who are welcomed to enlighten more on this topic and to go updated as this pattern is said to be new.
Harmonic Patterns

Bullish Shark Within Bullish ChannelFrom this chart, can be found that Bullish Shark Within Bullish Channel.
This one of example for Bullish Retracement Patterns within Bullish Trend Channels shown in Harmonic Trading: Volume Two, Page 124 until Page 126 written by Scott M Carney.
Bullish Harmonic Pattern in Bullish Channel or Ascending Channel may indicate continuation pattern in Channel or rather as confirmation to show that price will go up.
To simplify, M pattern within Ascending Channel indicates that price will go up in continuation.
Noted that Shark is Harmonic Pattern that use Reciprocal AB=CD.
You may refer Link to Related Ideas for more information.
Thank you.

Education excerpt: Relative Strength IndexEducation excerpt: Relative Strength Index
General information
The Relative Strength Index ( RSI ) is a momentum oscillator that was introduced by J. Welles Wilder in an article published in Commodities magazine in June 1978. The Relative Strength Index measures the velocity of directional price movement and is commonly used in conjunction with a daily bar chart. However, it can be utilized on a bar chart with any particular time frame. The concept of this oscillator is based upon an idea of an asset being oversold or overbought. Generally, tops and bottoms are indicated when the RSI goes above 70 or drops below 30. Although, failure swings above 70 or below 30 can imply possible market reversal. Similarly, divergence between the RSI and price action on the chart can signal a market turning point. Chart formations and support and resistance often show up graphically on the RSI despite the fact that they may not be apparent on the bar chart. The slope of the momentum oscillator is directly proportional to the velocity of the move. Thus, the distance traveled up or down by the RSI is proportional to the magnitude of the move. The horizontal axis represents time and the vertical axis represents distance traveled by the indicator. The RSI moves slowly when the market continues its directional movement . However, once price is at the market turning point, RSI tends to move faster.
Calculation
The Relative Strength Index is commonly calculated using the close price of a 14 day period. The equation for its calculation involves several components.
These are:
• Average up closes
• Average down closes
• Relative strength
Relative Strength ( RS ) = (average of 14 day's closes up/average of 14 day's closes down)
Relative Strength Index ( RSI ) = 100 –
Calculation begins with obtaining the sum of the up closes for the previous 14 days. This sum is then divided by the number of days used in calculating the generating figure for average up closes. Similarly, the sum of the down closes for the previous 14 days is divided by the number of days used in calculating the generating figure for average down closes. After these two operations are conducted, the average up days are divided by the average down days resulting in the value of the Relative Strength ( RS ). The number 1 is then added to the value of RS . Next, 100 is divided by the new amount of RS . The resulting figure is subsequently subtracted by 100 generating the value of the Relative Strength Index ( RSI ). From this step on, the previous value of average up closes and average down closes can be used to generate the next value of the RSI . In order to calculate the next average up close, the previous value of average up closes is multiplied by 13 and the present day average up close is added to this figure. This value is then divided by 14 generating the value for the new average up closes. In similar fashion, the new average down close is calculated by multiplying the previous average down closes by 13. Today's down close is then added to the figure. The resulting figure is again divided by 14 to generate the new average down close. After that, the same steps indicated to calculate the initial RSI need to be followed.
Divergence
When trend is prevalent and two indexes (or index and price) are going simultaneously either up or down they exhibit positive correlation. However, when this correlation breaks and one index (or price) keeps going up while another index reverses down divergence is said to occur. Technical analyst should pay attention to this instance as it sometimes has abillity to foreshadow upcoming reversal in trend. Though, there are many instances when divergence occurs and reversal in price trend fails to materialize. For this reason some analysts like to implement concept of double divergence.
Double divergence
There are many instances when price continues its rise and analyst can observe oscillator or idex to fall only to see it later climb back up in tandem with price. (same applies to the opposite situation when price falls and index or oscillator starts to rise) The divergence occured but price trend remained intact. Because the divergence can be misleading, some analysts preffer to wait for the second divergence before placing their entries or exits.
Disclaimer: This content serves only educational purpose.

Weak BullsBulls lost pressure. To many Buyers in wait but it could be another day for any signs of champion

The Head & Shoulders Pattern Tutorial (Basic) #BitcoinThe Head and Shoulders pattern is one of the oldest recognised market structures. Representing a fully formed fractal when completed, the H&S confirms a short term reversal in trend.
Setting the levels 50%,100% and 200% on the Fib tool, I have devised a simple system of confirmation/action to take advantage (profit) from the completion of the Pattern.
1st confirmation occurs when price first breaks below a previous low. This establishes the Neckline (100%) a horizontal line drawn from the valley of the left shoulder.
2nd confirmation occurs when price retraces back above 50%, forming the right shoulder. Agressive traders enter short above 50% with a stop loss at 0%, this entry statistically is higher risk but also higher reward.
Final confirmation occurs once the right shoulder has formed, price continues down with a candle closing below the neckline (100%). Conservative traders set a Sell limit at the neckline (100%) with a stop loss at 50%.
Both aggressive and Conservative traders close at least half of their position when price breaks below 200%
Although I consider the H&S Structre completed once 200% is reached, the levels outlined in my system continue to effect price for days/weeks even months later.

XAG/USD EVERY SUNDAY LIVE ZOOM ANALYSISThe gold & silver market is pushing significantly higher, following a significant miss in the U.S. labor market with fewer jobs created in August.
Friday, the U.S. Labor Department said that 235,000 jobs were created last month. The data was weaker than expected as consensus forecasts called for jobs gains of 720,000.
While the headline data saw a significant miss, the Labor Department included substantial revisions to its June and July numbers. June's employment numbers were revised up by 24,000 to 962,000 from the previous estimate of 938,000. Meanwhile, July's data was revised up to 1.053 million jobs compared to the initial estimate of 943,000.
However, some economists note that the strong revisions are not enough to take the full sting out of the disappointing headline numbers.
Meanwhile, the U.S. unemployment rate dropped to 5.2%, down from July's reading of 5.4%. The unemployment rate fell in line with expectations.
The gold market has broken through critical near-term support levels in initial reaction to the weaker-than-expected employment data. December gold futures last traded at $1,827.10, up nearly 1% on the day.
Not only was job growth weaker last month, but positive for gold, wage inflation continues to creep higher. The report said that wages rose 0.6% in August, up from July's 0.4% increase. Economists were expecting to see a 0.3% increase.
A lot of focus had been placed on the August employment numbers. Many Federal Reserve officials noted that a strong number could prompt them to launch their plans to reduce their monthly bond purchases. However, some economists say the disappointing data could force the central bank to delay those plans.
"This disappointing report will make it a closer call than we expected for a September tapering announcement from the Fed," said Katherine Judge, senior economist at CIBC.
Paul Ashworth, chief U.S. economist at Capital Economics, said that the latest employment numbers puts the Federal Reserve in a very difficult position. He noted that the economic data shows the COVID-19 pandemic and the spreading Delta Variant is impacting the current recovery.
“Even allowing for the fact that first estimates for August often disappoint on the downside, the extent of the slowdown in jobs growth all-but rules out any tapering announcement at this month's FOMC meeting and, if this weakness persists, then it could be pushed into early next year.
XAG/USD EVERY SUNDAY LIVE ZOOM ANALYSIS UK 18:00

XAU/USD - CHART ANALYSIS - NFP ! The gold market still has a path to $2,000 in the second half of the year as the precious metal is undervalued in a world awash with liquidity, according to the latest research from Bloomberg Intelligence (BI).
In a report published Wednesday, Mike McGlone, senior commodity strategist at BI, said that within the metals complex, gold appears to have the most potential when compared to other assets like copper and aluminum.
"Copper and aluminum are reaching upper range price caps, but we see gold as a discounted bull market with improving fundamental underpinnings," he said in the report. "The copper-to-gold ratio has reached the highest level in about seven years and a rare disparity vs. declining U.S. Treasury bond yields, which we expect will be resolved by a resumption of the precious metal outperforming the industrial.
Looking at aluminum, McGlone said that tightening supply and demand fundamentals are helping to push prices to $3,000 per tonne; however, similar to copper's run to $10,000, he added that aluminum’s rally appears to be unstable. He said that the industrial metal complex faces some challenging near-term hurdles.
"Supply elasticity is proving strong for copper, indicating headwinds for the industrial-metal sector, but ESG, electrification and decarbonization trends should maintain the group's upper hand vs. most other commodities, with the exception of precious metals," he said. "Among the most supply-constrained commodities, gold and silver have the relative advantage heading toward the end of 2021 of having experienced sharp corrections within more enduring bull markets, as we see it."
While there is plenty of bullish sentiment surging through precious metals markets, gold prices continue to struggle to find consistent momentum. The precious metal is holding support above $1,800 an ounce, but it has been unable to push above $1,820 an ounce. December gold futures last traded at $1,810.80 an ounce, down 0.29% on the day.

History of ForexHistory of Forex
We have come a long way from the previously practiced barter system to the modern-day system of trading currency. Following is a brief summary of the evolution of currency and how it gave rise to Forex Trading.
Here are the main stages that are illustrated on the chart:
1️⃣The Ancient system of Trading - Trading with Gold
As early as 6th century BC , the first gold coins were produced, and they acted as a currency because they had critical characteristics like portability, durability, divisibility, uniformity, limited supply and acceptability.
2️⃣Bank Notes Originated - Deposited Gold in banks in exchange for banknotes
3️⃣Role of Geography - Various banks of different regions printed different currencies
Gold Standard - Currency pegged to gold
In the 1800s countries adopted the gold standard. The gold standard guaranteed that the government would redeem any amount of paper money for its value in gold . This worked fine until World War I where European countries had to suspend the gold standard to print more money to pay for the war.
4️⃣Bretton Woods System - Currency pegged to USD
The first major transformation of the foreign exchange market, the Bretton Woods System, occurred toward the end of World War II.
The Bretton Woods Accord was established to create a stable environment by which global economies could restore themselves. It attempted this by creating an adjustable pegged foreign exchange market. An adjustable pegged exchange rate is an exchange rate policy whereby a currency is fixed to another currency. In this case, foreign countries would 'fix' their exchange rate to the US Dollar .
5️⃣Birth of Floating Currency - Currency that is not pegged to any assets or other currencies is known as a 'floating currency'.
And what will be next?
Very hard to say but blockchain technologies will make the system change again.

Your Ultimate Guide to RSI DivergenceYour Ultimate Guide to RSI Divergence (Settings & Tips)
Hey traders,
Relative strength index is a classic technical indicator.
It is frequently applied to spot a market reversal.
RSI divergence is considered to be a quite reliable signal of a coming trend violation and change.
Though newbie traders think that the application of the divergence is quite complicated, in practice, you can easily identify it with the following tips:
💠First of all, let's start with the settings.
For the input, we will take 7/close.
For the levels, we will take 80/20.
Then about the preconditions:
1️⃣ Firstly, the market must trade in a trend ( bullish or bearish )
with a sequence of lower lows / lower highs ( bearish trend ) or higher highs / higher lows ( bullish trend ).
2️⃣ Secondly, RSI must reach the overbought/oversold condition (80/20 levels) with one of the higher highs/higher lows.
3️⃣ Thirdly, with a consequent market higher high / lower low, RSI must show the lower high / higher low instead.
➡️ Once all these conditions are met, you spotted RSI Divergence.
A strong counter-trend movement will be expected.
Also, I should say something about a time frame selection.
Personally, I prefer to apply it on a daily time frame, however, I know that scalpers apply divergence on intraday time frames as well.
❗️Remember, that it is preferable to trade the divergence in a combination with some price action pattern or some other reversal signal.

Triangles PatternsWe have 3 different main types of triangle patterns.
Symmetrical
Ascending
Decending

( Weekly Analysis ) GBP/JPY DailyMorning Godal Member's, Traders and Aspiring Traders . Todays shared post is a analysis on .
Pair :GBP/JPY
Time-Frame - D
Biased - Bearish
Very similar to previous post on NZD/USD with the double top but on this occasion this is a based on a large time frame continuation. Price has currently formed a head and shoulders at an identified major resistant trendline . A chart pattern deemed as a reversal pattern to some and the neckline has also been formed so based on this I will be waiting on a pull back for potential trades to the down side for the long run.

10 chart patterns every trader needs to know10 chart patterns every trader needs to know
10 chart patterns every trader needs to know!
- Best chart patterns
1. Head and shoulders
2. Double top
3. Double bottom
4. Rounding bottom
5. Cup and handle
6. Wedges
7. Pennant or flags
8. Ascending triangle
9. Descending triangle
10. Symmetrical triangle

EURUSD forecast / trades takenHey everyone. Just an update on the trade last night. As you can see we had a HTF buy range (1hr) where price came back into the discounted section. We then had a 30min range bar mitigation which created a large reaction to the upside so we can say this is where a money transfer has taken place.
Subsequently this made our new buying range and yet again price came back into the discounted area and gave the lower time frame entry, there were a few ways of getting into this trade and it also gave scale ins if it was missed.
Price then was heading into the daily premium region so we knew we needed to be partialing out of this trade as we pass through and mitigate the levels of supply, these supply levels were creating pullbacks to continue up however given the HTF area we are it is very wise to partial heavily where we did. Anyone everyone, theres a bit of an insight into one of the team trades last night in the Newyork session. Happy trading ladies and gents and i hope you learnt something.

( Weekly Analysis ) EUR/CAD DailyMorning Godal Member's, Traders and Aspiring Traders . Todays shared post is a analysis on .
Pair :EUR/CAD
Time-Frame - D
Biased - Bullish
As personally identified , based on my allocated bearish daily trendline being broken and a new higher high being made . ill be waiting for a pull back for further upside once newly found support is tested and personal entry criteria is met.

History of Forex | From Ancient to the Modern Day TradingWe have come a long way from the previously practiced barter system to the modern-day system of trading currency. Following is a brief summary of the evolution of currency and how it gave rise to Forex Trading.
Here are the main stages that are illustrated on the chart:
1️⃣The Ancient system of Trading - Trading with Gold
As early as 6th century BC , the first gold coins were produced, and they acted as a currency because they had critical characteristics like portability, durability, divisibility, uniformity, limited supply and acceptability.
2️⃣Bank Notes Originated - Deposited Gold in banks in exchange for banknotes
3️⃣Role of Geography - Various banks of different regions printed different currencies
Gold Standard - Currency pegged to gold
In the 1800s countries adopted the gold standard. The gold standard guaranteed that the government would redeem any amount of paper money for its value in gold . This worked fine until World War I where European countries had to suspend the gold standard to print more money to pay for the war.
4️⃣Bretton Woods System - Currency pegged to USD
The first major transformation of the foreign exchange market, the Bretton Woods System, occurred toward the end of World War II.
The Bretton Woods Accord was established to create a stable environment by which global economies could restore themselves. It attempted this by creating an adjustable pegged foreign exchange market. An adjustable pegged exchange rate is an exchange rate policy whereby a currency is fixed to another currency. In this case, foreign countries would 'fix' their exchange rate to the US Dollar .
5️⃣Birth of Floating Currency - Currency that is not pegged to any assets or other currencies is known as a 'floating currency'.
And what will be next?
Very hard to say but blockchain technologies will make the system change again.

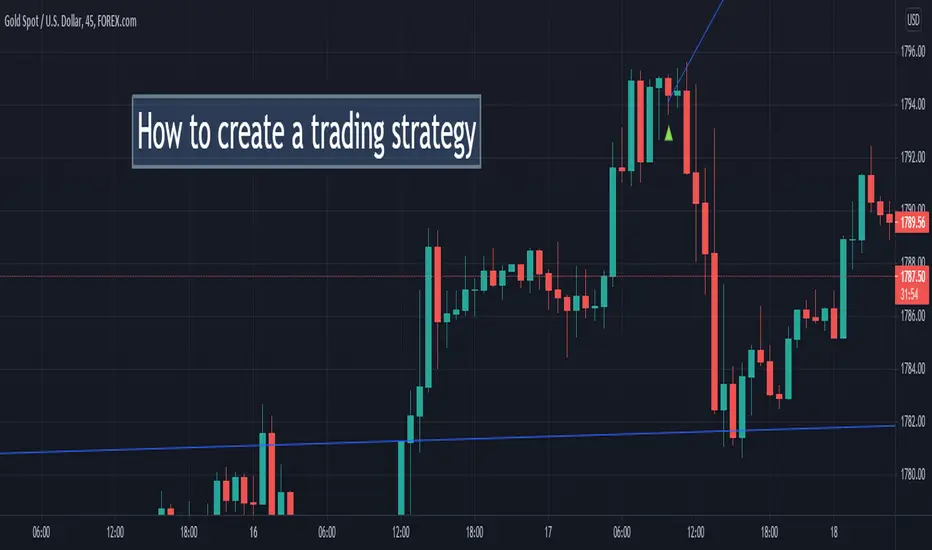
How to create a trading strategy?HOW TO CREATE A TRADING STRATEGY?
WHAT IS A TRADING STRATEGY?
Trading rules that systematize it, bring clarity, orderliness and predictability of the result. You can take a ready-made strategy and adapt it for yourself. And you can create your own
The main idea of the strategy, its rationale
The idea should be rational, based on market patterns that you understand. For example, trading with a trend or pullbacks. On technical or fundamental analysis , with or without indicators
A good trading strategy is not complicated, but simple. A large number of rules makes the strategy inconvenient and understandable for the trader himself.
Timing of trading
What timeframes do you want to trade on?
How much time are you willing to devote to trading?
What time will you trade?
Selection of trading instruments
Pick those tools. which you understand well
The strategy can be both universal (for many tools), and sharpened for specific toolsChoice of tools for analysis
1) When the main idea of the strategy emerged and it became clear how, when and what to trade, you need to decide on the tools of market analysis
2) If the strategy is indicator, then select indicators (from 2 to 5)
3) If the strategy is not indicator, then select patterns, figures of graphical analysis
4) If the strategy is based on fundamental analysis , then it is necessary to decide on which news to trade.
Trade entry rules
Under what conditions will you enter the market based on what signals?
When will you not open a trade?
What orders will you use market or pending?
Exit rules
Stop Loss and Take Profit
Under what conditions do you close a position?
How will you set stop loss and take profit?
Risk Management
Write down the risk per order, risk per day / week / month
(in percent or in currency)
Determine the maximum allowed number of losing trades
per day / week / month
Calculate the volume of a trading position (lot)
When there is a strategy, what's next?
Check the effectiveness of your strategy on the strategy tester or on a demo account
Maintain trade statistics to identify weaknesses of the strategy and remove them
Find me on:
BTC USDT correlationHello traders,
I think those two charts are useful when used alongside each other in correlation.
It is logical that decline in BTC price leads to inflow in USDT and vice versa. So we could say (and the chart shows, that the correlation between the price BTC and market cap of USDT is inversely proportional).
For further simple explanation there are some events marked on the chart:
Red Flag - A gap in USDT inflow probably shows that institutions are selling before BTC price declines. It is actually only the third candle on USDT when the selloff of the bitcoin occurs.
Blue flag - USDT cap fails to pick up momentum and start going down significantly while BTC surges.
Orange flag - USDT market cap is flatting out, fails to go lower low and starts forming local higher lows. BTC is still pushing higher, but the trend is converting to the broad bull channel/Trading range as more and more bears are buying into the shorts and more and more bulls are taking profits.
Purple flag - BTC - huge rising wedge formed and wedges tend to break to the lower side. Lower high also formed and after.
3rd higher low formed and money starts to flow into USDT.
Green flag - wedge top in USDT, while wedge bottom in BTC. Reversal on both charts.
At the moment USDT market cap is in sharp decline, which might signal that BTC will be going much higher

Improve Forex TradingWhen I was learning how to trade and when I was watching and reading different trading educators, these words naturally pissed me off. What the hell are you talking about? What confirmation?
It was a full-blown mystery...🤯
Then, once I started to mature in trading and trade full-time, I became an author on TradingView.
Posting my forecasts and trading setups, I frequently mentioned the confirmation.
And now the newbies that are reading me and learning from me are pissed off...🤬
That is so funny I guess.
But the truth is that the confirmation must become a fundamental part of your trading strategy. It is your key to successful trading.
What exactly is the confirmation?
It depends on many many different things, in this article I will discuss with you the 4 main types of confirmation and give you detailed examples.
1️⃣ - PRICE ACTION CONFIRMATION
That is actually what I prefer.
Analyzing different markets and searching for decent trading opportunities often times we find some peculiar instruments to watch.
Identifying the market trend and key levels we find the potential spots to trade from.
But do we just open the trade once the "ZONE" is spotted?
I wish it could be that simple...
Trading just the zone, without additional clues brings very negative figures. We definitely need something else.
Price action & candlestick patterns can be those clues.
Accurate reflection of the current local market sentiment makes the patterns a very reliable confirmation.
Dodji's, pin bars, double tops/bottoms ...
Proven by history, the skill of identification & reading the patterns will pay off quickly.
Being in some sense the language of the market, the patterns are the fundamental part of my trading strategy.
2️⃣ - FIBONACCI LEVELS
Fibonacci levels are a very popular technical tool. Being applied properly it helps the trader to confirm or, alternatively, disqualify the identified "ZONE".
With multiple different methods like confluence trading, fibs are applied in hedge funds and various banking institutions.
The main problem with the fibs, however, is complexity and a high degree of subjectivity. Meeting different traders and watching different posts on TradingView I noticed that all traders tend to have their own vision. There is no universal system to apply here, a proper fib.confirmation technique can be built only with long-lasting backtesting and practicing.
3️⃣ - FUNDAMENTAL NEWS
The figures in the economic calendar, news, tweets. Actual fundamental news can become your best confirmation tool.
However, the main obstacle right here is the promptness, validity and reliability of the data that you get.
The information shouldn't be delayed and it must be objectively true.
The search for such a source is by itself is a very time-consuming and labor-intensive business not even mentioning its potential costs.
And that is not all. Knowing how to make sense of that data, its proper perception, and understanding requires a solid economical and financial background and experience.
At the end of the day, becoming an expert in fundamental analysis , the trader can easily sort the trading zones and trade only the ones that are confirmed by a decent fundamental trigger.
4️⃣ - TECHNICAL INDICATORS
I believe all the traders apply some indicators. From a simple moving average to some complex composite algorithms, indicators play a very important role in trading.
Being 100% objective and providing up-to-date real numbers and figures, they are our allies in a battle against subjectivity.
For many traders, the various signals from indicators are considered to be accurate and reliable confirmations.
Many algotrading solutions are operating simply relying on such signals and being able to bring consistent profits proves the power of technical indicators.
What confirmation type should you rely on?🧐
I guess the main rule right here is that the confirmation must MAKE SENSE to you. You should feel the logic behind that. It must make you confident in your action, even in case of the occasional losses, it must keep you calm and humble.
Let me know in a comment section what confirmation do you prefer!
Impulse concept practiceI got this concept from EuroMotif and his amazing research on fibs. I'm putting this here to see if I nailed the concept. I took the top of bitty and plotted an impulse down. I also marked some fib pings along the way. Based on his concept, there should be a major reaction once it hits the zone I've marked as the impulse, particularly the impulse core around 56,400K and 59,600K. Assuming that the bottom of the zone is cleared, there should be an strong drop from the impulse core level, as the bears have max strength in this range. However, if the bulls are able to flip the impulse zone from resistance to support, bitty should take off from the top of the impulse zone. I put arrows to show what I think might happen. These arrows are just speculation, as I'm still learning all this stuff. Actually all of this is speculation but I digress...
If the bulls eventually take the top of the impulse and bitty goes for a new ATH, I'm still stickin to that 72 or 74K target for the next move. This number comes from one of my earlier ideas playin with fibs. The eth one I did far surpassed the 2200 target from my earlier fib practice, so I'll see how it goes...

Bitcoin made a pull backA pullback is a pause or moderate drop in a stock or commodities pricing chart from recent peaks that occur within a continuing uptrend. A pullback is very similar to retracement or consolidation, and the terms are sometimes used interchangeably. The term pullback is usually applied to pricing drops that are relatively short in duration - for example, a few consecutive sessions - before the trend resumes.
What Does a Pullback Tell You?
Pullbacks are widely seen as buying/selling opportunities after a security has experienced a large upward/downward price movement.
For example in an uptrend market, a stock may experience a significant rise following a positive earnings announcement and then experience a pullback as traders with existing positions take the profit off the table. The positive earnings, however, are a fundamental signal that suggests that the stock will resume its uptrend.
Most pullbacks involve a security’s price moving to an area of technical support, such as a moving average or pivot point, before resuming their trend.

Afghanistan’s Fall And Its Possible Impact On The Global FinanciAfghanistan has been thrown into turmoil over the past few days, and the effects of the fall of the government could go beyond the local market and affect the global financial markets also.
Taliban Takes Control Of Kabul
The biggest news in the world over the past few days is the Taliban taking control of Kabul and effectively replacing the Afghanistan government. The uncertainty comes after the United States and its allies withdrew their troops from the Middle Eastern country for the first time in a decade.
United States President Joe Biden decided earlier this year that the country would be pulling its troops from the Middle Eastern country for the first time since they were deployed after the 9/11 attack. According to the president, the US has spent over a trillion dollars, and it has achieved its objective in the country.
However, the Taliban didn’t take long before completely overrunning the Afghan military and gaining control of major territories in the country. The group took control of Kabul, the nation’s capital, with President Ashraf Ghani fleeing the country on Sunday evening. The Taliban took control complete of the presidential palace and declared that the war is over.
The Afghan situation has escalated over the past 24 hours, with thousands of people looking to flee the country due to the uncertainties of Taliban leadership. The airports around the country are flooded with thousands of people seeking to leave the country while millions more are at the passport offices looking to process their Visa and flee. The turbulent environment in Afghanistan is definitely going to affect the local market, but the international markets would also be affected.
Local And International Markets Could Be Affected By The Situation In Afghanistan
There is no factor that negatively affects the financial markets like the uncertainty of investors. Following the recent unrest and the toppling of the president, the investor confidence in Afghanistan could drop to an all-time low.
Millions are looking to flee the country, and this implies that virtually all aspects of the economy are not working. If people are worried about leaving the country, they won’t settle down to do their jobs, and this will negatively affect the economy. With economic activities currently down, it is only right that the financial markets are down also.
Furthermore, some foreign countries such as Germany are starting to pull their people out of the country. Investors, but foreign and local, will have little interest in the Afghan financial markets at the moment, and this would have both short and medium-term effects on the economy. If the Taliban remains in power, many investors will pull out of Afghanistan as they would not be sure of the working conditions under the new Islamic leadership.
On the global stage, the financial markets would also be affected. So far, the effects of the unrest in Afghanistan are already visible in other parts of the world. Financial market indices are down, with investors keenly watching to see how the world leaders would react to the situation.
The FTSE 100 dropped by 0.90% today, while the STOXX Europe 600 also lost 0.50% of its value. The Dow Jones Industrial Average (DIJA) and the S&P 500 are also down by 0.065% and 0.23% so far today. The NASDAQ composite is another major index that is currently trading in the red zone, and it is down by 0.74% at the time of this report.
This means that most of the major global financial market indices are trading in the red zone over the past 24 hours. The performance paints a clear picture of the current state of the financial markets and what investors are feeling.
Joe Biden is expected to make an address regarding the situation in Afghanistan later today. His speech could play a huge role in how the financial markets would perform over the next few days. This is because most of the other major world leaders would be looking to the United States to determine the next line of action. The next few hours and days would be interesting as the progress in Afghanistan could shape the performance of the financial markets globally.
This article was originally posted on FX Empire

Head and Shoulders PatternThis is just one example that we mustn't expect perfection. If everything were perfect everyone could be billionaire and to be one could be so much easier. Should we expect life to be easy? I think it would be boring. Hahaha. A little challenge is good for us, when we put in diligent effort to learn something and achieve some measure of success we become proud of ourselves, deep inside we praise ourselves for accomplishing something.
Trading is not easy as the books portray it, it was designed not to be easy, but if we take time to learn it we can make it a bit easier for ourselves and the rewards that comes thereafter are much greater.
Trade Smart!
Do not forget to like, share, comment and follow if you enjoy my ideas.
I will be thankful!
