EURUSD 30m . Just now, I have got a 7:1 return
X point is a structure, hoarding a large number of unfilled orders
Point C is the high point created by the X structure.
Point B is the first test to sell the X structure, and there is no new low.
Point A is the rebound of point B after the X structure test.
So if the buy order for the X buy structure is not strong enough, then why is there a point where point A is higher than point C?
Therefore, when the new high A point appears, the bullish sentiment will rise. When the price falls back to the X structure again, we will grab another rebound with the smallest stop loss. The reason is that point C has been broken by point A.
We don't need to think that we can catch a big market every time. When we have the risk quota and size, we can calculate the larger size based on the stop loss spread and quickly make a big profit in the short-term.
Also, let's focus on the 4H closing. If the backstepping structure is effective, then in the short term, we can switch to the long idea.
There are two reasons
1, Y point is the 0.886 golden section of this downward trend to stop the decline;
2; The megatrend is still a bullish structure, and the Y point has not been broken.
EURUSD
Fibonacci


EUR/USD UPTRENDING !!*-BROKE ASCENDING TRENDLINE
*-DOUBLE BOTTOM FORMATION SIGNALING A TREND CHANGE
*-PRICE IS ABOUT TO CREATE A NEW DESCENDING TRENDLINE
*-I AM EXPECTING A FURTHER MORE SMALL PUSH TO THE DOWNSIDE TOUCHING THE SUPPORT AND FIBONACCI RETRACEMENT
*-PRICE MIGHT ALSO CORRELATE WITH 50 EMA
*-WAITING TO SEE SOME PRICE ACTION/CANDLESTICK PATTERNS ON MY POCKET BEFORE ENTERING A LONG TRADE
*-BE CAREFULL OF NFP THIS FRIDAY
*-ITS BETTER TO CLOSE ALL OPEN TRADES BEFORE NFP
#tradesafe #education #bestsetup #learn #freecontent


Wait confirmation candle EURGBP daily timeframe June 28, 2019
You see trendline orange ??? If yess, if you are trendline trader, I'm pretty sure you will open SHORT POSITION directly .
But from my experience , what I can say is TRENDLINE in many proof, like this now EURGBP , you see price keep moving up , and breakout trendline !!! However, my past experience teach me to avoid using trendline . Trendline is useless for me !!
I believe to reading candlestick. Because ,somehow ,the tail of candle already representation of fibonacci retracement ( FR ) .But I keep being realist. I keep try to drawing FR and caught that price EURGBP may want go to testing FR 88,6% , and for me personal, I will wait some of candle confirmation to opening long or short !
But if you go to weekly timeframe, you will realized there was double top supply area on top the current price. So then, that make sense if price perhaps 70% after touch FR 88,6% will bouncing , dropping !!
Thank you guys for your time to read this all words. Hopefully you can understand my english.

eurchf longFX:EURCHF
Hey all, as you can see i'm trying out methods, i'm trying to see what works for me so apologies if you are wondering "why does he keep changing entry types etc"
I'm by no means an expert trader but I promise you I will get there.
Im using supply demand areas
fib ext
rsi.
Hoping this will work out for me.
Apologies for poor quality of sound my laptop fan is terrible. Maybe when i become profitable I can invest in a new lappy :-)


How to use Fibonacci in #CryptocurrenciesAs you can see in the image, Bitcoin and Fib retracements are a very powerful combination. I personally only use 61.80% & 78.60% because this particular market is very volatile and prices tend to go down or up very fast. Always wait for 4H or Daily Closure and a good candlestick pattern like doji, tweezers tops, hammer. Remember that the most powerful Fibonacci plays perfectly when you are with the trend. As you can see in my related ideas, i use Fibonacci for confirmation and for correlation with my key levels.
Feel free to leave a comment below and if you like the content i am posting give this article a like and follow me for more premium knowledge.

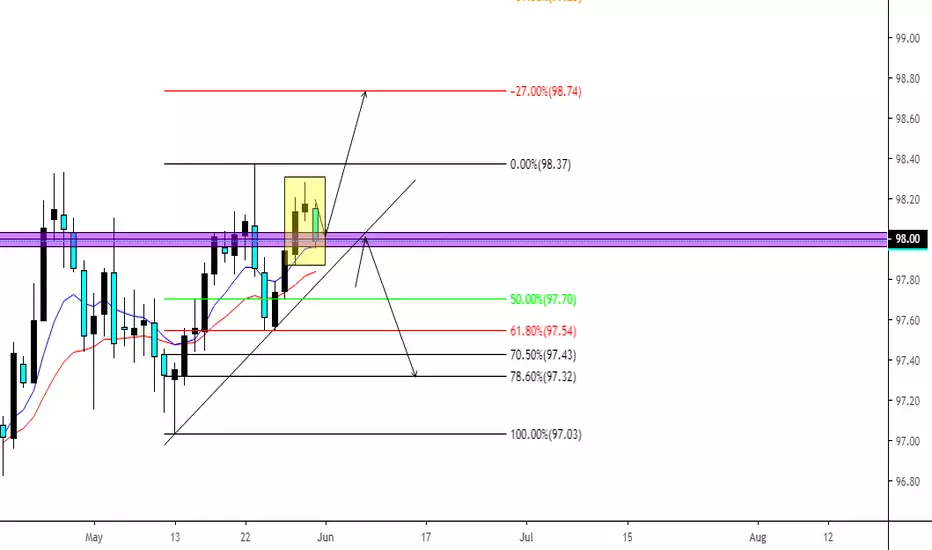
DXY (US DOLLAR INDEX) LONG BIASIf Dollar Index Weakens XXX/USD goes up. If Dollar Index Strengthens XXX/USD does down.
Looking at DXY I can see a Reversal Pattern form inside the box with a Pin Bar, Doji and what looks to be a Bearish Engulfing Candle. However, the market is uptrending & this could easily be a retest on 98.00 for a continuation upwards to fulfill the -0.27% extension.
Plan A:
We have got a fair bit of USD news coming out in 5 hours following this week will be NFP and Client Sentiments show that the vast majority of Retail-Traders are Shorting the USD and Longing XXX/USD, So I choose to observe the masses and do the opposite which is have a long Bias on USD...Also I dislike going against the trend of the market;)
Plan B:
I will not be looking to Short the USD unless there is a clear break of the Counter-Trend line.
Targets at -0.27%
"Pulse'' of an asset times Fibonacci: Bitcoin near Impulse ReduxThis is part of my ongoing series "Pulse of an Asset times Fibonacci".
An "Impulse" in any market creates "Ripples" like a Pebble into Water.
Sometimes a Wave returns to the Impulse, should be observed carefully.
This Impulse was the drop from 7400 over six months ago.
Its Ripples marked almost every turn in price since that time.
The Wave has since walked back up the same staircase near top.
1.618-1.236 Band will be first line of defense for the Bears of the Impulse.
0.618-0.382 Band will be the "Core" of the Impulse with maximum power.
1.0 and 0.0 Boundaries of the Impulse are also worth watching closely.
Rejection from Outer Defense is expected but may return.
Penetration of Impulse Boundary should be scary for Bears.
Penetration of Impulse Core means ultra-confident Bulls.
.
.
Ordered Chaos
every Wave is born from Impulse, like a Pebble into Water.
every Pebble bears its own Ripples, gilded of Ratio Golden.
every Ripple behaves as its forerunner, setting the Pulse.
each line Gains its Gravity.
each line Tried and Tested.
each line Poised to Reflect.
Confluence of 2 is Dependable.
Congruence of 3 is Respectable.
Coincidence of 4 is Worshipable.
every Asset Class behaves this way.
every Time Frame displays its ripples.
every Brain Chord rings these rhythms.
He who Understands will be Humble.
He who Grasps will observe the Order.
He who Ignores will behold only Chaos.
Ordered Chaos
.
.
.
want to Learn a little More?
can you Spend a few Moments?
click the Links under Related.

The "Pulse" of an asset times Fibonacci: Tron revists Impulse ?Part of my ongoing series to observe certain Price Action events.
An "Impulse" creates "Ripples" like when a Pebble falls into Water.
The Ripples make up the "Wave" which eventually ends and recedes.
As the Wave recedes, it will collide with Ripples in opposite direction.
If the Wave returns to Impulse, that is an event worth close scrutiny.
As the Wave gets closer, each turn in price provides a clue to the future.
Are the Buyers of the Impulse still there?
Are they eager to jump in earler this time?
Are they exhausted and abandoned the core?
The above example is part of this collection of "Impulse Redux" events:
Examples of my General concept of "Pulse of an Asset" started here:
Further detailed examples of the General Concept in "Chapter 2":
Lastly here is another collection of a specific occurance, the "9.618 Murderer of Moves":

The "Pulse" of an asset times Fibonacci: WTC returns to ImpulseThis is part of my ongoing study of assets that "Return to the Impulse".
An impulse occurs from a large sell/buy force applied for limited time.
If re-visited, Impulse usually rejects at boundary or core of .382-.618.
This was an perfect example of the .618 rejecting, TWICE.
On second attempt it rejected even before being touched.
Maybe a third attempt will give us yet more learning events.
Many analysts use previous Tops or Bottoms are Support/Resistance.
That method relies on the START of an impulse, but is rarely revisited.
With a properly marked Imuplse, we can see the EXACT area of interest.
Here is "Impulse Redux" collection the above belongs in: (scroll to see Updates)
Here is the original "Pulse of an asset" collection:
Here is a collection of ''Beware the 9.618" events:

Let's get freaky with Gann Box Analysis and Time CyclesI have decided to help make a more in-depth analysis covering CSE:LHS since the stock is fairly new. The chart above is where we are currently sitting, which is on the bear side of the gann box but we will get into that later.
How I start drawing Gann Boxes:
Use the dynamic Gann box tool and draw from high to low or low to high;
Configure the settings to show only 1 & 0.5, set all others to zero and turn angles on.
Things to remember about Gann's time cycles:
Days of interest and should be watched are significant days in a given solar year. Any of the solstices and equinox's (Dec 22, March 21, June 21, Sept 23) and their important angles which are in increments of 15 from these days. This means that 15 days after these significant days in a solar year.
Gann used degrees in a circle to compute cycle lengths. The 360 degree in a circle is approximately the same as 365 days in a year. So he used 180 (half a circle), 90 (a quarter of a circle), 45 (1/8 of a circle), 135 (90+35), etc.
He also used eights of 90 for shorter cycles to calculate the trading days in a cycle. 1/8 of 90 is 11.25 days, 2/8 is 22.50 days, 3/8 is 33.75 and 4/8 is 45 days. 5/8 is 56.25, 3/4 is 67.50, 7/8 is 78.75 and 8/8 is 90. If we round these numbers we trading day counts of 11, 22, 34, 45. 67, 79, 90.
Step 1:
Draw the first Gann Box from Low to High so an entry point can be established on the pullback.
Step 2:
Clone the Gann Box over to find entry once a support line is reached on one of the increasing angles about the 45 deg line. I use other indicators to confirm entries and exits. In the chart below we can see support is reached on Dec 13, 2017, but MACD hasn't come close to crossing. The actual breakout is on Dec 28, 2017, when we see strong RSI, Stoch crossover and MACD crossover to confirm entry. Oddly enough this date is shortly after the Winter Solstice which Gann says is a date to watch for. Digging further we see a high made when it reaches one of the trading cycle counts of 23 which is right after the 22nd degree.
Step 3:
The cycle has ended with The Box now broken and invalid since the creation of a new all-time high. We can expect an inflection point here and we can now redraw the Gann Box from the low to this new high. Oddly enough this Gann box has a cycle of 77 trading days and if we look above at the important dates we are pretty close to Gann's cycle.
As you can see we break the bottom of the box and again have to redraw the box to establish a new position if we can see movement onto the bull side of the box.
Step 4:
Since the creation of the new box and cloning the box over we can see a few things. We begin with the inflection upward along the strong trend line which is confirmed by rising RSI and Stoch crossover. However, this rally doesn't last since we soon break down into the bull side and consolidates until we reach a new ultimate low.
Step 5:
Since the Gann Box has become invalid once breaking through the bottom we can now redraw a new dynamic Gann box which end's up being our most current. From here we will analyze this one a little bit further.
We can see a few things after we create a new box. We have reached an inflection point where a rally starts moving and continues along the bull side of the box. An entry here is promising since the indicators are confirming a strong trend is imminent. Eventually, we break below the 45-degree angle and enter into the bear side where a trade would be closed.
If we look at this pullback we can see that it hits an area of support when we apply Fibonacci. We eventually break below the 1x1 angle but are able to make a nice gain should we choose to.
Present Day Look:
Pay attention to where the close is relative to the angles and what the indicators are telling us.
Looks like we are on the bear side of the box with a weak trend and the indicators do not look promising.
Well, that is it for me on this. Tell me what you guys think, don't be afraid to start a conversation with me if you have charts and ideas to share.

Basics special edition. The 4 kind of support.Can you tell from the chart what the main 3 supports are? :)
A- Horizontal lines.
The price has a tendency to react to these lines... Every one knows about horizontal lines of support and resistance.
These horizontal supports and resistances have to be drawn on swings high/low. Wicks or closes can be used...
Here are a few examples:
B- Diagonal lines
Another type of support, alot of people do not like this because they don't understand it "Uuuh trendlines are a scam when I hit my head on a wall then buy on the line for no reason other than the line I don't make money".
Very good like horizontal levels. Wicks or closes can be used...
Here are a few examples:
C- 0.618
An important one, I think especially with currencies but I am not sure about that.
Drawn from swing low to swing high. Alot of people look at it and think it matters, hence it does.
Here are a few examples:
D- Other
Those were the big 3. Horizontal lines, Diagonal lines, 0.618. I only like the 3 and ignore the rest.
Other elements can be used, such as moving averages, psychological round numbers, and I don't know what else that's it I would say.
Here are a few examples:
These are the basics that every one should know, but very few actually do. And they go risk 10% per trade not even knowing this lol. Good luck being in the 9%.
Of course, there is more to it than this, these levels can be relevant or not, drawing lines (a & b and even C sometimes) is more a skill than an "exact science" you can just automate. How to look at the correct supports and ignore the bad ones? What conditions to enter? Where to enter and stop loss and target? How to draw them correctly each time? This is for me to know and you to find out :)
The "Pulse" of an asset times Fibonacci: Golden Ratio of GrowthLTC in a perfect example of "Golden Ratio of Growth".
Each extension is 1.618 times the previous extension.
Most things in Nature which Grow, do so by this Ratio.
Impulse was from the Bottom of Despair.
Ripples were all grown with perfect Ratio.
Retraces will be of much similar proportions.
.
.
Ordered Chaos
every Wave is born from Impulse, like a Pebble into Water.
every Pebble bears its own Ripples, gilded of Ratio Golden.
every Ripple behaves as its forerunner, setting the Pulse.
each line Gains its Gravity.
each line Tried and Tested.
each line Poised to Reflect.
Confluence of 2 is Dependable.
Congruence of 3 is Respectable.
Coincidence of 4 is Worshipable.
every Asset Class behaves this way.
every Time Frame displays its ripples.
every Brain Chord rings these rhythms.
He who Understands will be Humble.
He who Grasps will observe the Order.
He who Ignores will behold only Chaos.
Ordered Chaos
.
.
.
want to Learn a little More?
can you Spend a few Moments?
click the Links under Related.
