Fib Retracement From ScratchHello, traders!
As you can see, SkyRock traders always use Fib tools for our analysis and predictions. We find Fibonacci tools a great powerful series of instruments that’s necessary to use. Today we’ll speak about one of my favorite TA tools - Fib Retracement.
Fibonacci retracement levels are horizontal lines that indicate where support and resistance are likely to occur. They are based on Fibonacci numbers. Each level is associated with a percentage. The percentage is how much of a prior move the price has retraced. The indicator is useful because it can be drawn between any two significant price points, such as a high and a low. The indicator will then create the levels between those two points. Well, it seems to be not very important and attractive how to calculate Fib Retracement Levels. You should just know that they are based on something called the Golden Ratio. It’s believed that all natural laws are based on this ratio. However, the right usage of it is deadly important.
To initialize it, put the first point to the previous lower low and the second to the confirmed higher high during the up-trend and vice versa during the sown-trend.
What can it tell you?
Initially, support and resistance. It could hardly be possible to find the tool better for such purpose. Then, the levels of it is usually reached, thus it may produce some signals. Although it’s very powerful tool, it’s kinda ridiculous idea to use it marginally. Also, the areas of sideways is also defined by it, cause of high probability of consolidation in «Golden Pocket». And at last, it helps ms to define Gartley and Elliott patterns.
Well, guys, as you can see it’s really great and multifunctional instrument that can help every of you to trade and make money trading. Use it in the right way! Have a nice trading day, dear traders!
DISCLAMER: Information is provided only for educational purposes. Do your own study before taking any actions or decisions at the real market.
Fibonacci

Fibonacci Masterclass - Fibonacci Retracement and ExtensionHi guys, I have finally completed the thread on Fibonacci (Though it took longer than usual). I have tried with the best of my little knowledge to create this thread. This has everything you need to know about Fibonacci retracement and Fibonacci extension. Also, if the thread is free that doesn't mean I have compromised with the quality. All you have to do is just read this thread again and again until you get a good grasp of it. everything.
Table of Contents:
1. What Are Fibonacci Retracement Levels?
2. Significance of Fibonacci Retracement levels
3. Finding Fibonacci Retracement Levels
4. How to use the Fibonacci retracement levels?
5. What are Fibonacci Extensions?
6. Significance of Fibonacci Extension levels
7. Finding Fibonacci Extension levels
8. Difference Between Fibonacci Retracements and Fibonacci Extensions
What are Fibonacci Retracement levels?
• Fibonacci retracement levels are horizontal lines that indicate areas where the price could stall or reverse.
• These horizontal levels can act as a potential support or resistance levels
• They are based on Fibonacci numbers. Each level is associated with a percentage which means how much of a prior move the price has retraced.
• The Fibonacci retracement levels are 23.6%, 38.2%, 61.8%, and 78.6%.
• While 50% is not a pure Fibonacci ratio, but it is still used as a support and resistance indicator. This is because people worldwide regard it as an important level.
• The price won’t always bounce from these levels. They should be looked at as areas of interest. Hence, please use the Fibonacci retracement as a confirmation tool.
Significance of Fibonacci Retracement levels
Fibonacci retracements can be used to:
• Place entry orders
• Determine stop-loss levels
• Set price targets
For example , A stock may be in an uptrend. After a move up, it retraces to the 61.8% level. Then, it starts to go up again. Since the bounce occurred at a Fibonacci level during an uptrend, you can enter long positions with a stop loss just below the Fibonacci level or at the candlestick low.
Finding Fibonacci Retracement levels
In order to find the Fibonacci retracement levels, you have to find the recent significant Swing High and Swing Low.
• For uptrends, select the Swing Low and then the Swing High.
• For downtrends, select the Swing High and then the Swing Low.
Example: Fibonacci retracement in an uptrend
Example: Fibonacci retracement in a downtrend
How to use the Fibonacci retracement levels?
If the price is approaching a Fibonacci level, you should look out for the following things at the point of interaction or in the vicinity of the level.
• Some reversal candlestick pattern
• Volume is above average.
• Moving average
• RSI divergence
• Previous S/R level or pivot level
The trade will be a high probability trade if some of these factors create a confluence zone.
What are Fibonacci Extensions?
• Fibonacci extension is a tool that can be used to find price targets or estimate how far a price may move after the retracement/pullback is over.
• Extension levels are also possible areas of interest where the price may stall or reverse.
• It can be used to find projected areas of support or resistance when the price is moving into an area where other methods of finding support or resistance are not applicable or evident.
• If in a stock, a new high/low occurs, the trader can use the Fibonacci extension levels to get an idea of where the price can go.
• Fibonacci extension levels can be calculated to give the trader ideas on profit target placement.
Significance of Fibonacci Extension levels:
• Fibonacci extensions can be used for any timeframe and in any market- stocks, commodities, cryptocurrencies, etc.
• Fibonacci extension levels indicate a price area that will be significant for the stock after the pullback/correction is over.
• Extension levels can be drawn on different price waves over time. When levels from these different waves converge at one price, that could be a very important area.
Finding Fibonacci Extension levels
In order to find the Fibonacci extension levels, you have to find the recent significant Swing High and Swing Low.
• For uptrends, click on the Swing Low and then on the Swing High. Then go to the Fibonacci setting and click on reverse. Or if your software directly has the extension tool then it’s even easier.
• For downtrends, click on the Swing High and then on the Swing Low. Then go to the Fibonacci setting and click on reverse.
Example: Fibonacci extension in an uptrend
Example: Fibonacci extension in a downtrend
Difference Between Fibonacci Retracements and Fibonacci Extensions
• Fibonacci retracements provide levels for a pullback whereas Fibonacci extensions provide levels to move in the direction of the existing trend.
• For instance, a stock goes from 50 to 100, and then back to 75. The move from 100 to 75 is a retracement. If the price starts rallying again and goes to 150, that is an extension because the price moved past the previous swing high which is 100 in this case.
This is everything you need to know about Fibonacci retracement and extension levels. This thread is more than enough to make you profitable. Keep reading and revising until you learn everything written in this post. I hope you find this post useful. Also, if anyone is interested in getting a consolidated PDF version of this thread, then you can message me, I'll provide it.
Disclaimer: This is NOT investment advice. This post is meant for learning purposes only. Invest your capital at your own risk.
Happy learning. Cheers!
@johntradingwick

Retracements and Expectations👨🏫 A students ask me to clarify a strategy I use when momentum trading using retracements in something I call the "Springboard Effect"
The theory is, the deeper the retracement after the initial impulse move the less chance of an extension or "strength" of the continuation.
I like to use the analogy of a Spring Board, (or diving board) and the stiffness of the board or the amount of "spring" it has 👇
🤔 Imagine we we have 4 different boards, all with a different amount of springs and we are going to drop the same amount of weight ⚖️ from the same height onto each board.
When we drop the weight onto the board that has lots of springs, it wont retract far before launching the weight high 🚀
If we drop the weight on a board that has a less springs it will retract further, but have less strength to launch the weight very high 🛫
If we drop the weight onto a board that has barely any springs then it will retract a lot and then struggle to even launch the weight higher than the height it was dropped from 😤
In this analogy.....
The height we dropped the weight from, is the top of the impulse move 📈
The different boards are the different fib retracement levels 🧮
The springs are the buyers at those levels 💵
How far it throws the weight is the strength or price action of the extension 💪
👉 A Bounce on the 382 tells us that there are plenty of buyers wanting to enter this market asap, this is a good sign that the extension could be strong. I like to target the 1.618 extension and or match it up to a level of resistance close by
👉 A bounce on the 50 tells me there is still a lot of bullish momentum but buyers where happy to buy it much lower, I'll still consider this bullish and target the 1.272 extension and match it up with some resistance close by or front run the level if I have to.
👉 A bounce on the 618 I dont really consider to be a strong move, I feel we will get a good bounce and may extend further, but I play close attention to the previous high incase we double top. I will look for things like candle stick reactions and use the CCI to spot divergence if momentum is lacking.
👉 A bounce on the 782 I consider a failure of the trend, I will expect buyers to still step in, but it will be a weak bounce and only really look to target other fib levels inside the retracement as potential resistance and this trade becomes more of a short term scalp.
I hope this makes sense and adds some value to your trading, peace ✌️

Elliott Corrective & Impulse Waves Understanding Impulsive and Corrective Waves
We need to review some basics around price movement before moving into the exact mechanics of the Elliott Wave Theory. Each price chart has three basic types of price action phases. Elliott Wave (EW) price patterns are divided into: impulsive, corrective, and consolidation.
Impulsive waves (momentum/motive waves)
An impulsive wave is price movement that initiates progress in one direction, which is called the trend. Price usually moves more distance (in pips) and quicker (less time) when trending. This makes trending moves more appealing for trade setups. The waves are split into 5 impulsive waves with the trend and 3 corrective waves against the trend.
Corrective waves (correction)
Corrective waves are against the trend (price movements that are reactionary in relation to the previous trend-setting move). They essentially attempt to revert or undo the movement that was initiated by the preceding motive wave. Price usually moves less distance (in pips) and slower (more time), although fast corrections can occur as well (zigzags). This makes corrective moves less appealing for trade setups. If the trend is bullish, then the correction of the trend would be bearish. If the trend is bearish, then the correction of the trend would be bullish.
Main Elliott Wave Rules
The Elliott Wave Principle has three core rules. Your wave analysis must match these Elliott Wave rules, otherwise the wave count is incorrect.
1. Wave 2 never retraces more than 100% of wave 1.
2. Wave 3 cannot be the shortest of the three impulse waves, namely waves 1, 3, and 5.
3. Wave 4 does not overlap with the price territory of wave 1, except in the rare case of a diagonal triangle formation.
Elliott waves will keep you trading on the right side of waves and not against the big banks and traders, keep your trading as easy as possible.


For Education Purpose ''Not Fınancıal Advise''The most important resistance is 0,030 , if we dump there then go up I expect 0,0360 first of all, if the resistance diffraction strongly, we can see 0,0282

Trying to explain how I use fibs on BTC chartThis is my attempt to share how I use fibs.
I meant to make it short, but I am a rambler. OOPS!

CONFLUENCE TRADING | YOUR KEY TO ACCURATE ENTRIES 🥇
If you are struggling with the identification of accurate trading entries,
you definitely should try confluence zones .
Note: there are hundreds of variations of confluence elements.
In this example, we will discuss trend lines and fibonnachi.
❗️To identify a confluence zone, the price must follow a trend line
(it should match higher lows if the market is bullish;
it should match lower highs if the market is bearish).
Once the trend line is confirmed by at least two touches and consequent reactions ,
you can look for a confluence zone.
1️⃣Project a trend line and identify the next POTENTIAL touchpoint of the market with a trend line.
2️⃣Take the last impulse in the direction of the trend.
Draw a fib retracement based on it
(swing low to swing high in case if the market is bullish,
swing high to swing low in case if the market is bearish).
3️⃣Take the previous impulse (it must be in the same direction as the initial one).
Draw a fib retracement based on it.
4️⃣Look for a match of retracement levels of the last two impulses and a projected trend line.
In case if two retracement fib.levels & trend line match, you found a confluence point.
5️⃣ Apply it as a safe entry point.
You will get a perfect trend following opportunity.
❤️ Please, support this idea with a like and comment! ❤️
⬇️ Subscribe to my social networks! ⬇️

How To Trade Elliott Waves & ABC Correction WavesElliott wave analysts hold that each individual wave has its own signature or characteristic, which typically reflects psychology of moment . Understanding those personalities is a key to the application of the Wave Principle; they are defined as follows:
Five wave pattern - dominant trend (Bullish):
Wave 1: Wave one is rarely obvious at its inception. When the first wave of a new bull market begins, the fundamental news is almost universally negative.
Wave 2: Wave two corrects wave one, but can never extend beyond the starting point of wave one.
Wave 3: Wave three is usually the largest and most powerful wave in a trend.
Wave 4: Wave four is typically clearly corrective.
Wave 5: Wave five is the final leg in the direction of the dominant trend. The news is almost universally positive and everyone is bullish. Unfortunately, this is when many average retail traders finally buy in, right before the top.
Three wave pattern - corrective trend (Bearish):
Wave A: Corrections are typically harder to identify than impulse moves. In wave A of a bear market, the fundamental news is usually still positive.
Wave B: Prices reverse higher, which many see as a resumption of the now long-gone bull market. Those familiar with classical technical analysis may see the peak as the right shoulder of a head and shoulders reversal pattern.
Wave C: Prices move impulsively lower in five waves. Volume picks up, and by the third leg of wave C, almost everyone realizes that a bear market is firmly entrenched. Wave C is typically at least as large as wave A and often extends to 1.618 times wave A or beyond.
Note: Where is PA on EurCad pair going next week? look at weekly and monthly charts (all time lows)? Making doji or undecided candles? Head & Shoulder pattern? Continue bearish...Are you using Fib retracement tool? golden zone 61.8%. ... or Friday daily doiji- why not trade price action in which ever way breaks this? Good luck.

CONFLUENCE TRADING | YOUR KEY TO ACCURATE ENTRIES 🥇
If you are struggling with the identification of accurate trading entries,
you definitely should try confluence zones .
Note: there are hundreds of variations of confluence elements.
In this example, we will discuss trend lines and fibonnachi.
❗️To identify a confluence zone, the price must follow a trend line
(it should match higher lows if the market is bullish;
it should match lower highs if the market is bearish).
Once the trend line is confirmed by at least two touches and consequent reactions ,
you can look for a confluence zone.
1️⃣Project a trend line and identify the next POTENTIAL touchpoint of the market with a trend line.
2️⃣Take the last impulse in the direction of the trend.
Draw a fib retracement based on it
(swing low to swing high in case if the market is bullish,
swing high to swing low in case if the market is bearish).
3️⃣Take the previous impulse (it must be in the same direction as the initial one).
Draw a fib retracement based on it.
4️⃣Look for a match of retracement levels of the last two impulses and a projected trend line.
In case if two retracement fib.levels & trend line match, you found a confluence point.
5️⃣ Apply it as a safe entry point.
You will get a perfect trend following opportunity.
❤️ Please, support this idea with a like and comment! ❤️
⬇️ Subscribe to my social networks! ⬇️

EW FIBONACCI Ratios, FIB Retracement and Extension application !In this post, I'm going to focus on Fib Retracement and Fib Extension Ratios by Elliott Wave, and show you how to best use these tools.
Fibonacci ratios are mathematical ratios derived from the Fibonacci sequence.The Fibonacci sequence is the work of Leonardo Fibonacci.
Fibonacci sequence is used in many applications, movies and photography, space studies, stock market actions, and many other fields.
Fibonacci is a proven approach for measure price movement relationships. For Elliott heads, it means Fibonacci numbers are tools to help guide us in our interpretation where we think price movements will go.
The most common Fibonacci ratios used in the stock markets are:
1 - 1,272 - 1,618 - 2,618 -3,618- 4.23 (extension)
0.236 - 0.382 - 0.5 - 0.618 - 0.786 (retracement)
Let's start with Elliott Impulsive Wave rules !
Wave 1: the beginning of each wave and retracet with
Wave 2: may never retrace deeper than the beginning of wave 1
Wave 3: often the longest, but never the shortest
Wave 4: may never retrace below the top of wave 1
Wave 5: x
Fibonacci ratios :
Wave 2
The most common retracements we look for in a Wave 2 pullback are either a 0.5 or 0.618 retracement of Wave 1
We expect only 12% of Wave 2 to hold 0,382 retracements of Wave 1
We anticipate 73% of Wave 2 retracements between 0,5 to 0,618
We anticipate 15% of Wave 2 to retrace below the 62%
Wave 3
Wave 3 is related to Wave 1
Fibonacci relationships:
Wave 3 is either
1,618 length of Wave 1
or 2,618 the length of Wave 1
or 4,236 the length of Wave 1
The most common multiples of Wave 1 to Wave 3 are the 1,618 and 2,618
If Wave 3 is extending, we typically look for 4,236 or higher
Only approximately 2% will a Wave 3 be less than Wave 1
We anticipate 15% of Wave 3 trade between 1 and 1,618 of Wave 1
We can anticipate 45% of the time Wave 3 will push to between 1,618 and 1,75
We can anticipate 8% of Wave 3 will extend beyond 2,618 or higher
Wave 4
Wave 4 is related to Wave 3
0,236 of Wave 3 or
0,382 of Wave 3 or
0,50 of Wave 3 or
0,618 of Wave 3
We can anticipate only 15% of the time Wave 4 to retrace between 0,236 to 0,382
We can anticipate 60% of the time Wave 4 to retrace between 0,382 and 0,5
We can anticipate 15% of the time Wave 4 to retrace between 0,5 and 0,618
We can anticipate 10% of the time Wave 4 retrace 0,618 or greater
Wave 5
Wave 5 has two relationships. Wave 5 has a direct correlation to the Fibonacci relationship of Wave 3
1. If Wave 3 is greater than 1.62, or extended
Wave 5 is a 1 to 1
or 1.618 of Wave 1
or 2,618 of Wave 1
I don't know any statistics, but in my experience a 1.618 or 1 to 1 is the most likely
2. If Wave 3 is less than 1,618. Wave 5 will often overextend.The ratio of Wave 5 will be based on the length from the beginning of Wave 1 to the top of Wave 3
Extended Wave 5 is either 0,618 from the beginning of Wave 1 to top of Wave 3
or 1,618
Unfortunately, my english is not so good and I work with google translate, but if you have any questions I will be happy to answer them .
➡️If you like my posts smash the like👍👍 button, comment or follow me. It helps me to publish more free education, also on request ⬅️
Fib retracement and Extension application follow 📚

My new fibonacci levels toolHi crypto traders,
After many years of using Fibonacci retracement, my predictions started to be less relevant since Trading View started allowing to change the fib levels from regular scale to LOG scale. Since then I got confused especially with crypto that many coins 10x easily. So i decided to get my own fib levels tool (feel free to back test it on your own).
Basically, I took the Fibonacci sequence numbers of 21,34,55,89 as my fib levels to watch for retracement. For the number 76, I added fib number, 21, to 55 . Then I ‘ve noticed that between 21 and 34, the difference is the UNLUCKY number 13. Number 13, it is also the difference between 76 and 89. This gave me a confirmation that 76 is an important level to watch even if it is not a fib level.
Hopefully this is helpful for some people out there. From now on, I will be using those levels for my chart analysis.
Stay safe!

Day Trading With Fibonacci Extension (Buy)Set up on USDCAD 15 minute chart with fib retracement extension tool:
1) Right Pair? Yes- USDCAD
2) Right Price? Yes, Enter at 1.20400 with stop at 1.20300 (10 pips)
3) Right Session? Yes, end of London beginning of London/New York session overlap. This is in the highest liquidity and volume times daily of trading Forex, which is from 10 pm to 10 am PST/USD time or from Tokyo end to London end.
4) Right Time? Yes, both USD and CAD are trading during New York session and London/New York overlapping session .
Using a Fib retracement and/or Fib retracement extension is great for setting targets, depending how deep initial retracement or reversal goes back into break out zone.
This set up would have been a great trade: 1:3.5 Risk/Reward setup or (10 pips/35 pips). Have patience and let trade work. You can only control when you enter and exit a trade- rest is up to price action.

Day Trading With Fibonacci Extension (Sell)Example of using Fibonacci Extension to day trade with: EurNzd 15 minute time frame today:
1) Right Pair? Yes, EurNzd during both London and London/New York overlapping sessions. (Both Gbp and Eur pairs are great r/t being in session). Have high liquidity and volume.
2) Right Price? Yes, Enter sell at 1.69500 with stop at 1.16950 (15 pip stop).
3) Right Session? Yes, During London session and London/New York overlapping session.
4) Right Time? Yes, after break out of price action and return back into golden zone (38%-62% area) of Fib. retracement area.
NOTE: Waiting for the initial break of range or sideways price action and return back into the golden zone of Fib. retracement area gives you one of the safest and best risk and reward set ups in day trading Forex. This one was 1: 2 Risk/Reward setup (15 pip risk/stop/30 pip reward/profit).

Fibonacci 101Fibonacci retracements follow a mathematical principle set forth by Leonardo Fibonacci.
To put it simply - each level is a ratio between two other numbers, and there are countless examples of them being respected in the stock market, forex, crypto, commodities - you name it. For this reason, it's an essential tool in the technical trader's toolbox.
There are many uses for this tool:
Finding regions of support or resistance
Helping with stop loss placement
Establishing targets to take profit - especially during price discovery (no existing S/R levels)
Rules of Thumb
While placement of your anchor points is somewhat subjective - a rule of thumb is to stick with glaringly obvious swing points .
Simple is best with this tool - one of the reasons that it works is that other traders (or trading algorithms) are watching the same regions of price as you are. No need to overcomplicate it!
For a bullish retracement (+ targets) - begin your Fibonacci at a swing low, and end it at a swing high.
For a bearish retracement (+ targets) - begin your Fibonacci at a swing high, and end it at a swing low.
Personalizing Your Settings
The way I have my Fibonacci retracement tool configured, it includes some trend-based Fibonacci extensions in the calculations as well. This can be done by opening your Fibonacci settings and adjusting the inputs. The levels I have as inputs are as follows:
0 - This is your starting point
0.236 - The shallowest retracement
0.382 - Shallow retracement
0.5 - While not a Fibonacci number, this is the midpoint of your swing
0.618 - Commonly referred to as the "Golden Pocket" - this is generally a very important region of support/resistance.
0.705 - While not a Fibonacci number, this is the midpoint between the 0.618 and 0.786 - a level that tends to see lots of activity, and is thus included in my settings.
0.786 - This is the deepest retracement before a full retrace.
1 - This is your ending point
-0.27 - While not a Fibonacci number, a very commonly used extension target during price discovery - Target #1.
-0.414 - While not a Fibonacci number, a very commonly used extension target during price discovery - Target #2.
-0.618 - This is your golden ratio - Target #3 during price discovery.
-1 - This is a 100% extension of the distance between your starting & ending point.
etc, etc - you can extend as far as you like!
Where Fibonacci extensions really shine is during price discovery - areas where there are no previous levels of support or resistance (new ATH's).
You can see on this $SPY chart - using our Fib tool on the COVID crash gave us some very accurate upside targets for the subsequent rally into new ATH's.
I hope this introduction to the Fibonacci Retracement tool on TradingView helped you develop a basic understanding of it's applications - make sure to like if you learned something and follow us for more!
Will, OptionsSwing Analyst

UPDATE Retracement Levels Script: Finding Support and ResistanceI have updated my Retracements Level script to alert traders to long term Support and Resistance levels based on 50% Fibonacci levels. I think that this is a simple and highly valuable tool that every trader should have in their toolbox to identify key levels that price may respect.
In this video I go over the many uses:
-Long term levels for Entering and Exiting positions
-Multiple Timeframe Analysis
-Catching Catalyst events like Earnings
-Projecting Support and Resistance far into the future

The 4 Hour/50 Pip Stop StrategyEach week on the 4 hour time frame charts: Monday and/or Tuesday will set the low of high for week's price action. If you can use the Fib. Ret tool and look ahead of current price action will retrace, then you can figure where the golden zone of 38.2% to 61.8% of Fib ret tool is:
Rules:
1) Measure low to high of last move on 4 hour chart.
2) Figure where the golden zone of fib ret tool is or between 38.2% to 61.6%
3) Place stop loss of 50 pips from 61.8% price line dropped down 50 pips- this might go further then 38.2% (by that is okay)
4) Trend for week will mostly start of Tuesday, Wednesday and Thursday- so this is a swing trade for a few days.
5) Targets can be as follows: Set 1st target is 1:1 (50 pips stop/50 pip target): 2nd target is 1:2 (50 pips/100 pips) and 3rd target is 1:3 (50 pips/150 pips)
6) Would discontinue or exit target Thursday or early Friday if Target is not hit and not hold it over weekend, but that is your choice.
Example on chart is: 1:3 Risk Reward of 50 pips stop vs. 150 pip target. (Buy Trade)- opposite can happen on (Sell Trade)
* I consider that a great trade set up and profits for three days of price action. You can always bring stop up as price action goes up, but you need to let trade breathe related to being a 4 hour chart.

How to Draw Fibonacci Channels
Fibonacci Channels are used to determine fibonacci support and resistance levels within an identified trend.
These channels can easily be drawn in both uptrends or downtrends to find potential areas where price action could change.
Uptrend
When drawing a Fibonacci Channel on an uptrend, a clearly identified trend needs to be established with higher lows being created.
To draw the channel, first select the two low points on the trend, and then the high point in-between them.
After the channel is drawn, the Fibonacci levels calculated can be used to help speculate price action by watching these areas as support or resistance.
Downtrend
When drawing a Fibonacci Channel on a downtrend, a clearly identified trend needs to be established with lower highs being created.
To draw the channel, first select the two high points determined by the trend, and then the low point in-between them as shown below.
Do you use Fib Channels?
If so, share your ideas in the comments below!

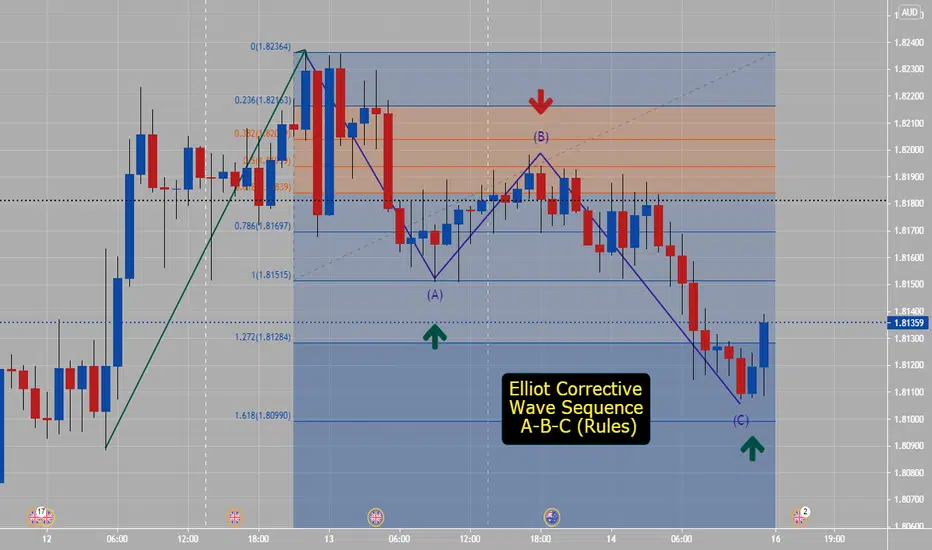
Elliot Correction Wave A-B-C (How To Draw)How to Construct A-B-C wave ?
The corrective wave sequence A-B-C has following Fibonacci rules:
Wave –A this is 0.618 retracement of the prior wave it must be against the prior trend. (Example: Trend was up)
Wave –B this is 0.618 retracement of wave – A and may expand till 1.272 retracement of the wave –A
Way To Get This Levels:
Wave A- To get Fib ret level- go from start of prior trend up(low point to high point on chart)- Price will drop to 0.618 level.
Wave B- To get 0.618 level - Take highest point on chart to bottom of A- price should retrace to Wave B level- this is a sell area which may expand to 1.272 level noted on Fib ret tool over example chart.
Please practice with how to construct 1-2-3-4-5 impulsive waves and how to construct A-B-C- waves on different time charts- if you are a beginner charts over 1 hour will be easier to see and practice on.. Look for entries during high liquidity and volume times of session- or in between end of Tokyo close to London close.
Fibonacci RetracementFibonacci Retracement is the only instrument that,
sometimes, I use in my graphs. To draw it correctly,
you must draw it from the lower point to the higher
one of the movement that you are analyzing. Once
the price reaches the 0.5 zone, you can place your
entry. Many like also the 0.61 level, you can add it
from the settings.

Using the Fibonacci Retracement ToolFirst, let’s start from what exactly the Fibonacci Sequence is: F(n+1)=Fn+ F(n-1). Now this may look scary to some of you, and you may be having flashbacks to high school math, but all this equation simply means is that the next number is the sum of the previous two numbers. So 0+1 = 1, 1+1=2, 2+1=3, 3+2=5, etc.
Here is a simple table for the first few numbers:
0-1-2-3-4-5-6-7
1-1-2-3-5-8-13-21
When we move along the Fibonacci sequence, the ratio of any number and the one preceding it is 1.618 (34/21, 144/89, 987/610, etc.). This is called the ‘Golden Ratio’ or ‘Phi’
Additionally, there are other important ratios related to the Golden Ratio. These are:
• .236 – Any number divided by the number three places ahead
• .382 – Any number divided by the number two places ahead
• .5 – Not really a Fibonacci ratio, but a useful one all the same
• .618 – Any number divided by the number one places ahead
• .786 – The square root of .618
These ratios are the ones used in a Fibonacci Retracement.
What time frame should I use?
As with everything in Crypto, it depends. If you are swing trading, buying and holding for 2-4 weeks, then I’d recommend you look at a period of 1-3 months. Of course, over this time period, your crypto should be trending up if you want to go long.
You can even use the Fib Retracement tool if you want to be a diamond handed HODLer. Using this tool to spot lows so that you can DCA into the crypto is a strategy that will get you better prices than just simply buying in weekly.
So how do we use it? Find the trend
First, we need a clearly defined uptrend. Doing this in a bull market is not terribly difficult. It is a bit harder in a bear market, but it can still be done. An uptrend is when we have a set period of time where we are making higher highs and higher lows. You can see this by placing trend lines on the chart.
Sometimes the candles will wick, or even close, outside the trend lines. This is not a big deal as the trend lines are there to establish the current momentum.
In general, it is better to trade WITH the momentum of the market instead of against it.
Higher highs and higher lows define the uptrend.
That’s great, but how does it make me gains?
The best thing that this tool does is give you a good entry point on a crypto that is trending up; an antidote to the poison of buying the peaks.
You will lose money if you do this. I repeat. Do not buy at the peak.
As we know, prices do not go up in a linear way. They go up and come back down, then back up, etc. Fib Retracements are the tool that helps find that new bottom.
Another way to phrase this is that the ratios that we discussed earlier can be used to find both support and resistance.
Drawing a Fibonacci Retracement is simple on a platform like Trading View. Just click the button that says ‘Fib Retracement’ and draw from the lowest low all the way to the highest high. Flip this if you are looking to short.
To make this chart look a lot nicer just click the gear that appears when the Fib Retracement is selected.
Then select ‘Extend Lines Right'
Viola!
As is shown on the chart the price of ETH bounced on the .618 and repeatedly on the .5 level. These would be excellent times to buy.
So, if you got your hopes up and jumped too in to early, you would have seen a fairly large pullback. Many people would sell at this point because they are scared that their crypto will crash. However, the Fib Extension shows the likely levels of support.
The savvy investor, you, will not even enter until this pull back has happened. It is impossible to exactly time the bottom. The Fib Extension can help use get closer with more accuracy.
Final thoughts
No single tool is going to lead you to the moon. It is important to know that having a successful investing strategy requires you to use this tool in conjunction with others. This is just one important piece of the overall puzzle.
If you found this useful, please like, comment, and follow! Thank you!

ETH weekly chart using silver ratio retracements & 0.4142Most of this is explaining why I like the silver ratio: 1+sqrt(2), or 1.4142. It may be a sort of analysis of ETH, but mostly I want to explain why I found the 0.4142 fib chart level so compelling as soon as I started using it (I tried several values and that one INSTANTLY had results, where all the others failed).
I was working on this when I saw the front page idea* with my fib chart retrace values! (note: i had to abandon my other account since this had my number attached so I could buy being able to look at two charts at once... x.x. so i am starting fresh, but I have been using sqrt(2) as a fib level since I was trying to figure out my own tweaks on the formulas. In fact, 1.4142 and 0.4142 are WEIRDLY good as fib levels. They are more accurate than 38.6. Because it's sqrt(2), it also fits nicely into the overall template of a fib chart that is mostly focused around ensuring the levels are being respected in general, so that once applied further, the same levels can be predicted in the same manner. I'm not being annoyed about that I would love to see 1.4142 used more often in fib charts; it's just a fantastic level. It's also related to a more complicated topic, enumerative combinatronics, which is quantifying possible patterns... which is perfect for pattern-heavy price action!
I initially was not very confident in TA. There are so many different techniques and it is very hard to figure out which are hopeful guesswork and which have an objective relation to the price. Learning incorrectly early on also harmed me, but it was an important lesson to learn. I am not a maths major so my explanations here are pretty minor.
www.youtube.com
Here's a numberphile video about the silver ratio.
sqrt(2) is a Pell number. More formally, {delta} = {delta}S = 1 + sqrt(2). I wish TV wouldn't get mad at me for using math symbols and think I'm not writing in English but okay tradingview.
If you were to replace the fib numbers and make a Pell chart instead, it would look like this:
nevermind I made it and it was terrible so I scrapped that idea. I will need to mess with the pell series more because that many irrational numbers (19601+13860sqrt(2) = 39201.99997... ok)
puu.sh Silver rectangle (as opposed to the so-called ~perfect~ Fibonacci ratio rectangles, I find this one to be more respectable!!)
I'm still pretty new and only have a few months with very scattered education regarding these topics so most of it ended up being pragmatically learned and backtested. It seems to work so well that I second guess myself so often I end up making bad trades while it just follows my prediction almost precisely. I just use the retracement because the actual uses are sorta irrelevant to me as long as the ratios and levels I want are on the chart in the way I want them to consistently be used for my own purposes.
What's that? I can toss this set of retracement levels and it just manages to fit better than the defaults with zero fitting required! usually
Indeed, 0.2 and 0.4142 were probably my favorite discoveries in January when I was experimenting with different mathematics. A runner up is 0.8, only because it usually nests the dip after the 1 (100% value) is reached. As a trading style, the point is to buy in either for a short term trade between 0 and 0.2 and then sell at the silver level (0.4142), or, anything below the silver level is a buy zone, and 0.618 would be the sell point if there is a "projected" chart, which I like doing. It is, and always will be, weirdly accurate in predicting reversals, but never when, only the price. When is the hard part to me.
puu.sh
example, this is my bitcoin chart from my prediction in march and then now. I was expecting this sort of move but getting it to the exact day and recognizing that last flash crash before it happened (because it was repeating a previous impulse, so is probably some fundamentals I don't know about, whether it's monthly miner sales or just... taxes or whatever).
So using presumptions of the asset's usual impulse distances (since, well, the same people are buying and selling, and unless the price changes significantly, the movement in prices tends to always be correlated to previous movements, with the exception of mean reversion inevitability if it's on a wrong side of an MA or vwap or something. Basically, trading probability and the averages. So far it was worked well as long as there is no flash power outage in China that messes everything up. But even then it seems to be priced into the chart levels.
My next study is to see if I can integrate Elliot wave theory and these levels into a combined impulse prediction tool that I can use for myself objectively so I can stay in a trade with more confidence. Mostly, I gotta stay off the 15m chart.. lol.
Likely fallacy pitfall explanations for the retracement fit:
1. seeing patterns where there are lots of possibilities for patterns to be formed; of course, everyone ends up ignoring the values that are not met or are blown past, since they fail to create any support or resistance. I like to use these levels that are previously unused to predict where a channel may form, because an unused channel is more appealing to price action than a used one, given the volatility a used one entails with so many orders and predictions being made for the same ones.
.4142 and .2 and .8 are all slightly off of the fib levels. They are just off enough that instead of being overlapped, they skirt the level. This looks and is a lot cleaner on the chart, but may well just be seeing what one wants to see in how important the levels are. This is why I chose to focus on the 0.4142 level so heavily. It falls just short of the halfway mark (a very important value in probability given it is the median of the range I am trying to predict), which more or less confirms a halfway point. If the trend is very bullish, you can use the 0.4142 level as the guideline to try and predict where the 1 value will end up in the future.
I spent some time adding some more predictions and using those levels as examples of their utility in future price projection, as well as how well it can backtest.
Here is a step-by-step in how I do this for a quick guesstimate of bullish impulse prices that I find a bit more adaptable than simply the golden ratio fetish, and unsurprisingly, other such irrational numbers work well when used for different purposes.
BTC
s3.tradingview.com 1
s3.tradingview.com 2
s3.tradingview.com 3
AAPL:
s3.tradingview.com ~base
~adjusted
~result
The final thing I have to say and want to express is that it's fantastic to learn how all these things work in the book, but the book doesn't matter if you don't have your own understanding and conceptual view of the technique you or I am using. Most of all, it should make sense to you, even if it doesn't make sense to anyone else. I've come to appreciate that with charting and the great variety of ideas and methods used by everyone, closer or further from the standard. It's worth noting the standards didn't have a high success rate anyway when tested in a vacuum; but this methodology is less for efficient autotrading, and more for having a plan and reasons for entering or exiting trades at certain points.
The most important element of charting, that I've come to identify, is that it cements the plan into a reference work that when changed becomes useless, so the plan must be stuck to unless price itself defies expectations beyond parameters.
Thank you! I'm happy to be able to shove this all in an article finally and sort of start to work out my ideas, as I have very little concrete documentation on it yet, as frankly it's still in the growing pains stages as I am but a bab in TA.
Sofie
*https://www.tradingview.com/chart/AMC/zjtSxXED-Using-the-Trend-Based-Fib-Extension-Tool/
My examples focus on an uptrend.

Using the Trend-Based Fib Extension ToolThe Fibonacci ratios are widely used among traders to help identify potential areas of reversal in the movement of price action.
The Trend-based Fibonacci Extension tool utilizes three points on a previously identified trend in order to draw the Fib ratios on the chart.
In the chart above, price was rejected twice at the ~$35.50 level, forming a double top which is a fairly strong reversal pattern. To help identify potential areas of support and resistance we have drawn a Trend-Based Fib Extension.
Using the double top patterns High, Low, and High as the three points for the Trend-Based Fib Extension, the Fibonacci ratios are drawn on the chart.
In this example, you can see that price action respected these levels very well until finding strong support at a potential bottom that corresponds with the 200% extension level.
But, notice the region in the yellow box on this chart. There seems to be no identified areas where the Fibonacci ratios show support or resistance.
While retrospectively we can tell that the area of support found at ~ $12 (141.4%) in mid-November 2017 did not produce a new bull market. At the time there was a potential reversal at that region resulting in higher highs and therefore we could have pulled a NEW Trend-Based Fib Extension as shown below.
As the new Trend-Based Fib Extension is identifying areas of a new uptrend, we see that these ares are shown in a way that they were not in the previously drawn Trend-Based Fib Extension.
However, price was rejected at the 61.8% level and continued downward until the 0% extension level was broken, thus invalidating this Trend-Based Fib Extension.
While the upward price trend did not continue, there was a local high that was made and thus could be utilized to create another Trend-Based Fib Extension to further identify areas of reversal for the continuing downtrend as shown below.
Looking at this newly created Trend-Based Fib Extension, we see that the areas moving down to the 78.6% extension level are very well respected, at which time the price found support, creating a triple bottom reversal pattern.
It is interesting to note that the 78.6% extension on this Trend-Based Fib Extension pull is at $1.82, and the 200% extension level from our first Trend-Based Fib Extension pull was at $1.95, a mere $0.13 difference in price.
This area where the two levels of a Trend-Based Fib Extension or Retracement group together is know as a Fib cluster and indicates areas of strong support or resistance.
With price forming a triple bottom and reversing from this level, is it possible that this is the bottom of the downtrend?
Could a new Trend-Based Fib Extension now be pulled from a new Low/High/Low to identify potential areas of support and resistance?
Give it a try and see what you find!
