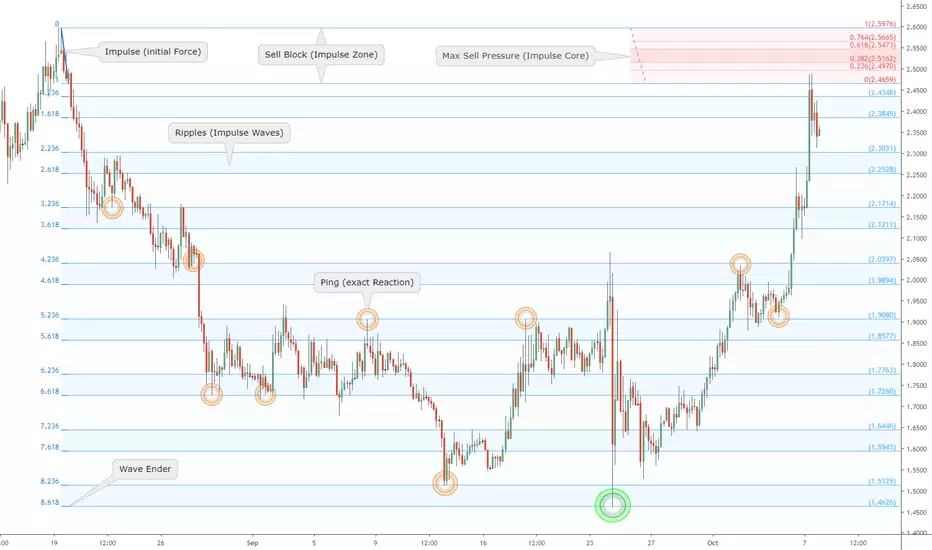
"Pulse" of an asset times Fibonacci: BTC sprang to Impulse Redux"Impulse" is a surge that creates "Ripples", like a pebble into water.
"Impulse Redux" is returning of wave to the original source of energy.
"Impulse Core" is the zone of maximum energy, in the Golden Pocket.
Are the sellers still there? Enough to absorb the buying power?
Reaction at Impulse is worth observing closely to gauge energy.
Rejection is expected on at least first approach if not several.
This is part my ongoing series to collect examples of my Methodology.
.
Ordered Chaos
every Wave is born from Impulse, like a Pebble into Water.
every Pebble bears its own Ripples, gilded of Ratio Golden.
every Ripple behaves as its forerunner, setting the Pulse.
each line Gains its Gravity .
each line Tried and Tested.
each line Poised to Reflect.
every Asset Class behaves this way.
every Time Frame displays its ripples.
every Brain Chord rings these rhythms.
He who Understands will be Humble.
He who Grasps will observe the Order.
He who Ignores will behold only Chaos.
Ordered Chaos
.
.
want to Learn a little More?
can you Spend a few Moments?
click the Links under Related.
Fibonacci


Matic network with possible 50% gain on SWINGThis is a quick update analysis about some of altcoins which have a good potential to grow and produce a possible huge profit in the near future. Let's do the technical analysis.
History is repeating itself is the most suitable quotes on MATIC here. we can see a similar pattern with previous structure in this huge up trend channel. we see a failure descending triangle which it broke to the upside. And in this current move, there is a possibility of it to repeating this previous pattern. A series of higher high and higher low can be a good reason for me to enter this trade.
If the price breaks out of the upper line of the triangle, I will enter the position and targeting the upper line of the huge up trend channel. 2 potential target that have the alignment with the previous price action is at around 230 and 270.
Watch out and let's be rich together.
"Pulse" of an asset times Fibonacci: LINK at key Impulse RedixAs you know, LINK has been the strongest Alt coin by far.
Now at a key resistance, a break would unlock new highs.
Expect some rejections, observe where it pulls back to.
"Impulse" is a surge that creates "Ripples", like a pebble into water.
"Impulse Redux" is returning of wave to the original source of energy.
"Impulse Core" is the zone of maximum energy, in the Golden Pocket.
Are the sellers still there? Enough to absorb the buying power?
Reaction at Impulse is worth observing closely to gauge energy.
Rejection is expected on at least first approach if not several.
This is part my ongoing series to collect examples of my Methodology.
.
.
Ordered Chaos
every Wave is born from Impulse, like a Pebble into Water.
every Pebble bears its own Ripples, gilded of Ratio Golden.
every Ripple behaves as its forerunner, setting the Pulse.
each line Gains its Gravity .
each line Tried and Tested.
each line Poised to Reflect.
every Asset Class behaves this way.
every Time Frame displays its ripples.
every Brain Chord rings these rhythms.
He who Understands will be Humble.
He who Grasps will observe the Order.
He who Ignores will behold only Chaos.
Ordered Chaos
.
.
want to Learn a little More?
can you Spend a few Moments?
click the Links under Related.

Chiliz - Golden Pocket - FibonacciHere's a quick post about this cool Golden Pocket on Chiliz - Tether :D

Bitcoin : Short term view and review of yesterday's analysisHello fellas, How are you doing today? I hope you are doing great. Let's get to the point!
If you have seen my yesterday's video analysis about bitcoin in short term and long term view (and if you haven't seen it, kindly see it on this link youtu.be ), you will be very familiar with some of this key levels drawn on the chart. After the action of breaking out of the green dotted trend resistance trend line with an absolute candle closure on 4 hours chart and a pretty good volume. But, once again I want to remind you that even at the most bullish market, it will still need the correction even at the smallest degree of the wave. That's why I try to make a relation with a possible elliot wave count on lower this 3 hours time frame.
Orange zone is the golden pocket zone which I believe that it is the strongest resistance zone for short term basis. The green zone will become the strong support because it is simply the 50% of fibonacci level and it has a confluence with previous price action as key level.
For short term, I firmly believe that bitcoin will touch the orange zone at least and the maximum retracement that could occur will be on the green zone as the key level. As long as the 4th wave hasn't move down to the territory of the top of the wave 1 (Not more than a wick), This scenario will be still active. My bias is remain the same, short term is bullish, but for long term we could see a horrible bearish scenario.
Thank you

Potential Elliot Wave ObservationCOT Report shows a majority of non commercial short positions being removed which may help add more volatility and it may consolidate downward.


"Pulse" of an asset times Fibonacci: Ether at dire Impulse Redux"Impulse" is a surge that creates "Ripples", like a pebble into water.
"Impulse Redux" is returning of wave to the original source of energy.
"Impulse Core" is the zone of maximum energy, in the Golden Pocket.
Are the buyers still there? Enough to absorb the selling power?
Reaction at Impulse is worth observing closely to gauge energy.
Rejection is expected on at least first approach if not several.
This is part my ongoing series to collect examples of my Methodology.
.
.
Ordered Chaos
every Wave is born from Impulse, like a Pebble into Water.
every Pebble bears its own Ripples, gilded of Ratio Golden.
every Ripple behaves as its forerunner, setting the Pulse.
each line Gains its Gravity .
each line Tried and Tested.
each line Poised to Reflect.
every Asset Class behaves this way.
every Time Frame displays its ripples.
every Brain Chord rings these rhythms.
He who Understands will be Humble.
He who Grasps will observe the Order.
He who Ignores will behold only Chaos.
Ordered Chaos
.
.
.
want to Learn a little More?
can you Spend a few Moments?
click the Links under Related.

BTC : View in short term.Hello Fellas, welcome back with another update from bitcoin. This analysis is gonna be worth it for all of you guys, I guarantee it. Just like usual, I use the bitfinex bitcoin's price and once again, I remind you that this analysis doesn't include the buy or sell strategy. This analysis is for educational purpose and Just want to share you my view about this market. And let's jump to this analysis.
Looking at the chart, I have to admit that it is a little bit messy with a lot of lines and boxes drawn. But, believe me that this image is the most simple ways to represent my view. Based on the chart, I want to give 3 highlighted factors that might give an important movement.
The first highlighted region is the blue box which show us that the price has already bounced after it touched this region which moves align with the 78.6% fibonacci retracement. So far, the price has respected this region and this region has the possibility to become major once it has the ability to hold the price.
The second highlighted region is the yellow resistance trend line, this could be a shadow trend line at short term which act as a resistance trend line from short term moves. A confirmation of breaking out this region, could lead the price to test again the 8700$ region which act as a major resistance for short term.
The third highlighted region is the green support trend line which become the major support trend line for bitcoin that has held the price since November 2018. However, the price is still trending slightly above this major support trend line. Break down below this trend line, will lead the price to the next support region stated.
The 4th and 5th highlighted region is the white region which move align with the previous swing low as the 1st support and which is moving align with the 1.618 fib retracement as the 2nd support.
Watch and be wise.

"Pulse" of an asset times Fibonacci: ZRX strong at Impulse ReduxZRX is now at Impulse Redux, the ultimate test of strength.
"Impulse" is a surge that creates "Ripples", like a pebble into water.
"Impulse Redux" is returning of wave to the original source of energy.
"Impulse Core" is the zone of maximum energy, in the Golden Pocket.
Are the sellers still there? Enough to absorb the buying power?
Reaction at Impulse is worth observing closely to gauge energy.
Rejection is expected on at least first approach if not several.
This is part my ongoing series to collect examples of my Methodology.
.
.
Ordered Chaos
every Wave is born from Impulse, like a Pebble into Water.
every Pebble bears its own Ripples, gilded of Ratio Golden.
every Ripple behaves as its forerunner, setting the Pulse.
each line Gains its Gravity .
each line Tried and Tested.
each line Poised to Reflect.
every Asset Class behaves this way.
every Time Frame displays its ripples.
every Brain Chord rings these rhythms.
He who Understands will be Humble.
He who Grasps will observe the Order.
He who Ignores will behold only Chaos.
Ordered Chaos
.
.
.
want to Learn a little More?
can you Spend a few Moments?
click the Links under Related.

Elliott Wave Patterns & Fibonacci Relationships Reference GuideElliott Wave Theory attempts to identify recurring price movements within financial markets and to classify them into a set of meaningful patterns, which can become a reliable tool for future price predictions. The underlying principle is that price-action unfolds via an endless alternation between trending and corrective cycles, while producing this effect on any relative timescale (Fractality) .
Elliott Wave (EW) price patterns are divided into motive waves (i.e. price movements that initiate progress in one direction and therefore create trend) and corrective waves (i.e. price movements that are reactionary in relation to the previous trend-setting move) . Corrective waves essentially attempt to revert or undo the movement that was initiated by the preceding motive wave.
How to use this guide
This EW reference guide provides an idealized drawing for each EW pattern, including a visualization of the most important internal wave size relationships. The images highlight the most common wave retracement and extension targets in red, followed by the next most common targets in orange, followed by the least common targets in grey.
Important Concepts To Remember Before Applying EW Counts
Wave Degrees
Elliott Waves are labeled in different degrees that are nested within each other due to the fractal nature of price movements. Please refer to your Elliott Wave drawing software for the appropriate names and symbols used for each officially defined degree. Alternatively, you may simply label different degrees with different-colored labels on your chart.
Alternation (“expect a difference in the next expression of a similar pattern”) :
EW patterns have the tendency to create alternation within them. This is reflective of nature’s general propensity towards dynamic balance. Following is a list of the main occurrences of alternation:
Alternation of corrective waves:
If wave 2 is sharp (i.e. zigzag or extended zigzag) and deep (i.e. deep in the sense of how much it retraces the preceding wave 1), then wave 4 will most likely going to be sideways (flat, combination, or triangle) and shallow relative to wave 3. The same applies in reverse but is less common. This is because triangles (which only appear during wave 4 inside a motive wave) are considered to be alternating to all other corrective patterns. That means even if wave 2 is a shallow sideways correction, a triangle can still appear in wave 4, but it is less likely.
Alternation also occurs in terms of wave complexity. If a potential bigger complex correction starts out simple at first, then expect complexity to increase during the following parts of the correction (i.e. simple-complex-most complex). The reverse can also apply (i.e. most complex-complex simple) but it is more rare.
Alternation of motive waves :
If wave 1 is short, then wave 3 is likely to be extended, and wave 5 likely to be short again. If wave 1 is extended, then wave 3 and 5 are most likely not extended. If neither wave 1 nor wave 3 is extended, then wave 5 probably will be extended. If wave 3 is extremely long and overstretched, wave is 5 more in danger of being truncated.
Balanced Proportions (“The Right Look”) :
It is important that waves within a 5-wave or 3-wave sequence show reasonably balanced proportions to each other… not just in terms of size/magnitude (which can generally be verified by Fibonacci retracement and extension ratios), but also in terms of time duration . This balancing can occur either via alternation and/or via equality.
Consider the following as an example for ‘balance through alternation’ : an impulse is showing a classic deep and short-lived wave 2, plus a shallow but time-lengthy wave 4. The time-lengthiness of wave 4 is in balance with the depth of wave 2, while the shallowness of wave 4 is in balance with the short-lived nature of wave 2, thereby creating balance through alternation.
The same need for balance applies for any motive waves within a 5-wave sequence (i.e. 1,3, and 5). The exception however will be the potentially extended wave within the sequence. It can/will be much larger in terms of magnitude and time than the other four waves, but the sub-waves (inside the extended wave) must show a balance to each other. The extended wave will also express relatedness to the other waves of the sequence by the angle of the overall price movement (that’s why impulsive motive waves travel quite neatly within parallel channel lines most of the time, even if one of the waves is extended).
Consider the following as an example for ‘balance through equality AND alternation’ . Wave 1 and 5 of an impulse sequence are equal in size and duration (equality), while wave 3 is extended (alternation to waves 1 and 5).
Alarm bells should be going off when a potential wave 4 is starting to grow out of proportion in terms of size and duration relative to the other waves of the same degree.
It is dangerous to disregard the factor of balanced proportions during wave counting. Disproportionate and misshapen patterns should be seriously questioned.
The ‘right look’ may not be evident at all degrees of trend simultaneously, so it is best to focus on the degrees that are the clearest.


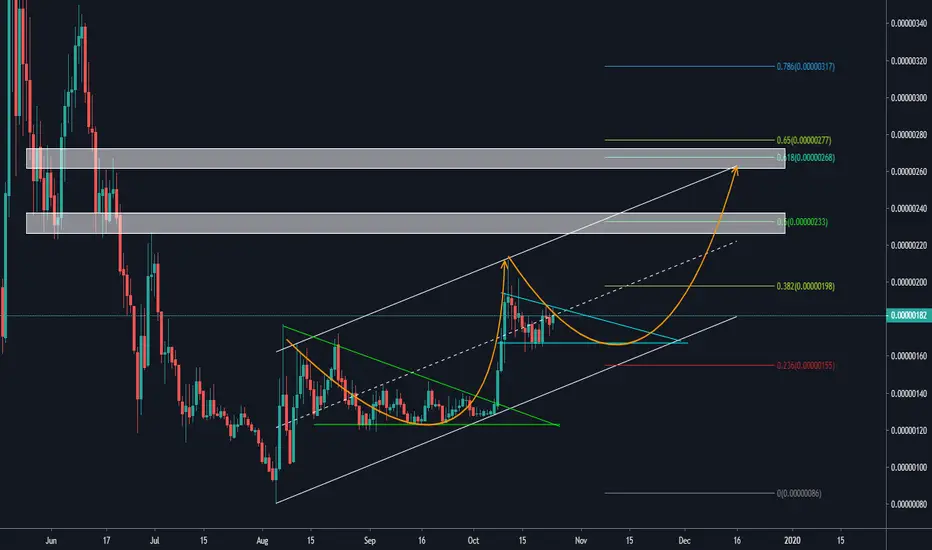
"Pulse" of an asset times Fibonacci: XRP at Dual Impulse Redux"Impulse" is a surge that creates "Ripples", like a pebble into water.
"Impulse Redux" is returning of wave to the original source of energy.
"Impulse Core" is the zone of maximum energy, in the Golden Pocket.
Are the sellers still there? Enough to absorb the buying power?
Reaction at Impulse is worth observing closely to gauge energy.
Rejection is expected on at least first approach if not several.
In this example we have two Impulses.
First wave started by Bulls taking Profit .
Second wave is by Bears opening Shorts .
Impulses and Ripples occur in all assets in all time frames.
These are also called "Order Blocks" or "Supply Zones" by others.
The Impulse and its Core help map the resistance area precisely.
This is part my ongoing series to collect examples of my Methodology.
.
.
Ordered Chaos
every Wave is born from Impulse, like a Pebble into Water.
every Pebble bears its own Ripples, gilded of Ratio Golden.
every Ripple behaves as its forerunner, setting the Pulse.
each line Gains its Gravity .
each line Tried and Tested.
each line Poised to Reflect.
every Asset Class behaves this way.
every Time Frame displays its ripples.
every Brain Chord rings these rhythms.
He who Understands will be Humble.
He who Grasps will observe the Order.
He who Ignores will behold only Chaos.
Ordered Chaos
.
.
.
want to Learn a little More?
can you Spend a few Moments?
click the Links under Related.
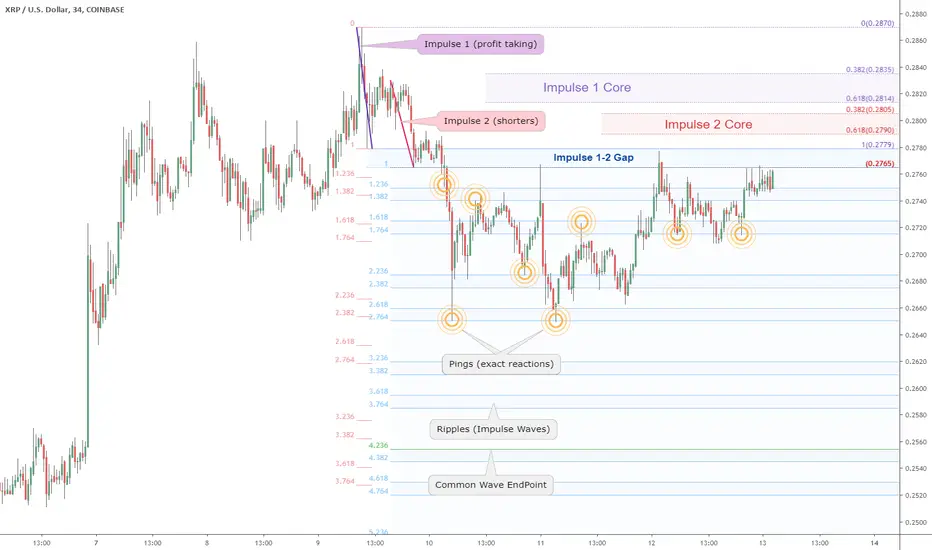
The "Pulse" of an asset times Fibonacci: Gold Gallops off 9.618Part of my ongoing study of Fibonacci Extensions and their relevance to all Assets.
The 9.618 is a particularly interesting extension, quite often the ender of Moves.
Confidence in this plot can be measured by the number of EXACT hits on fib ratios.
This is an example from "Chapter 3" of my series (click) .
.
Ordered Chaos
every Wave is born from Impulse, like a Pebble into Water.
every Pebble bears its own Ripples, gilded of Ratio Golden.
every Ripple behaves as its forerunner, setting the Pulse.
each line Gains its Gravity .
each line Tried and Tested.
each line Poised to Reflect.
every Asset Class behaves this way.
every Time Frame displays its ripples.
every Brain Chord rings these rhythms.
He who Understands will be Humble.
He who Grasps will observe the Order.
He who Ignores will behold only Chaos.
Ordered Chaos
.
.
.
want to Learn a little More?
can you Spend a few Moments?
click the Links under Related.

The "Pulse" of an asset times Fibonacci: Yen in Sync AgainUJ is moving with Rhythm again.
Yen moves are driven by risk sentiment.
risk Off means a rise in Yen is eminent.
risk On is for the Yen a clear detriment.
Recent moves have had no rhyme but reason.
Some say it is a matter of month and season.
Others say a fear of the upcoming recesssion.
Recent moves have been hard to link.
But this last wave has been well in sync.
Now the lines are acting as one would think.
This is part my ongoing series to collect examples of my Methodology.
.
.
Ordered Chaos
every Wave is born from Impulse, like a Pebble into Water.
every Pebble bears its own Ripples, gilded of Ratio Golden.
every Ripple behaves as its forerunner, setting the Pulse.
each line Gains its Gravity .
each line Tried and Tested.
each line Poised to Reflect.
every Asset Class behaves this way.
every Time Frame displays its ripples.
every Brain Chord rings these rhythms.
He who Understands will be Humble.
He who Grasps will observe the Order.
He who Ignores will behold only Chaos.
Ordered Chaos
.
.
.
want to Learn a little More?
can you Spend a few Moments?
click the Links under Related.

Ordered Chaos: "each line Poised to Reflect" Gold's Golden PathGold on a Golden Path
Much turmoil in the news feeds.
More rate cuts on the docket.
Many fists flying in protest.
Even with such furious Forces.
Even with such opposite odds.
Haven has such proper precision.
.
Ordered Chaos
every Wave is born from Impulse, like a Pebble into Water.
every Pebble bears its own Ripples, gilded of Ratio Golden.
every Ripple behaves as its forerunner, setting the Pulse.
each line Gains its Gravity .
each line Tried and Tested.
each line Poised to Reflect.
every Asset Class behaves this way.
every Time Frame displays its ripples.
every Brain Chord rings these rhythms.
He who Understands will be Humble.
He who Grasps will observe the Order.
He who Ignores will behold only Chaos.
Ordered Chaos
.
.
want to Learn a little More?
can you Spend a few Moments?
click the Links under Related.

4H BTC Waves+ Signal charting, full blindFully blind signal charting followup for Waves+, BTCUSD 4h.
All horizontal lines/signals were plotted with the candlestick chart hidden and not visible. Additionally, this time, all directional trades and exits were determined with the chart hidden.
Additional signal explanation and rationale is detailed in yellow text, annotated on the chart/indicators.
8/10 Trades closed in profit (green checkmark). 2 Trades marked with red X were below 2% profit margin, and are considered a loss unless high leverage is used.
Setup/configuration:
Initial setup with Waves+, DOSC (Derivative Oscillator) with signal line disabled. 1-2 bar delay on signals to provide accurate/realistic demonstration of entries/exits (on bar close).
Waves+ has the LSMA line enabled (dark blue).
Waves+ is a hybrid wavetrend fibbonaci oscillator.
Waves+ components:
Light blue line = Waves line
Dark blue line = LSMA line
Red line = Mmenosyne follower (fib line with medium speed)
Green line = Mmenosyne base (fib line with slow speed)
Shaded yellow zone = Explosion Zone warning (Ehler's Market Thermometer)
Red/green center dots = TTM Squeeze Loose Fire(red), TTM Squeeze Strict Fire (green)
Lower dotted line = 38.2 fib line
Upper dotted line = 61.8 fib line
Lower dashed line = 25 wavetrend limit
Upper dashed line = 75 wavetrend limit
Blue 1/2 height block = suggested TP from short/drop incoming 1-2 bars
Orange 1/2 height block = suggested TP from long
Chart markup:
solid green = buy/long signal
solid red = sell/short signal
dashed red = early sell/short signal
dashed green = early buy/long signal
dashed orange = suggested exit from long signal
dashed blue = suggested exit from short signal
Trades closed in profit/loss, no stops, marked up on chart:
Trade closed in profit = green checkmark
Trade closed at a loss = red X.
Trades that are less than 2% in profit will be considered a loss for scalping unless leverage is used.
Incremental for this blind signal test will be documented below/updated as part of the trade idea/post.

"Pulse" of an asset times Fibonacci: LINK bulls at Impulse Redux"Impulse" is a surge that creates "Ripples", like a pebble into water.
"Impulse Redux" is returning of wave to the original source of energy.
"Impulse Core" is the zone of maximum energy, in the Golden Pocket.
Are the sellers still there? Enough to absorb the buying power?
Reaction at Impulse is worth observing closely to gauge energy.
Rejection is expected on at least first approach if not several.
This is part my ongoing series to collect examples of my Methodology.
.
.
Ordered Chaos
every Wave is born from Impulse, like a Pebble into Water.
every Pebble bears its own Ripples, gilded of Ratio Golden.
every Ripple behaves as its forerunner, setting the Pulse.
each line Gains its Gravity .
each line Tried and Tested.
each line Poised to Reflect.
every Asset Class behaves this way.
every Time Frame displays its ripples.
every Brain Chord rings these rhythms.
He who Understands will be Humble.
He who Grasps will observe the Order.
He who Ignores will behold only Chaos.
Ordered Chaos
.
.
.
want to Learn a little More?
can you Spend a few Moments?
click the Links under Related.
Litecoin bullish patternHey Fellas, feel so interesting with last few days trading result which gives me personally a good gains on some of my coins that I hold. The most profitable coins that I am holding is PPT on Binance and of course for you who have followed my channel, you will realize it as well.
And litecoin here is one of many candidates that I would like to share to you. The first indication that I was very interested is the price bounced as soon as it touched the 78.6 fibonacci retracement area which we know it as a significant levels for some instruments in the last 2 or 3 years. The second indication that I believe you will agree with me and it's very hard to argue in my opinion is the price has formed an ascending type of the triangle which usually end up bullish. Broken out of the horizontal resistance zone will be my entry point for long/buy position.
My nearest target absolutely at the golden pocket zone and then we can target the previous swing high as well.
BTC : Trend line and key levelsHello fellas, Let's we start about the analysis podcast about bitcoin which is very important right now. so, sit tight and read this analysis carefully.
This is the weekly chart. And just like the title of this current article, we will discuss about the key levels and trend line on bitcoin. Let's make trend line at the first topic to discuss in this first paragraph. Connecting the high of the December 27th candle and the high of April 8th candle will produce an extended trend line that is now acting as a support trend line. Like what I've always said, even we have broken out of previous resistance trend line, in the future there will be an action to retest again the previous resistance trend line to become a support and vice versa. Currently, we see it clearly occur on current bitcoin's chart. And what's make it more interesting is the trend line is moving align with the golden pocket zone which act as a support too. With those facts above, we clearly see current support trend line is very significant on current bitcoin's movement.
And to anticipate the wick fishing region, I will give the 78.6% fib level as a perfect label for wick fishing region. This is make sense to me, if we see back at 2017 and 2018 which most of the investment instrument had a bounce right after they corrected the major trend at around 78.6% region. Beside it, if we look back at the historical data, we can easily see the $6000 - $5000 region was a really strong support during the 2018 consolidation market.
On every trade, it is important to anticipate the wick fishing region. because there will be a room for liquidation on short or long before it is going to claim the real major trend.


Break out strategy and The alignment on 200 MA dailyHey hey hey, How are you doing all? I hope you are doing great. Just like usual, bitcoin is very interesting to be analyzed as well. This is because bitcoin becomes the benchmark of all coins, it is simply a mother of all coins! So, let's make this analysis interesting!
In this current analysis, I want to give a special highlight to the red dynamic line which is the 200 Moving Average on daily time frame and I want to remind you again of so many times about my 3 phases of break out strategy. we can simply apply this break out strategy on 2 conditions in this chart. The first one is when the price broke down of the support on 50% fib levels and the 2nd one is when the price broke down of the Dynamic support line on 200 MA and current action is the phase 2 of breaking out strategy based on the 200 MA. Does it make sense?
In my opinion, both conditions on above paragraph are relevant to each other well. beside, we could see current region as a bear trap region that want to liquidate most of the shorts and break up of the 200 moving average that is now moving align with the 23.6 MA can be considered as a resistance in short term.
Even if the price can break out of this resistance, I firmly believe the maximum level to reach is at around the 50% fibonacci retracement (and the wick fishing to the golden pocket can be anticipated). The best action for now is to stay idle and wait for the next price to give more confirmation.
On the short term, here is my possible action :
- breaking up of the 200 MA on daily is my long signals and targeting the 50% fib levels at most
- Rejection of the 200 MA on daily is my short signals and targeting the next lower low pattern on around $7200 region.
