Fibonacci


Bitcoin Update : Elliot wave count, Invalidate previous analysisHello fellas, welcome back to the Sunday night update about bitcoin. Today is the January 5th, 2020 and this is going to be an awesome update for bitcoin for mid term use of trading set up. Here we go.
I have to admit that my previous perspective which said that the B wave has already confirmed could be invalidated when the price breaks the green region around the $7500 region. From my newest perspective and EW count that is very updated, we can see that there is a possibility for bitcoin to form an ABC structure which the B was bottomed at around the golden pocket region which coincides with the previous broken resistance that was become a support as well.
The 3-3-5 structure for the potential ABC corrective wave of the whole bearish structure could be in play with the potential target minimum at 1.1 fib extention around $8000 - $8100 region which once again coincides with the 38.2 fib retracement from bearish impulse wave of higher degree (gray region).
Break out of the green region will be another long entry or you can adjust the long entry when the price touches the yellow region as a pull back that I expect to occur in near future.
What can I say, mid term could be bullish, but for long term we're still under a huge pressure of bearish structure. And what my position for now? a big 0!

Some tipsSome of the way I use 382's ( and other things ); Some of the problems with shorting highs and how I handle it.


Crypto market Sizzling against Ceiling: BreakOut / Dump ImminentQuick Overview of the Major coins and their immediate Resistance zones.
Some are showing signs of breaking out, others are testing boundaries.
All coins orbit Bitcoin, but rallies/dumps often start with an alt coin.
This is a great example of a very useful PAID tool offered by TV.
I have several layouts saved with multiple assets in ONE window.
With 3 monitors, I can view ALL markets: Crypto, Forex. Stocks.
The Multi-Chart layouts are great for a quick glance to read an ENTIRE market.
If one or two assets are doing something DIFFERENT than the rest, drill down.
If ALL of the assets are doing the SAME thing, then trade yours in that direction.
All of the above Zones are from detailed plots linked below under Related Ideas.
.

Pulse of an Asset in Fibonacci: Gold at Crucial Impulse ReduxGold is making strong progress towards $1650 per this plot (click) .
But right now it is approaching the most serious resistance before it.
Not to mention how over extended it is, needing a pullback soon.
"Impulse" is a surge that creates "Ripples", like a pebble into water.
"Impulse Redux" is returning of wave to the original source of energy.
"Impulse Core" is the zone of maximum energy, in the Golden Pocket.
Are the sellers still there? Enough to absorb the buying power?
Reaction at Impulse is worth observing closely to gauge energy.
Rejection is expected on at least first approach if not several.
This is part my ongoing series to collect examples of my Methodology.
.
.
Ordered Chaos
every Wave is born from Impulse, like a Pebble into Water.
every Pebble bears its own Ripples, gilded of Ratio Golden.
every Ripple behaves as its forerunner, setting the Pulse.
each line Gains its Gravity .
each line Tried and Tested.
each line Poised to Reflect.
every Asset Class behaves this way.
every Time Frame displays its ripples.
every Brain Chord rings these rhythms.
He who Understands will be Humble.
He who Grasps will observe the Order.
He who Ignores will behold only Chaos.
Ordered Chaos
.
.
.
want to Learn a little More?
can you Spend a few Moments?
click the Links under Related.

Bitcoin : Confirmation of B, officially lose the minor supportHello fellas, here we go again with the analysis of bitcoin in short term view. Let's make it short and essentials.
First of all, This analysis will continue the previous bitcoin analysis and bias on the short term which is still valid for now and if in my previous analysis, I said that there might be a potential of the price to reach the $9000 region again to complete the B wave structure, It's now become invalid whatsoever. Here in this newest analysis about bitcoin in daily view, I feel that the abc structure has already completed to confirm the B wave in higher degree.
Beside the elliot wave count which is still premature and this count however is very subjective to every trader's bias, I have to find some confluences reasons that might support my current bias for down trend. So, here are some confluence reasons that make me believe that the price is entering the bearish stage again :
1. The price has already broken down the minor support around $7150 region
2. Looking at the histogram on MACD oin daily time frame, we can easily deduce that the bears are in control for now with the histogram forms a lower high structure and the lower moving average is very likely to crosses down the higher period of moving average in MACD.
3. A series of lower low and lower high has already formed and it simply denies my previous bounce bias.
4. Based on higher degree of elliot wave count, there is still 1 more wave that potentially occur during this very complicated correction structure which I will label it as the W wave in higher degree.
5. Looking at the btcusd long positions on bitfinex, we can see that the long is starting to decline in the last few days and will indicate the long squeeze to occur very soon in the future.
In conclusion, I will look for the long entry around the red region between $6000-$6300 considering there is a huge price action activity occur at that area which make this as another strongest support in the mid term.

How To Plan Plan A Trade With Fibonacci Ratio ConfluenceHi Traders, In this video we will look at How To Plan Plan A Trade With Fibonacci Ratio Confluence. Fibonacci ratios are most powerful tools with they are used in right manner. We can use them in all sorts of market conditions and asset classes. Fibonacci confluence creates harmonic patterns and gives us very good reward risk ratio. The best thing is the possibility to pre-plan and quantify a trade with high accuracy.
Please feel free to comment or ask questions. Hit the like button if you found value in this post. Thanks! :)

Trading Consolidation Profitably In Forex Markets With FibonacciTrading Consolidation Profitably In Forex Markets With Fibonacci and Harmonic Patterns (A Fibonacci Confluence Tutorial)
Hi Traders, In this videos we look at how to trade consolidation periods profitable using fibonacci and harmonic patterns. Apart from using support and resistance, trend lines and channels, we can use the power of fibonacci ratios. Best thing about fibonacci ratios is that we can pre-define targets or make a fairly accurate prediction about market's move. We can can quantify trades in advance. Fibonacci is one the main tools that I use in my confluence trading. Fibonacci is the first tool that pick to start my analysis.
Feel free to post your comments or ask questions. Sorry I ran out of time so I will create another part. If you find this useful please Give it a like and share with fellow traders.
Like, Share and Comment.
Thanks

Pulse of an asset in Fibonacci: BTC's 6 points map its LifeTime!Plotted are 3 "Impulses" and their accompanying "Ripples".
Those three Fibs (Impulse Waves) have defined every turn.
Current battle lines are pitched at the base of 3rd Impulse.
Left Chart is Weekly Line graph, based on the Close.h
Right Upper is Daily Heiken Ashi candles for flow.
Right Lower is 4 hour Candles for precise view.
Part of my ongoing series to collect examples of my Methodology.
.
.
Ordered Chaos
every Wave is born from Impulse, like a Pebble into Water.
every Pebble bears its own Ripples, gilded of Ratio Golden.
every Ripple behaves as its forerunner, setting the Pulse.
each line Gains its Gravity.
each line Tried and Tested.
each line Poised to Reflect.
Confluence of 2 is Dependable.
Congruence of 3 is Respectable.
Coincidence of 4 is Worshipable.
every Asset Class behaves this way.
every Time Frame displays its ripples.
every Brain Chord rings these rhythms.
He who Understands will be Humble.
He who Grasps will observe the Order.
He who Ignores will behold only Chaos.
Ordered Chaos
.
.
.
want to Learn a little More?
can you Spend a few Moments?
click the Links under Related.

Elliot wave count update and Bias on long termHello fellas, welcome back to the Sunday update of bitcoin, Just like usual we will explain the chart work about bitcoin and its long term and short term bias. Here in this post, I'll do an elliot wave count in specific.
Looking at the above chart, we can see that there are still a possibility for bitcoin to head up to the upside of the huge down trend channel which I can classified it as the b wave for potential Z wave in higher degree. Although there might be a potential to the upside movement and try to retest the upper line of the channel, I still believe that there are 1 more wave down to the area of confluence support to complete the Z wave.
There are 2 areas of resistance that is becoming my main concern which are at the 38.2 fib retracement which has confluence with the $8000 region as support and the golden pocket zone which has a confluence with the upper line of the downtrend channel.
For short term, there is still potential to push to the upside and for long term, I still see a potential of touching the $5000 region.

How to trade in range/consolidation periodA lot of people asked me what to do in the case when the price is stuck in consolidation.
You can use Fibonacci retracement and create a range (0, 0.25, 0.5, 0.75, 1) and put it from swing low up to swing high. By that, you will create key points where the price will react on during consolidation time.
You can use it on all Timeframes and it does not matter if it is Monthly, Weekly, Daily or minute chart.
As you can see here, price very nicely reacts to each of our levels which we have set up once the range has been established. Also, when the price is stuck in consolidation range you do not want to trade it. Avoid it. You will make many mistakes, rather you should focus on a clear bullish/bearish trend.

An Ongoing Study of Entries/ExitsIf you wish, you may consider following this Trading Idea. Here, I will attempt to focus on doing entry/exit analyses using specific trading strategies/methodologies. This Trading Idea will contain both focused and current chart analyses. My intent is to keep the content as clean, concise, and educational as possible. Please feel welcome to ask questions or contribute suggestions.
Historical Study :
Steve Nison:
- Candlestick analysis
- COP (Change of Polarity) breakout strategy
- Fibonacci Retracements
Tom DeMark:
- TD Sequential analysis
Arrows = Entries/Exits

Pulse of an asset in Fibonacci: LINK at minor Impulse ReduxAfter a market-wide sell off, buyers have stepped in.
ChainLink has had the best gains of most Alts thus far.
Now it is at the Impulse Core of previous wave down.
This is a minor Impulse, but it is an important one to watch.
Rejection would make a lower high and continue downtrend.
Break above to a higher high would get more bulls on board.
"Impulse" is a surge that creates "Ripples", like a pebble into water.
"Impulse Redux" is returning of wave to the original source of energy.
"Impulse Core" is the zone of maximum energy, in the Golden Pocket.
Are the sellers still there? Enough to absorb the buying power?
Reaction at Impulse is worth observing closely to gauge energy.
Rejection is expected on at least first approach if not several.
This is part my ongoing series to collect examples of my Methodology.
.
.
Ordered Chaos
every Wave is born from Impulse, like a Pebble into Water.
every Pebble bears its own Ripples, gilded of Ratio Golden.
every Ripple behaves as its forerunner, setting the Pulse.
each line Gains its Gravity .
each line Tried and Tested.
each line Poised to Reflect.
every Asset Class behaves this way.
every Time Frame displays its ripples.
every Brain Chord rings these rhythms.
He who Understands will be Humble.
He who Grasps will observe the Order.
He who Ignores will behold only Chaos.
Ordered Chaos
.
.
.
want to Learn a little More?
can you Spend a few Moments?
click the Links under Related.

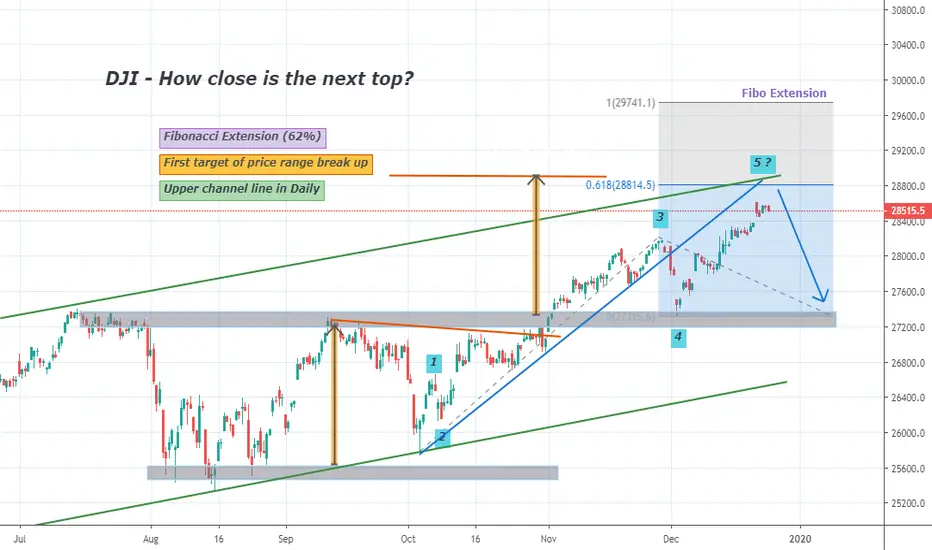
Looking for a top formation in DJI28,700 - 28,900 is a potential top for DJ.
In this range we have:
- The upper daily channel line
- Wave 5 target for Elliot waves
- Fibonacci extension 62%; From a) the beginning of the impulse movement, to b) end of wave 3; to c) end of wave 4
- The first target after previously price range break up; in the form of rectangle price pattern
and finally;
- The broken short-term bullish trend-line could provide resistance in the mentioned range
*This is only how we interpret the market
& Marry Christmas!!
Bitcoin update : Elliot wave and confluence zoneHello fellas, How are you doing today? I hope you're doing great. welcome back with me with today's technical analysis about bitcoin. Yesterday's rally was so beautiful with around 6% surged to the upside. So, let's see where will the price heads in the near future.
Looking at the chart, This is my best elliot wave count for bitcoin. we can see that the 1-2-3-4-5 structure is the impulse wave for A wave in higher degree and on current price, this could be an A structure to complete the B wave in higher degree and therefore, we're looking for C wave structure in higher degree which in my opinion will be another leg down for bitcoin. And I want to remind you that currently the price is still trending on around the WXYXZ corrective pattern since the end of this year's parabolic move since June 2019. and this ABC structure will complete the Z wave to confirm the potential bottom of bitcoin.
There are 2 areas that I consider as a major resistances in this current move for bitcoin. The first area is the confluence zone of the $7800 - $8000 region which has an alignment with previous broken support, 38.2 fib level, and the median line of the down trend channel which I believe will become a big boundary for bitcoin's next rally. And the most bullish scenario that I can see for now is if the price can break out of the 1st confluence zone, I will look at the 2nd confluence zone (around $9000) as the potential top for this move, it's roughly the golden pocket zone and it has the confluence with the end of the 1st impulse subwave in A wave and the upper line of the down trend channel.
However, as long as the price is still trending inside this down trend channel, I won't expect a bullish bias. Breaking out of the upper line of the channel will confirm the next bullish bias in long term.

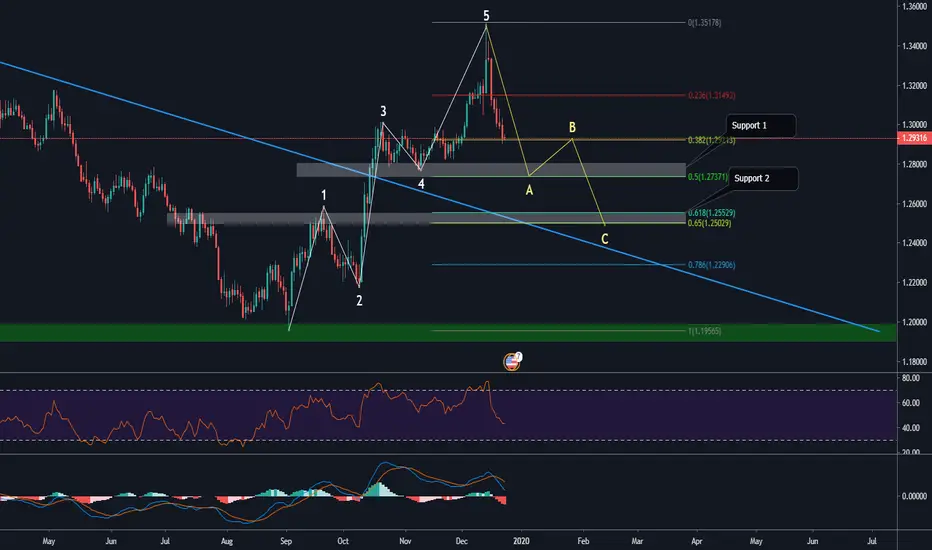
GBPUSD is in corrective phase (multiple time frame analysis)Hello fellas, welcome back to the technical analysis with me and this time I will do the GBP/USD technical analysis starting from daily time frame and lower time frame. we might present you the elliot wave count on this current analysis too.
We have seen the sink of GBP following the descending value of EUR . But, I see this as a cycle and it's a good cycle if we look at higher degree of the price, even if the price is in up trend moves, we need a retracement to represents the sell off and take profit action from the long to keep this market healthy.
Now look at the technical analysis here, we can see that the price has formed an action of breaking out of the blue resistance trend line that is now become a support. And based on my 3 stages strategy of break out, we must aware that after the initial break out, there should be any retest action to the previous broken support or resistance as the 2nd stage and usually this 2nd stage is the correction pattern in higher degree. This guideline has the alignment with the elliot wave count which indicate the 1st impulse wave has finished on this GBPUSD pair. And now we will look for where will the ABC correction move ended. And what the coincide is that the golden pocket zone is having a confluence with the blue resistance trend line that is now become support.