EURJPY Demand Level With FibonacciStrong demand level and a simple pullback before we break through the resistance and continue up
Fibonacci

EURCAD Supply & Demand LevelsHigh volume institutional levels. We can see a short retracement down to fib 0.5% or 0.61% before we continue up with the trend

TA analysis using Fibonacci RetracementAs you can see on this chart, i want to share something interesting.
Today i applied this method also on other counters and most of them show the same results.
As you can see, price already reached fibo retracement level 50-61.8% which i believe many other traders who are using fibo will also noticed this same pattern.
Usually price will take a break from here,in other word retracement will happened once price reached this level.
This method is simple, find the nearest base between fibo retracement 50-61.8%. Sometimes the base could be below/above 61.8%.
Since this is a long term view, intraday traders may not applied.
Just be careful with indices as they are approaching peak value

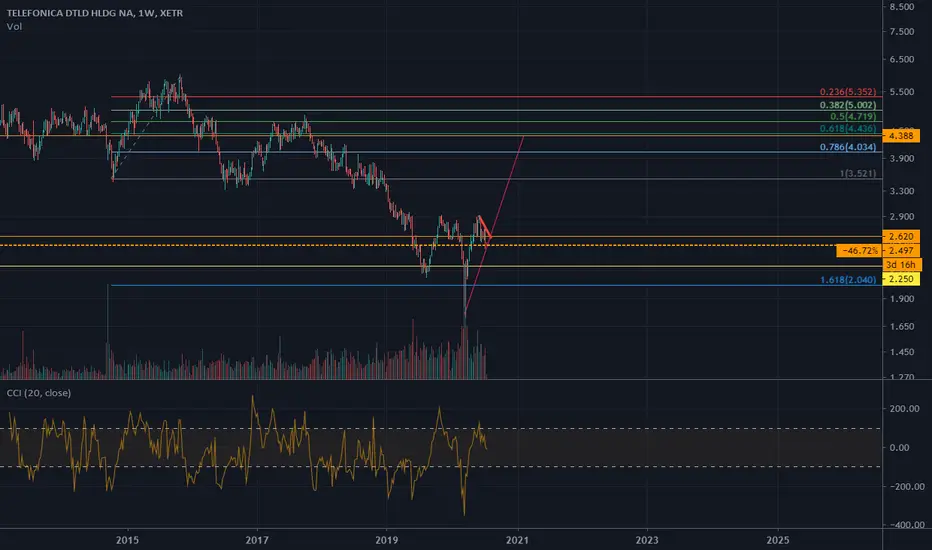
Trendlines, Volume and FibonacciTrendlines are the simplest chart pattern you can find, but they are some of the most widely used, and for good reason.
They highlight a price trend going up, down, or sideways. Which therefore will be used for further analysis and other chart patterns, but what many people don't know are the specifics of trendlines. Firstly, widely-touched trendlines (about a month apart) perform much better than closely-touched trendlines. Trendlines with more touches also perform better than those with fewer. Furthermore, the longer the trendline the better the performance. However, steeper trendlines don't cut - performance usually lacks when trendlines get steeper.
The Gold monthly chart shows a downward channel highlighted by blue trendlines. This channel isn't the best since the breakout doesn't kick in for a couple of years, however, it would have been great for a few swing trades.
Highlighted by the blue notes are regions of high volume at valleys and peaks. Heavy volume at peaks and volumes are good indicators of support and resistance. Represented by the white horizontal lines. However, one important thing to note is that horizontal consolidation regions provide better support and resistance then peaks and valleys.
The HCR is presented by the yellow note and the highest blue note in the chart.
Also shown is the Fibonacci retracement. The Fibonacci retracements of 38%,50%, and 62% are good regions for support and resistance. A stop placement at 67% protects trades 66% of the time.


FAIRCHECM SPECIALILTY - BAT PATTERNFairChem Speciality daily chart has a Bat Pattern Probability
Bat pattern is the most common and frequent pattern among all other harmonic patterns and the best part is,it gives you a better risk: reward ratio.
.886 Fib Retracement of XA leg and 2.618 projections of BC leg , whenever these two ratios aligns in close proximity, it provides a tight zone to execute a trade entry with good risk reward ratio.

EURUSD multi time frame Bollinger band to identify weaknessUsing the multi-time frame bollinger bands here. Set to 1 hour.
Focus your attention to the activity that takes place outside of the bands. Look at the volume. What is SM doing here... PREPARING for a markdown.
SM and skilled traders are always thinking 2-3 moves ahead. If criteria is not met, we ignore it and wait for a favorable set-up.
Avoid trading in the middle of a range. That can be RSI, Bollinger bands, support/resistance.
The true action is always at the edges.
Practice*


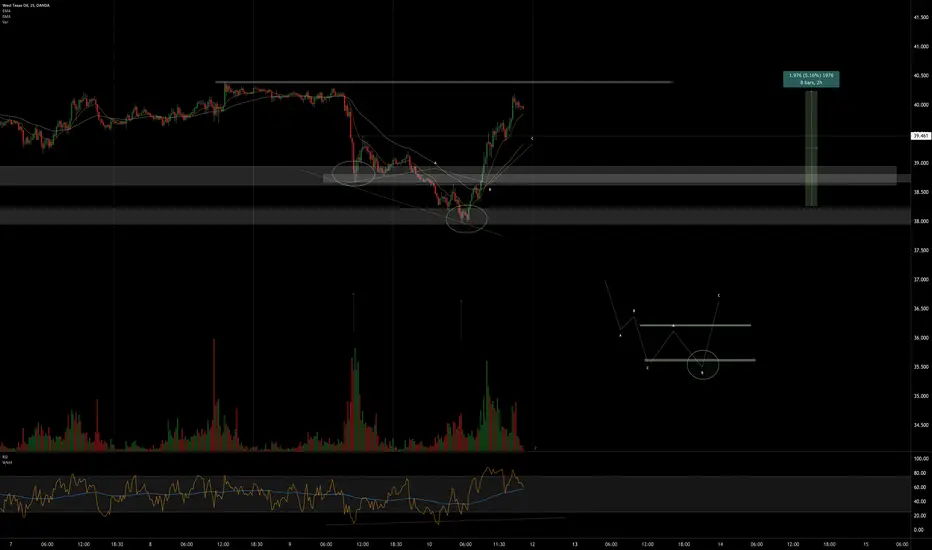
WTICOUSD re-accumulation example 15 min with POS RSI DIVCloser look at the anatomy of that recent mark-up.
Confluence of factors:
Uptrend
strength in the background/evidence of accumulation
RSI oversold
RSI positive Divergence on volume into a key supporrt
You can see the demand to the left. SM stopped buying, allowing price to drift/shaking out remaining weak hands.
Spring below support on slight iincrease in volume
"no-supply" signal near spring
"push-through" entry seen at resistance .
PM with questions.
GOLD (XAUUSD) Structure Analysis & Thoughts
gold is just unstoppable.
the price is growing like crazy this week.
if you missed this movement and plan to jump in, it is too late and very risky atm.
the price is relatively close to our next potential reversal area 1823 - 1833.
this area is based on a resistance line of a rising channel and fib.extension confluence of the last two major daily impulses.
attention! I don't say that we should just blindly short from that area.
always look for a confirmation on a lower time frame to trade against the trend.
moreover, if you want to catch a bull rally, a pullback from the above-mentioned area may let you buy on a discount from the support of the channel.
apply these structure levels based on your strategy and good luck!

Binance Hot list coin July, 8th 2020 : BATUSDT #2Looking at the price, you can see that the price bounced right after it touched the golden pocket zone which is having an alignment with the 200 Moving Average on the 4 hours chart. The price potentially is forming a sign of inverse head and shoulder which usually is very bullish as a reversal pattern from correction. If the price can breaks out of the white resistance trend line as the neckline, there will be a huge spike to the upside in near future.

Binance Hot list coin July, 8th 2020 : XRPUSDT #1A simple deduction of current price action and the chart pattern of ripple. With the structure of bullish falling wedge pattern, there is a possibility of the price to moves up higher and challenge each fib levels especially the golden pocket as a strong resistance. The fact that there is a bullish divergence on RSI and MACD making this structure is very interesting. The key movement is to breaks out of the white resistance trend line and the upper line of this falling wedge.

GBPUSD TP HIT!Trailed my stoploss to this level, if you followed me, could have caught at least 100 pips. Thanks if anyone took it!

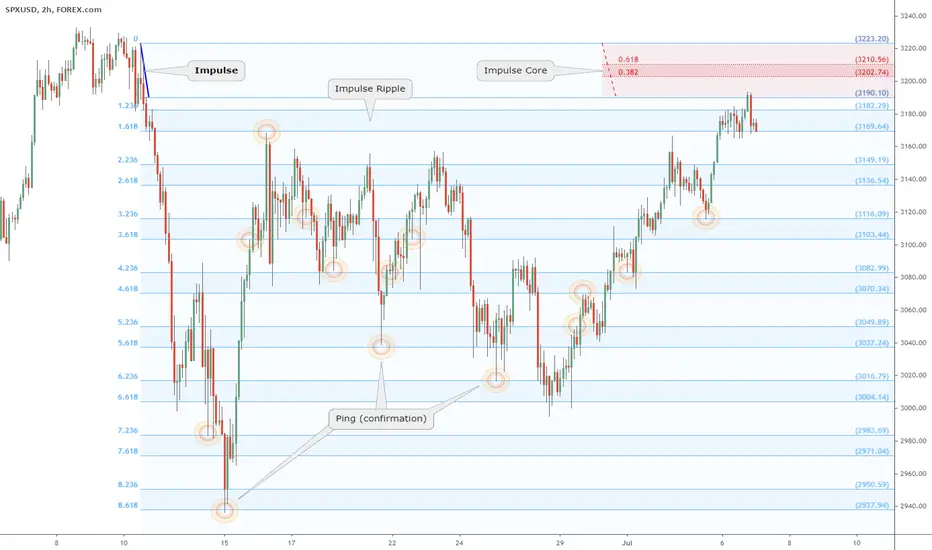
Pulse of an Asset via Fibonacci: SPX at minor Impulse Redux"Impulse" is a surge that creates "Ripples", like a pebble into water.
"Impulse Redux" is returning of wave to the original source of energy.
"Impulse Core" is the zone of maximum energy, in the Golden Pocket.
Are the sellers still there? Enough to absorb the buying power?
Reaction at Impulse is worth observing closely to gauge energy.
Rejection is expected on at least first approach if not several.
Part of my ongoing series to collect examples of my Methodology : (click links below)
Chapter 1: Introduction and numerous Examples
Chapter 2: Detailed views and Wave Analysis
Chapter 3: The Dreaded 9.618: Murderer of Moves
Chapter 4: Impulse Redux: Return to Birth place <= Current Example
Chapter 5: Golden Growth: Parabolic Expansions
Chapter 6: Give me a ping Vasili: one Ping only
.
.
Ordered Chaos
every Wave is born from Impulse,
like a Pebble into Water.
every Pebble bears its own Ripples,
gilded of Ratio Golden.
every Ripple behaves as its forerunner,
setting the Pulse.
each line Gains its Gravity .
each line Tried and Tested.
each line Poised to Reflect.
every Asset Class behaves this way.
every Time Frame displays its ripples.
every Brain Chord rings these rhythms.
He who Understands will be Humble.
He who Grasps will observe the Order.
He who Ignores will behold only Chaos.
Ordered Chaos
.
.
.
want to Learn a little More?
can you Spend a few Moments?
click the Links under Related.
Binance Hot list coin July, 6th 2020 : XTZUSDT #3The price is trending slightly above the white region support. This white region support however is a strong support zone which has confluence with the 200 MA on the daily chart. Another confluence reasons to enter this trade in the upcoming session is that there is a regular bullish divergence if we compare it with the RSI. A lower low price action with the higher low RSI on the oversold region. My entry point will be when the price breaks out of the white resistance trend line on lower degree and targeting the golden pocket zone which is in alignment with the upper line of the channel.

Binance Hot list coin July, 6th 2020 : KNCUSDT #2On the 2 hours chart, the price is trending slightly above the 55 EMA which acts as a strong dynamic support (yellow). Beside that the price is now forming a strong bullish falling wedges. This is however could be the action to complete ABC zig zag correction structure. I will only catch the B wave which align with the golden pocket zone as well before shorting the C wave. Just like usual, open long position when the price breaks out of the upper line of the falling wedges.

Bharat Forge - Perfect Example of .618 Bullish Retracement .618 Fibonacci Retracement
Most Popular Retracement
Important retracement for a stock that is selling off after completing a good Rally.
#BharatForge is a perfect example of .618 Bullish Retracement and its amazing to see how prices rallied after hitting .618 retracement
Trade Consideration ( Refer Chart )
Point #1 : A good rally
Point #2 : A sharp Sell-off
Point #3 : Exhaustion Candle with huge volume at .618 Retracement Support ( First Clue from Pure Price Action )
Point #4 : Hammer/Key Reversal Candle with huge volume at .618 Retracement Support ( Second Clue from Pure Price Action )
Point #5 : Huge Volume at two important Reversal Candles ( Exhaustion followed by Reversal )
Assignment for Learners: Identify .618 Retracement on daily chart and post in the comment section
If you have Any Questions, please feel free to ask in the comment section below
Share for Wider Participation and more much educational posts

Binance Hot list coin July, 4th 2020 : BANDUSDT #3BAND has shown us the sign of lower low on price action but the RSI is gaining strength with the higher low. We can't deny that this is a regular bullish divergence which give an indication that the bears are completely tired and losing some strength.
Breaking out from the blue resistance trend line will leads the price to the .382 fib level (1.35) and potentially can push higher to the golden pocket region (1.62).

The Best Way to Trade Nonfarm Payrolls!The unprecedented world wide Coronavirus pandemic has put the markets on edge and set expectations really low for virtually all financial data points. Considering this, Non Farm Payrolls came in very strong, or at least not as bad as expected. Stocks reacted accordingly, and this tutorial is about how stocks react to strong numbers. This occurs in three phases:
Phase 1: Initial reaction - In the event of a number that the markets perceive as 'strong', stocks will rally accordingly. This usually continues until they hit a Fibonacci level or other technical level, or traders take profits.
Phase 2: Retracement/Squeeze - The rally discussed above usually will continue to around 9:00am or so. Don't forget that NFP comes out at 8:30am which is before the North American open. At this point, futures traders have taken profit, and stock traders are gearing up for the open. Watch the Kovach OBV to make sure that this retracement is not a reversal!
Phase 3: Continuation at open - At 9:30am, the US markets open, and stock traders clamour into trades pushing the markets up again. Stocks could retrace later on in the day, or set the stage for strong growth in the subsequent week.
Hopefully this tutorial can help you set up for some good trades if you see this behavior! If you want to learn more, check us out at Ghostsquawk!

EUR/GBP - Breakout of a strong resistanceHello Traders. I propose an interesting view on the EUR/GBP cross; we are faced with the breaking of a very important resistance around the levels 0.906/0.908 with consequent strength of the bulls aiming at the level of 0.928 corresponding to 0.618 Fibonacci. We are going to put a take profit around 0.92.

Alphabet (GOOGLE) - Grab at Demand & Accumulation ZoneNASDAQ:GOOGL be ready to grab some near demand & rest at accumulation zone.
