CHZUSDT - Looking for a Cup and Handle Formation on this one ...Would love to see BTC hold and play this one out.
Right now is a great buy in time. Looking to see this one play out over a 7 day time frame.
This is an idea, markets dictate direction and price.
Fibonacci

How to Trade Price Action Daily!Hello Fellow Traders, Here is a Educational Video (How to Trade Impulse/Correction/Impulse) .
Key things to Remember:
When Trading This Type Of method - You Should Always have an Open mind when it comes to "Where the Market will Finish The correction"
The Strongest Levels of Fibonacci is the 61.8 & 38.2 (These Are Generally the levels that the Market Loves to Finish its correction)
The Best way to follow This Method is if the following conditions apply.
Conditions -
1. Look & Find a Big Impulse On bigger Timeframes (Weekly, Daily or 4Hours)
2. Wait for The Market to Finish its Impulse (You will notice the market starts to move the opposite direction to the original Impulse)
3. Pull Your Fibonacci From The Start Of the Impulse to the End of the Impulse Aka ( From high to low = Sell OR Low to High= Buy)
4. Be Patient and wait for the Market to Reach the Aka Strong Levels (61.8 Or 32.8) OR Which Ever is Better Align With Good Structure!
5. Once you Have a smaller Timeframe break of structure or Momentum Change (You will look for an Entry Based on Market Environment + Structure)
6. Enter Your Trade Preferably of 1hOur Or 4hour Timeframe (whichever has given confirmation mentioned in point 4)
7. Always Use Risk Management / 1% Risk to Trade Entries using this Method
8. Patience is the Key to Success!
Let Me know if you have any Questions or Comments Below!
Your Support Is Appreciated!
Happy Trading & Goodluck!
See You in the Next Educational Video!
Global Fx Education

Quick Tutorial on Trend based Fib TimeThis is a quick tutorial on the Trend based Fib Time.
Please like the video if you thought it was helpful, and follow us for more quick tutorials and ideas!
Let us know down in the comments what tool do you want us to do a tutorial on.

Lets learn FIB together - HCLGot introduced to this instrument super recently, trying to practice FIB projects, its stunning how these level are overlapping. it seems very convenient to project on historic charts, this is an attempt to track new movements. lets see if we get a confirmation on 936 or 923

Educational: AB=CD pattern w/ BTC exampleOne fairly easy and useful pattern for determining reversals is the AB=CD pattern.
The pattern simply looks for two rising or falling legs up or down respectively. Then one simply measures the retracement level from point B followed by the projection from C (luckily tradingview has a tool to assist with this). If these values equal a 0.618 or 0.786 retracement followed by a 1.272 or 1.618 projection respectively, the pattern is likely to indicate a reversal of the current trend. For example, above we can clearly see the pattern almost perfectly matched the required levels of 0.618 and 1.272.
However, no pattern is guaranteed, so it is always recommended to seek out confirmation. As we can see in the above example, there is bearish reversal divergence that can be seen on both RSI and MACD (dotted green lines), whereby price is rising while oscillators are falling, indicating an even greater likelihood for a reversal.
Upon confirmation of a reversal, one can then target Fibonacci retracement levels as key points of interest as can be seen above.
A nice part about this pattern is how simple it is to spot and draw out particularly with tools available on tradingview.
Hopefully you are able to use this pattern as another useful tool in your arsenal!

The Fibonnaci Retracement, A Traders Best FriendWe all know what the fibonnaci is. But how do implement it into trading and how does it work?
The tool i use the most is the fibonacci retracement. You drag it across the chart. Drag it on starts to ends of trends and you have a fibonacci retracement now.
How does it work?
Now that you have drawn your fibonacci you see these ,,zones". The most common number used in fibonacci tools are 0.618 or 1.618, also known as the golden ratio. The most common example of the fibonacci retracement you'll see are rejections from 618 zone to 382. The 764 zone is thought to be a strong rejection zone. The 1 and -0.618 are thought to be reversal zones. Between 0.5 and 0.618 is the ,,golden zone" for shorts or longs.
Now lets say we have a fibonnaci with the numbers 1, 0, 0.5, 0.618, 0.764 and -0.618 and i draw it on a up trend from start to finish. What is most likely going to happen is the price will go into our ,,golden zone" and retrace up. Take profit will be -0.618 or 0. And our stops will be just bellow 0.764. You can customize your fibonnaci to your likings and test to see what works and what doesn't. The zones i recomend most are those i mentoned earlier in the example.
Remember to draw the fibonnaci on trends, NOT consolidation.
If you liked this little guide leave a like and share it to a friend ;).

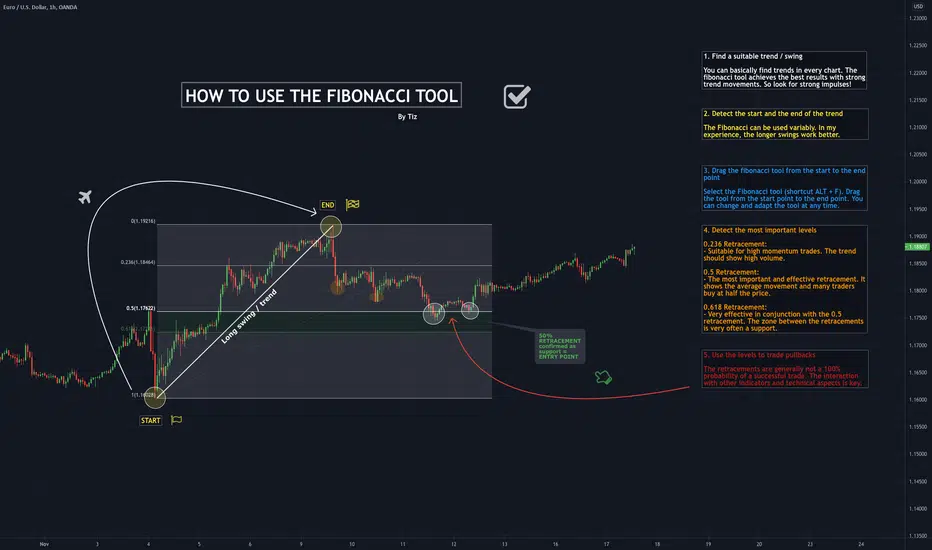
How to use FIBONACCI TOOL1. Find a suitable trend / swing
You can basically find trends in every chart. The fibonacci tool achieves the best results with strong trend movements. So look for strong impulses!
2. Detect the start and the end of the trend
The Fibonacci can be used variably. In my experience, the longer swings work better.
3. Drag the fibonacci tool from the start to the end point
Select the Fibonacci tool (shortcut ALT + F). Drag the tool from the start point to the end point. You can change and adapt the tool at any time.
4. Detect the most important levels
0.236 Retracement:
- Suitable for high momentum trades. The trend should show high volume.
0.5 Retracement:
- The most important and effective retracement. It shows the average movement and many traders buy at half the price.
0.618 Retracement:
- Very effective in conjunction with the 0.5 retracement. The zone between the retracements is very often a support.
5. Use the levels to trade pullbacks
The retracements are generally not a 100% probability of a successful trade. The interaction with other indicators and technical aspects is key.
TOP 5 Tools To TradeHi traders!
Working process of any trader is usually related with usage of different tolls. These tools are invnted to make traders’ life easier. For instance, you shouldn’t just build lines of support and resistance by yourselves, just choose 3 main points and use Fib ExtensionMany of you asked us, what tools we usually use in our daily stuff. Well, we use many different indicators, oscillators and other tools like Fiba, Pivots and so one. Today, we’ll give TOP-5 tools, that’ll make your trading activity easier and more efficient.
Fibonacci retracement
Fibonacci retracement levels are horizontal lines that indicate where support and resistance are likely to occur. They are based on Fibonacci numbers. Each level is associated with a percentage. The percentage is how much of a prior move the price has retraced. The Fibonacci retracement levels are 23.6%, 38.2%, 61.8%, and 78.6%. While not officially a Fibonacci ratio, 50% is also used.
The indicator is useful because it can be drawn between any two significant price points, such as a high and a low. The indicator will then create the levels between those two points.
Suppose the price of a stock rises $10 and then drops $2.36. In that case, it has retraced 23.6%, which is a Fibonacci number. Fibonacci numbers are found throughout nature. Therefore, many traders believe that these numbers also have relevance in financial markets.
How to use?
Put the first point to lower low, the second to the higher high or vice versa.
Fibonacci extension
Fibonacci extensions are a tool that traders can use to establish profit targets or estimate how far a price may travel after a retracement/pullback is finished. Extension levels are also possible areas where the price may reverse. Fibonacci extensions are a way to establish price targets or find projected areas of support or resistance when the price is moving into an area where other methods of finding support or resistance are not applicable or evident.
To study it accurately, read our Fiba Extension From Scratch (link in the description).
Pivot Point
A pivot point is a technical analysis indicator, used to determine the overall trend of the market over different time frames. The pivot point itself is simply the average of the intraday high and low, and the closing price from the previous trading day. In fact, price above the pivot point is thought to indicate ongoing bullish trend, while price below the pivot point indicates bearish one.
The pivot point is the basis for the indicator, but it also includes other support and resistance levels that are projected based on the pivot point calculation. All these levels help traders see where the price could experience support or resistance. Similarly, if the price moves through these levels it lets the trader know the price is trending in that direction.
Commonly, traders use Pivot Points as support and resistance levels as well as stop-loss levels. In the combine with oscillators (MFI, OBV, etc.) and Fiba levels we invent efficient strategies.
Ichimoku
One of the most informative indicator in world of trading. It can give you both support/resistance levels and sell buy signals. Out crew uses it every day. However, many traders consider it rather difficult to interpret. If you want to know more about it and use it as efficient as it’s possible, check out our articles (link in description)
Pitchfork
Andrews' Pitchfork can be used by traders to establish profitable opportunities and swing possibilities. On a long-term basis, Pitchfork can be used to identify and gauge overall cycles that impact underlying spot activity.
In general, traders will purchase the asset when the price falls near the support of either the center trendline or the lowest trendline. Conversely, they'll sell the asset when it approaches the resistance of either the center line or the highest trendline. Even though the center line can be used to identify areas where a security may find support or resistance, it is generally not as strong as the two outside lines. In practice, the levels identified by this indicator are very useful for identifying strategic positions for stop-loss orders.
To apply the pitchfork, you should choose the pivot of “trend start” (A on the chart). Than, chose the significant maximum(B on the chart) and significant minimum.
DISCLAMER: Information is provided only for educational purposes. Do your own study before taking any actions or decisions.

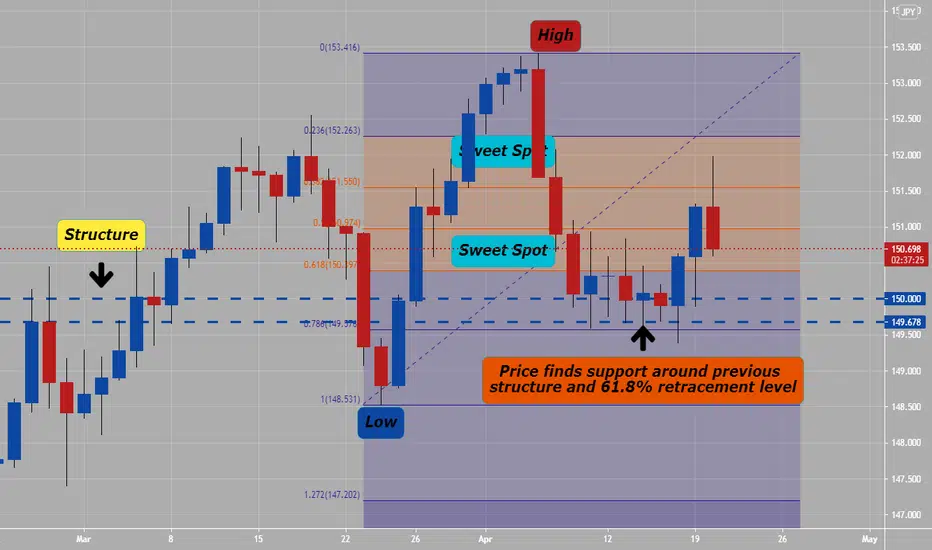
How To Use Fibonacci Retracement ToolLike price, support and resistance levels, volume, etc., Fibonacci levels are leading indicators. Most traders don’t use Fibonacci levels alone to take trades but combine them with other indicators to qualify or disqualify trades. Fibonacci retracements are typically used to make a case for entering a trade.
Easiest way to use the regular Fibonacci retracement tool and measure is backward (against the swing – as shown on attached chart example).
Using Fibonacci Retracements
Most traders use Fibonacci retracements for qualifying trade entries. If the retracement has only come down to the 23.6 level or less, there is likely to be a further retracement. A very deep retracement (one that retraces further than the 61.8 level) is often a sign that price is not likely to continue in the direction of the original swing.
If you’re waiting to enter a trade on the retracement of a move, there is a sweet spot in which you’d like to see price bounce and hopefully continue the in the original direction. That sweet spot ranges from about the 38.2 level to the 61.8 level. Note: The 50.0 level is not a Fibonacci ratio, but is usually included in these measurements because price reverses at the 50% retracement level so frequently.
Fibonacci retracements aren’t usually used alone to enter trades. Rather, they are used in combination with other factors in a trading plan to build a case (or qualify) possible entries.Using Fibonacci retracement levels works best after strong and obvious price swings. Don’t force trades where there are none.
Like any other market indicator, Fibonacci retracement and extension levels are just a tool. Using them will not magically make you a good trader if you’re not already good at trading. However, using them in combination with other market factors can help you filter out some bad trades, which is a good thing for any trader. As always, be sure to back test and demo trade any new trading techniques before adding them to your live trading repertoire.
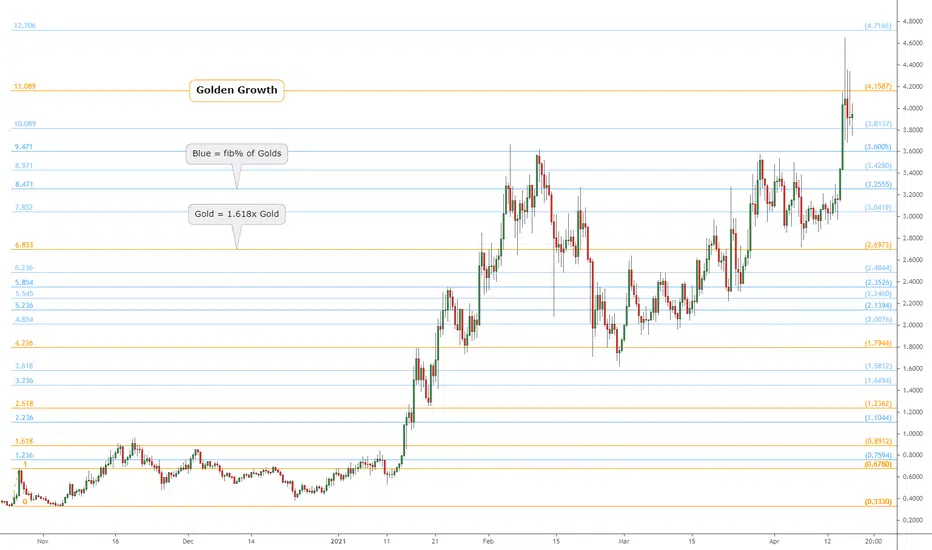
Pulse of an Asset via Fibonacci: CRV Golden Growth but Topped?This Chart is a an example of a "Golden" Fib series.
This Concept is from "Chapter 5" of my going "book".
This Religion is from the church of the "Golden Ratio".
Often, a Golden level marks the End of a Wave.
It is common to overshoot, but then reject from it.
Return to Gold fib and Reject a sign of having topped.
.
I do not use "Fibs" in the "traditional" manner (retracements).
I use Fibs to plot "Ripples" (extensions) created by "Impulses".
Then look for "Confluences" to map the "interference Pattern".
My TV collection of ideas detailing the Concepts:
Chapter 1: Introduction and numerous Examples
Chapter 2: Detailed views and Wave Analysis
Chapter 3: The Dreaded 9.618: Murderer of Moves
Chapter 4: Impulse Redux: Return to Birth place
Chapter 5: Golden Growth: Parabolic Expansions <= Current Example
Chapter 6: Give me a ping Vasili: 'one' Ping only
.
FIB your way to SUCCESS! In his historic 13th century novel Liber Abaci (Book of the Abacus), Leonardo Fibonacci brought a special sequence of numbers known as the Fibonacci series to Western civilization. Before we look into how Fibonacci numbers and ratios are used in the financial markets to predict future support and resistance levels, let's have a look at where they came from and how they were created.
A simple mathematical expression that describes a Fibonacci series is given as follows:
F(n+1)=Fn+ F(n-1)
where Fn represents the current number, F(n-1)the previous number, and F(n+1) the next number in the Fibonacci series. Any integer in the Fibonacci series is the sum of its two previous whole numbers, regardless of how it is represented mathematically.
Starting with F(n-1) = 0 as the previous number and Fn = 1 as the current number in the sequence, we can get F(n+1), the next number in the Fibonacci series, by repeating or iterating the process for each new Fn:
0, 1, 1, 2, 3, 5, 8, 13, 21, 34, 55, 89, 144, 233, 377, ...
The ratio of the current Fibonacci number to its immediate previous number, that is, the ratio (F(n+1)/Fn) or (Fn/F(n-1)), is a special and somewhat mysterious characteristic of the Fibonacci sequence. When we move farther out into the Fibonacci sequence, this ratio reaches 1.618 (to three decimal places). In truth, it turns out that it doesn't matter which two numbers were chosen to start the series in the first place. It will still hit 1.618 as we proceed along with the list! This unique ratio is referred to as the Golden Ratio, or "Phi" .
We already know that Phi = 1.618 (to three decimal places). Here are some other important ratios related to Phi:
a. (1/Phi) = 0.382
b. Phi x Phi = 2.618
c. (2/Phi)-1 =0.236
d. √ (1/Phi) = 0.786
e. √ Phi = 1.272
The items in this list of Phi‐related ratios are regarded as significant ratios in technical analysis and are used widely by technical traders and analysts.
Fibonacci Retracements, Extensions, and Projections
Fibonacci numbers and ratios are often used to time future market reversals, or as time forecasts, as we can see in the following pages. Before going any further, it's a good idea to define the terms retracement, extension and projections in broad terms.
Price Retracements
A market drop or reversal from a significant high, or a rebound from a significant trough, is referred to as a retracement . The amount of retracement is normally expressed as a percentage of the observed price range, and is calculated by comparing the peak to a previous significant trough or a trough to a previous significant peak. In other words, we have both downside and upside retracements. Popular Fibonacci percentage retracements include:
a. 23.6 percent
b. 38.2 percent
c. 61.8 percent
d. 78.6 percent
Price Extensions
A downside extension is any downside retracement that is greater than 100 percent, that is, the downside retracement extends below the previous significant trough, that is, beyond the observed price range. In similar fashion, an upside extension is any upside retracement that is greater than 100 percent, that is, the upside retracement extends above the previous significant peak that is beyond the observed price range. Popular Fibonacci price percentage extension levels include:
a. 127.2 percent
b. 161.8 percent
c. 261.8 percent
d. 361.8 percent
e. 423.6 percent
f. 461.8 percent
Price Projection
An upside price projection is a projection of an observed price range from a higher significant trough. A 100 percent price projection is simply a one to one (1:1) projection of the observed price range from some new higher significant trough. Similarly, Fibonacci downside price projections use the phi‐related percentages for forecasting potential support in a downtrend.
The main Fibonacci percentages associated with projections are:
a. 61.8 percent
b. 161.8 percent
c. 261.8 percent
d. 361.8 percent
e. 423.6 percent
f. 461.8 percent
Trade with care.
If you like our content, please feel free to support our page with a like, comment & subscribe for future educational ideas and trading setups.

fibonacci extensions / retracements - how to and where to applyFibonacci tools are in general a method of technical analysis for determining probable support and resistance levels calculated using ratios (23.6%, 38.2%, 61.8%, and 78.6%) that are derived from Fibonacci sequence (0, 1, 1, 2, 3, 5, 8, 13, 21, …). Fibonacci levels are presented in variety of forums, such as horizontal lines, vertical lines, trend channels , fans , arcs, circles, even a spiral. Fibonacci levels also arise in other ways within technical analysis, for example, one of the best known and widely used Elliott Wave theory
In this article we will have a closer look to Fibonacci Extensions and Fibonacci Retracements
Fibonacci Retracement and Fibonacci Extension levels are in the form of horizontal lines and are calculated in almost similar manner with slight difference. Even tough they look like similar to each other they are quite different and serve for different purpose.
👉 Fibonacci retracement levels indicate how deep a retracement could be, that is, aims to measure the pullbacks within a trend
👉 Fibonacci extension levels indicate how far the next price wave could move following a pullback, that is, aims to measure the impulse waves in the direction of the trend
How to apply Fibonacci Retracement and Fibonacci Extension
These levels should not be relied on exclusively,Reversals can be confirmed with candlesticks, momentum indicators, volume or chart patterns.
Here are the links of educational posts and indicator versions of the Fibonacci Tools that I made, you are kindly invited to check
Auto Fib Channels, besides Auto Fib Channels this study include Auto Fib Retracement, Auto Fib Extension and Auto ZigZag indicator
Auto Pitchfork, is advised due to its similarities with Auto Fib Channels and also it includes Auto Fib Retracement and Auto ZigZag indicator
Auto Fib Speed and Resistance Fans, is an important tool to identify probable support and resistance and especially a powerful tool to identify reversals and retracement levels. The study presents an alternative approach of drawing the fans which enables a visualization quite similar to Gann Box. Auto Fib Retracement and Auto ZigZag indicator is also available
Related educational posts that presents a quick guide of the drawing tools as well as introductions for their automatic indicator versions
how to apply pitchfork and auto pitchfork study :
how to apply fibonacci fans and auto FibFans study :
how to apply fib channels and auto fib channels study :

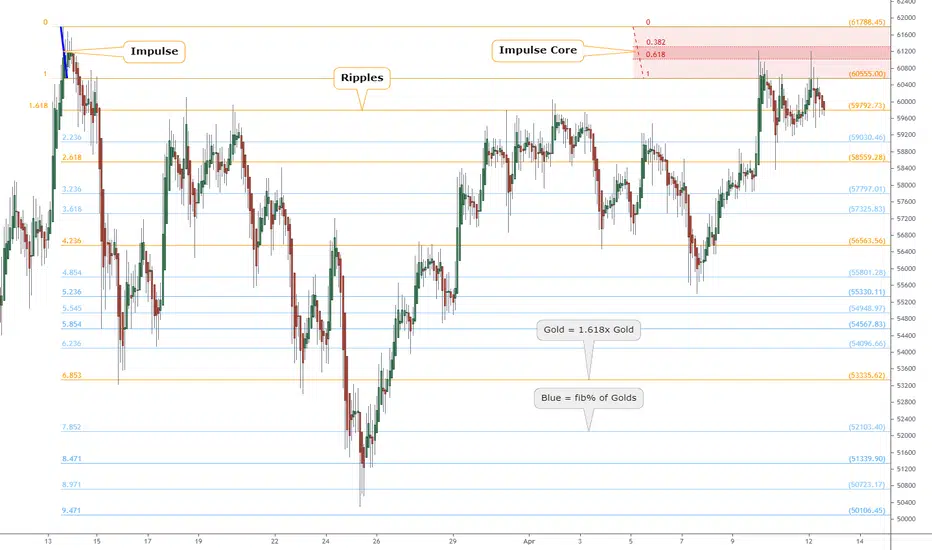
Pulse of an Asset via Fibonacci: BTC testing ATH Impulse Core"Impulse" is a surge that creates "Ripples", like a pebble into water.
"Impulse Redux" is returning of wave to the original source of energy.
"Impulse Core" is the zone of maximum energy, in the Golden Pocket.
Are the sellers still there? Enough to absorb the buying power?
Reaction at Impulse is worth observing closely to gauge energy.
Rejection is expected on at least first approach if not several.
Part of my ongoing series to collect examples of my Methodology : (click links below)
Chapter 1: Introduction and numerous Examples
Chapter 2: Detailed views and Wave Analysis
Chapter 3: The Dreaded 9.618: Murderer of Moves
Chapter 4: Impulse Redux: Return to Birth place <= Current Example
Chapter 5: Golden Growth: Parabolic Expansions
Chapter 6: Give me a ping Vasili: 'one' Ping only
.
.
Ordered Chaos
every Wave is born from Impulse,
like a Pebble into Water.
every Pebble bears its own Ripples,
gilded of Ratio Golden.
every Ripple behaves as its forerunner,
setting the Pulse.
each line Gains its Gravity .
each line Tried and Tested.
each line Poised to Reflect.
every Asset Class behaves this way.
every Time Frame displays its ripples.
every Brain Chord rings these rhythms.
He who Understands will be Humble.
He who Grasps will observe the Order.
He who Ignores will behold only Chaos.
Ordered Chaos
.
.
.
want to Learn a little More?
can you Spend a few Moments?
click the Links under Related.
Order box trading This is educational :)
You can see that the price is a bit "blurry" at the first order box. Why is this?
Financial institutes never invest their whole money at the same time to get "stopped out" or "margin called". They do this to check how the price is reacting to their orders. For example, if they want to invest 100 million euros in a long position; firstly 20m, then 30, and then 50.
This "blurr" will form what we call the order box.
Now, what happens?
All of the orders will not go to reality. maybe only 70% will. Then, when the price touches this order box area, the price will bump again as a consequence of all the underlying orders. This is what you see at the "support order box". Same thing at the top.
Steps to spot these:
1, find the "blurr"
2, watch for confirmation (aka = second time it touches)
3, trade the 3rd, or 2nd if u are brave, it touches this box.
4, place stop loss just above the box
But what for take profit?
Place it in either the other side of the box, or eventually, at 0,618 of Fibonacci. I use this to trade with the trend and not against it.
Questions? Ask them in the comment area :D

Fibonacci Extensions From ScratchHi traders!
Evidently, every trader understands the importance of defining the trend with its support and resistance levels. Unfortunately, sometimes it’s kinda difficult or even impossible to do with basic tools. Nevertheless, traders have fixed the problem and evented some indictors that are able to solve this problem. One of them is Fibonacci extensions .
Fibonacci extensions are a way to establish price targets or find projected areas of support or resistance when the price is moving into an area where other methods of finding support or resistance are not applicable or evident.
As you can see, Fib Extensions is some kind of ratios.The ratios themselves are based on something called the Golden Ratio.
How to build Fib Extension?
During the up trend you should initialize the point of previous lower lower. Next point is the higher high and lower low again. The points should be consistent.

how to apply fib channels and auto fib channels studyThe Fibonacci Channel is a technical analysis tool that is used to estimate support and resistance levels based on the Fibonacci numbers. It is a variation of the Fibonacci retracement tool, except with the channel the lines run diagonally rather than horizontally.
The tool is used to aid in identifying where support and resistance may develop in the future. If the uptrend is expected to continue, the 100%, 161.8%, and other higher levels are potential price targets. The same concept applies to downtrends if a downtrend is expected to continue
In an uptrend, the zero-line is like a normal trendline, helping to assess the overall trend direction. If the price falls below it, it may need to be adjusted based on more recent price action, or it could signal that the uptrend is over and that the price is breaking lower. Similarly in a downtrend, the zero-line also acts like a trendline. When the price is below it, it helps confirm the downtrend. If the price moves above it, the indicator may need to be redrawn or the price is moving higher out of its downtrend
Difference Between Fibonacci Channels and Andrew's Pitchfork
Both these indicators attempt to predict future support and resistance levels based on price levels from the past. Fibonacci channels attempt to do this with percentages of a selected price move. Those percentages are then projected out into the future. Andrew's Pitchfork is simpler in some ways as the angled lines are based on three price levels selected the trader and then extended out into the future.
Step By Step Applying Fibonacci Channels
Auto Fib Channels ʙʏ DGT ☼☾
LINK to Auto Fib Channels ʙʏ DGT ☼☾

how to apply fibonacci fans and auto FibFans studyFibonacci Speed and Resistance Fan is an analytical drawing tool used to indicate the support and resistance levels of an existing trend and the price level at which possible changes in the trend may occur.
A Fibonacci Speed Resistance Fan consists of a trend line drawn between two extreme points - a trough and opposing peak or a peak and opposing trough - on which a set of sequential speed resistance lines are drawn above (which represents time) and below (which represents price). These lines are drawn based on time/price percentages of the distance between the beginning and the end of the trend line.
Speed resistance lines not only help to measure trend corrections but also measure the speed of a trend (the rate at which a trendline ascends or descends)
Traders can use the lines of the Fibonacci Speed and Resistance Fan to predict key points of resistance or support, at which they might expect price trends to reverse. Once a trader identifies patterns within a chart, they can use those patterns to predict future price movements and future levels of support and resistance. Traders use the predictions to time their trades
Nobody appears to know whether Fibonacci tools work because markets exhibit some form of natural pattern or because many investors use Fibonacci ratios to predict price movements, making them a self-fulfilling prophecy. In any event, key support and resistance levels tend to occur frequently at the 61.8-percent level (0.618) on both uptrends and downtrends
Fibonacci Speed and Resistance Fans vs. Gann Fans
Gann fans are another form of technical analysis based on the idea that the market is geometric and cyclical in nature. A Gann fan consists of a series of trend lines called Gann angles.
Instead of relying on Fibonacci's golden ratio of 1.618, Gann believed the 45-degree angle (geometric angles of time versus price) to be most important. The Gann fan subsequently draws additional angles at 82.5, 75, 71.25, 63.75, 26.25, 18.75, 15, and 7.5 degrees. These angles are superimposed over a price chart to show potential support and resistance levels
Step By Step Applying Fibonacci Speed and Resistance Fan
Some interpretation examples:
Example of how to identify if the move is Reversal or Retracement
All the above are now available with the Auto Fibonacci Speed and Resistance Fans Study ʙʏ DGT ☼☾,
LINK to Auto Fibonacci Speed and Resistance Fans Study

how to apply pitchfork and auto pitchfork studyPitchfork , is a technical indicator for a quick and easy way for traders to identify possible levels of support and resistance of an asset's price. It is presents and based on the idea that the market is geometric and cyclical in nature
* Developed by Alan Andrews, so sometimes called Andrews’ Pitchfork
* It is created by placing three points at the end of previous trends
* Schiff and Modified Pitchfork is a technical analysis tool derived from Andrews' Pitchfork
In general, traders will purchase the asset when the price falls near the support of either the center trendline or the lowest trendline. Conversely, they'll sell the asset when it approaches the resistance of either the center line or the highest trendline.
█ Usage Tips :
* Andrews' Pitchfork (Original) best fit in a Strong Trending Market
* Schiff and Modified Pitchfork better with Correcting or Sideways Market. Modified Pitchfork is almost identical to a Parallel Chanel
Step By Step Applying Pitchfork
Auto Pitchfork Study ʙʏ DGT ☼☾
Besides Auto Pitchfork Pivot, Support and Resistance plotting, study also includes Auto Fibonacci Retracement Levels and Zig Zag indicator
Link to the Auto Pitchfork ʙʏ DGT ☼☾ :

ETHUSD Weekly Overview 3/26ETHUSD WEEKLY OVERVIEW 3/21 - 3/26
In this video I go over my personal perspective on the opportunities Ethereum presented throughout this week. There were 2 amazing entries that were presented totaling over 350+ points! The first setup averages around 250 points and the second was around 100 points. My first entry was at the 1780 key level and the second was around the 1700 whole level. The entry was also given extra confirmation based off the Fibonacci key levels. My initial targets were fibonacci extensions leading all the way towards the -618, around the 1550 price point.
There are times where price presented hundreds of points and then pulled back before continuing the overall trend. It is important to always secure some type of profits on a trade when you are significantly ahead. Never leave any money on the table or turn a winning trade into a losing trade. Even if your entry gets stopped out, continue working that zone over and over until the analysis invalidates itself. The level must prove that it is valid before having real confirmation that it may continue.
My style of trading uses Market Structure, Price Action, Fibonacci, Wave Sequences, Moving Averages , and a mixture of Multi Time Frame Confluence . Most importantly the visual realization of emotions cycled into the chart.
As always THANK YOU and if you found this video helpful, please let me know by hitting that like button and/or leaving me a comment below.
Also, feel free to share your opinion on this setup or other setups that you have. The more ideas we can generate together, the more informative these ideas become for newer traders. STAY PATIENT & STAY BLESSED!
~T$

BTCUSD Weekly Overview 3/26BTCUSD WEEKLY OVERVIEW 3/21 - 3/26
In this video I go over my personal perspective on the opportunities Bitcoin presented during this week. This week there were 2 possible entries that were presented totaling over 7500 pips! The first setup average around 5000pips and the second was around 2500pips. My initial target was my -13 extension level around 52k.
There are times where price presented several thousands of pips and then would pullback before continuing the overall trend. It is important to always secure some type of profits on a trade when you are significantly ahead. Never leave any money on the table or turn a winning trade into a losing trade. Even if your entry gets stopped out, then continue working that zone over and over until the analysis invalidates itself. The level must prove that it is valid before having real confirmation that it may continue. I ran into this same example around my first entry at 57K and then again later after the continuation of the first sequence.
Even though my first target was 52k price made a lower move into 49K! This is huge for the continuation back up higher into the 60K+ range, or even back lower into a deeper retrace. Whatever price decides to do I will remain patient and let the story unfold for me. We always REACT NOT PREDICT!!!
My style of trading uses Market Structure, Price Action, Fibonacci, Wave Sequences and Moving Averages . Most importantly the visual realization of emotions cycled in the chart.
As always THANK YOU and if you found this video helpful, please let me know by hitting that like button and/or leaving me a comment below.
Also, feel free to share your opinion on this setup or other setups that you have. The more ideas we can generate together, the more informative these ideas become for newer traders. STAY PATIENT & BE BLESSED!
~T$

This wave pattern is very close to reality, Here you can see how an extended flat elliot wave should be counted.
However there are multiple counts possible on current date,
Using different geometric tools and projections, we can pretty determine accuratly where the price currently is behaving.
Therefore I'm expecting at this moment a new wave up, which can be pretty str8 forward, since it is an ABC counting 2 impulse waves.
every A and C wave can be impulse or diagonal. So this complex corrective wave will not be easy for many traders to trade.
Here are some guidelines to help you identify the right trading spot for trading.
There are multiple tools to calculate the these elliot wave turning points on the forecast. It is not hard, however some studies you need to know on counting elliot wave and its fibonacci sequence correlation!
Try to avoid the B waves for trading,
Only trade the A and C wave, it is easier to do so in the bigger impulse 3 wave.
Fib sequences, Since it looks like this corrective C wave, is an diagonal.. We expect wave 5 to be projected around 44-46k. However, it really depends on the stretch of current A B C wave in wave 2.
once we completed this up leg. prepare for shorts, Ofcourse the C wave currently is an bearisch trend. So make sure you only trade the short moves, not the longs.
Only if you know how to calculate turning points within these trend, it is possible to benefit from it, as you can pretty accuratly predit where the price reversal zones exists.
I wish you all the best in Trading.
Please Share and like!

active trade set upwe are now explaining how do we take trade
so you don't have just an idea but actually the process behind the trade.
our entry trigger:
3 bullish confirmation on the macd
-macd with histogram forcast showing a bullish momentum
-macd4c showing a regression from the bearish momentum
-macd vxi showing that volatility is on our side
volume
-increase of volume giving us a good support to our macd trigger.
momentum rsi:
showing an entry signal
fib support- value area making our macd signal even more relevant
ema showing an global downtrend.
fondamentaly:
using a forex correlation matrix to see divergence between pair.
you have our tp and sl level so you can see were we see our idea become obselete or complete.
best regards, daniel forex analyst for richmonstocks.

Pulse of an Asset via Fibonacci: BTC at ATH Impulse Redux"Impulse" is a surge that creates "Ripples", like a pebble into water.
"Impulse Redux" is returning of wave to the original source of energy.
"Impulse Core" is the zone of maximum energy, in the Golden Pocket.
Are the sellers still there? Enough to absorb the buying power?
Reaction at Impulse is worth observing closely to gauge energy.
Rejection is expected on at least first approach if not several.
Part of my ongoing series to collect examples of my Methodology : (click links below)
Chapter 1: Introduction and numerous Examples
Chapter 2: Detailed views and Wave Analysis
Chapter 3: The Dreaded 9.618: Murderer of Moves
Chapter 4: Impulse Redux: Return to Birth place <= Current Example
Chapter 5: Golden Growth: Parabolic Expansions
Chapter 6: Give me a ping Vasili, 1 Ping only
.
.
Ordered Chaos
every Wave is born from Impulse,
like a Pebble into Water.
every Pebble bears its own Ripples,
gilded of Ratio Golden.
every Ripple behaves as its forerunner,
setting the Pulse.
each line Gains its Gravity .
each line Tried and Tested.
each line Poised to Reflect.
every Asset Class behaves this way.
every Time Frame displays its ripples.
every Brain Chord rings these rhythms.
He who Understands will be Humble.
He who Grasps will observe the Order.
He who Ignores will behold only Chaos.
Ordered Chaos
.
.
.
want to Learn a little More?
can you Spend a few Moments?
click the Links under Related.
