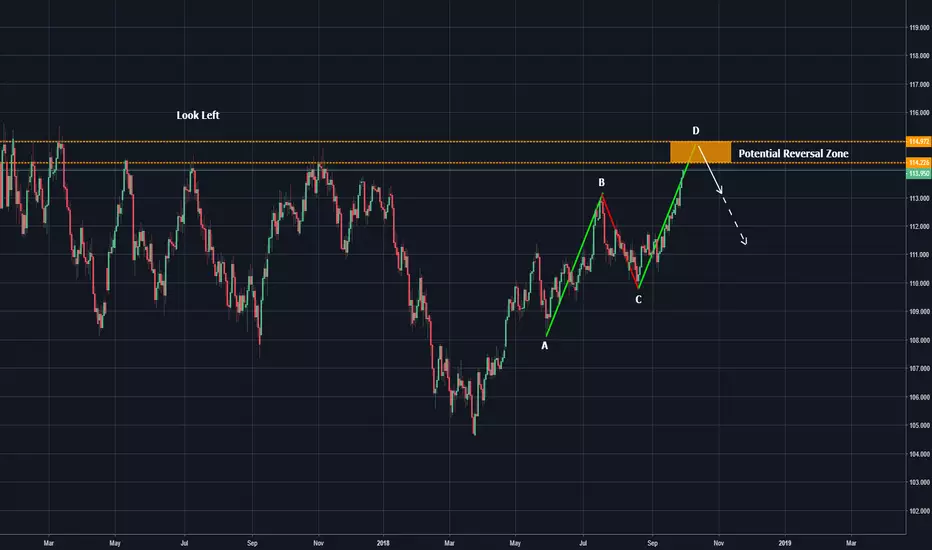
how to identify abcd pattern
hey traders,
this Monday I want to share with you my thoughts about dollar yen currency pair.
As the market has been violated 113 structure level, I anticipate bullish continuation up until
at least 114 level.
As the market reaches 114 I will be looking for counter trend opportunities.
One of them is this potential bearish abcd pattern.
It is an easily identifiable pattern. Basically, three steps are required:
1) identify impulse leg (in our case it is a steady movement from 108 to 113)
2) identify retracement (113 to 110)
3) projection of impulse leg from C point(110 - the end of retracement)
looking left, and identifying major levels of structure I underlined potential reversal zone where
the market is most likely to reverse.
When the market will reach this zone I will be looking for some confirmation.
Targets are based on structure.
Good luck!
Fibonacci
Combining Fibonacci with TDIUsing triple charts, TDI' Complementary Overlay, TDI' PRO and a basic entry rule we can make profitable trades possible.
Based on the condition of using an account with just under $5,000 trading account capital, with 1:500 leverage, with a deposit margin of ~$80, a single trade with lot size of 0.35
~ $310 Profit, 1 trade in one day
Third Chart use example

BTCUSD- Understanding Structures in the Crypto MarketHi all,
I felt compelled to spend quite a bit of time to create what I believe is an incredibly comprehensive guide to understanding the movements of the market. If you're tired of getting burned on every run, then look no further. Let's begin.
You might notice a handful of purple and black bars in this chart- their purpose is to designate "structures", or zones of heavy resistance/support. They might take a moment to get a grasp of, but once you understand how to define them, it becomes easy, and you'll be to start predicting where a run will end with scary accuracy.
To define a structure, you will essentially want to cover the .5-.618 region of a wave, although since waves rarely retrace exactly in that zone, you may want to expand your structures out a bit to cover wicks and outliers. Anyways, the easiest way to define your structure is simply by recognizing what our trend is. Would you be able to look at a chart and tell me when we've seen a bullish reversal or a bearish reversal? If not, it's quite easy; to spot a bullish reversal, look for a break above the previous high. To spot a bearish reversal, look for a break below the previous low. Obviously terms like "high" or "low" can be quite subjective, as there's a near infinite ways of looking at the charts, but having a bit of some background on Elliot Wave theory, Fibonacci retracements, and reversal candlestick patterns will help you recognize when a reversal is happening. The easiest way to try and find a reversal is by seeking out a definitive high and definitive low, and creating a Fibonacci retracement structure between the two. Let me go into detail a bit further below.
If you reference the first picture above the chart, you'll see 3 blue arrows with a Fibonacci and a purple box. This is showing what a bullish trend would look like. To set up this structure, you must determine what your wave of interest is. In this example, we create our points based on the first arrow. In an uptrend, you will start your retracement from the top to the bottom, rather than the bottom to the top. The reason you want to do this is because you are retracing DOWN, so you want your retracement wave to head to the .618 in its respective direction. Anyways, as you can see, the second blue arrow is a retracement wave, and you can see that it touches the .618, ends, and then proceeds to start the third wave. Because we made a bounce off of the .618, we have confirmed continued bullish momentum. if we were to do a convincing close below the .618, this would more than likely indicate that a trend reversal is commencing. Understand that at times, we can be faked out by this, but this is the nature of trading. If you have a good trading strategy, you don't need to worry about losing trades every so often, so it's better to put your faith into something that's quite accurate rather than trade with no strategy in play.
To keep in short (pun intended), whenever you are in a downtrend, the opposite applies to that of the uptrend; you will start your retracement from the bottom to the top. The same deal applies with the downtrend as it does the uptrend, in that a rejection of the .618 will most likely point to continued bearishness. Using these bullish and bearish wave structures are incredibly power tools that not only help you minimize losses, but they also give you the confidence to stay in a trade for longer than you might have realized was possible. Remember, if there's no clear signal of a trend change, then the trend will continue.
So with these tools in hand, I went through every noticeable wave structure since the 3000 dollar range and determined wave lengths, which can be done by finding .5-.618 regions that appear to have found a lot of activity. For the most part, determining your wave structure will come down to common sense, but it takes a bit of practice to know where a wave starts and where a wave ends.
If you look at each structure found in the chart, you'll notice they all start in different positions. I positioned each of them to reflect the date in which they first were established. As you can see, this is an incredibly powerful tool to have at your disposal, because it predicted the top in March, it predicted the top in May, and it predicted the top in July. Something tells me that this has predicted the top in September, too, but I'll let you guys figure that out ;). Additionally, the support structure (bottom purple bar) shows the rejection that we experienced in February, June, and August.
I don't want to give too many details about my opinions or thoughts on what we have here, because this is meant to be educational over anything, but I hope that this helps you guys get a better understanding of what makes the market move the way it does. Feel free to message me if you have any questions, and be sure to shoot this a like if you dig what you've read. Happy trading!

END OF TREND CONFIRMATION1. Divergence
2. Trend Line Break
3. 123 Reversal Pattern
123 Reversal Pattern:
At point 3, the market is at
the crossroads and price can
either make a new low or
confirm a change in trend
once price takes out point 2.

THE PIN BAR TRADING SETUP EXPLAINED :As the most liquid market in the world, Forex or foreign exchange attracts more and more retail traders. Everyone comes to the market with different expectations but aims for the same thing: to make money. Pin bar trading is a simple, yet effective trading strategy that offers excellent risk-reward ratios.
What Makes a Pin Bar?
Before more details, we need to explain what a candlestick is. To interpret a candlestick, traders consider the following:
- opening price
- closing price
- the highest value
- the lowest value
The difference between the opening and closing prices is the body of the candle. Also known as the real body, it is bullish when the closing price is higher than the opening one, and bearish when is lower. The price action to the highest or lowest point is the shadow or the tail.
For a pin bar to form, traders look at the real body to be relatively small, and the tail of the candle much longer. In fact, the longer the tail, the better.
While not a general rule, savvy traders look for the following condition to happen before pin bar trading: the tail to be so long, so the real body fits at least two times.
Conventional wisdom claims that a bullish pin bar must have a green body (closing price bigger than the opening one) and a bearish pin bar a red body (closing price lower than the opening price).
The Pin Bar Trading Setup Explained :
For a single candle, the pin bar is an impressive reversal pattern. It shows a terrible battle between bulls and bears, signalling that the previous trend weakens.
Hence, for a bullish pin bar, a bearish trend must exist. And, a bullish trend is mandatory before a bearish pin bar forms.
A pin bar trading strategy when it reverses a bullish trend considers the following steps:
- measure the entire length of the pin bar, from the lowest to its highest point
- go short when the price breaks the lowest point
- place a stop loss order at the highest point in the bearish pin bar
- project the length of the pin bar minimum two times below the entry point
Sometimes the market reverses so aggressively after a pin bar that the pin bar trading strategy offers a greater risk-reward ratio than 1:2. To make sure they’re not missing the new trend; aggressive traders move the stop at break-even when the price reaches 1:1 rr ratio and trail parts of it as long as possible.
Fibonacci Ratios with the Pin Bar Trading Setup
Savvy traders have patience, and they know that any reversal pattern shows a conflict. The conflict or the battle between bulls and bears implies the market won’t reverse quickly.
After a bullish trend like the one above, bulls won’t give up that easy. That’s the reason why every pin bar trading strategy needs a stop loss.
However, a pullback is more than welcomed. In fact, pullbacks often happen after a bullish or bearish pin bar.
Fibonacci ratios help in finding an even better risk-reward ratio. Here are the steps to follow on the same bearish pin bar setup:
- measure the length of the bar, from its highest to the lowest point
- use the Fibonacci Retracement tool for finding the 50% and 61.8% levels
- wait for the market to reverse to the defined area
- go short with a stop loss at the highs
- keep the same take profit as in the original setup
This way, traders stay for the same take profit, but with a lower risk. Hence, Fibonacci comes to complement the unique pin bar trading strategy by offering an even greater risk-reward ratio. Not bad for a single-candlestick pattern, right?

A CRAZY TRADING SETUP : 26182618 Rules Of Engagement:
1. Double top
2. Break & close below neckline / support
3. Sell at 0.618% Fibonacci Retracement

FIBONACCI for beginners Part#3! How you can use FIBs!Hey everyone,
third Video about fibonacci.
In this video I talk about Fibonacci-Retracements and how you can use them for your trading. :-)
Peace and happy learning
Irasor
Trading2ez
Wanna see more? Don`t forget to follow me!
Any questions? Need more education or signals? PM me.

Fibonacci "offstage" theory 4 beginners and advanced traders!#1Hey guys,
this is the first video about FIBONACCI and some theory "behind the scenes" which is meant to show you how Leonardo Fibanocci disvoered an additional law.
Hope you enjoy itt :-)
Peace and good trades
Irasor
Trading2ez
Wanna see more? Don`t forget to follow me.
Any questions? Need more education or signals? PM me. :-)

Educational five wave with a 2.618 extension of wave 3This five wave up has more than the first spot is visible. First of all, we look at the wave itself.
All ingredients of the Elliott wave are present here.
- Wave two falls within the boundaries of a retracement of 50% - 85.4% of wave one.
- Wave three may not be the shortest wave (check). Looking back to wave one, it is clear at that moment that it is actually wave three.
* The extended wave three itself is a five wave as well.
* An additional point that is clearly visible here is that the extension of this wave is the fibonacci ratio 2.618 of wave 1.
- Wave four falls within the boundaries of a retracement of 23,6% - 50% of wave three.
- Wave five is 61.8% of wave one till three.
* The other rules for wave five that I stick to are: wave 5 is an inverse 123.6 - 161.8% retracement or wave four or wave five has approximately the same length as wave one.
What makes this total wave special is the point where it ends. The connection with a higher timeframe that has arise here is beautifully displayed beneath here. This is the reason why I post the analysis here.
- On the daily timeframe i have drawn the fibonacci ratio 0.382 from a strong move up, happend between December 2016 and February 2018. The five wave up from above ended at the bottom of the 0.382 retracement (resistance).
This analysis i made is to give insight into what can happen, to look back when I discover a similar case. I do not give advice on what someone should do or should imply from this analysis. It is an important reminder for myself on what happened.

Fibonacci Jones and the Secrets of Mount 61.8Hello and welcome everybody,
in this idea i will show you the "magic" of a fibonacci retracement level called "61.8". I will later provide some snapshots to keep my beautiful art-for-the-poors-chart untouched. Stay tuned and enjoy the legacy of Leonardo Fibonacci!
Yours sincerely
Eddie
Sources:
Leonardo Fibonacci - en.wikipedia.org
Fibonacci Numbers - en.wikipedia.org
Fibonacci Retracement - www.investopedia.com
Disclaimer: This information is not a recommendation to buy or sell. It is to be used for educational purposes only.

Why and when trends failHere, using gold I demonstrated the importance of time analysis. Most of traders analyze only price action in relation to price and most of indicators can do only that.
However price need to be analyzed also in relation to time, as price moves in Fibonacci sequences not only in price scale but also in time as you see. And when it hits an important Fibonacci TIME extension, a trend will change direction for hours, months or years depending on timeframe.
With these tools you can analyze time action:
Fibonacci time extensions
Fibonacci time zones
Fibonacci arcs
Fibonacci circles
Fibonacci fans
Pitchfork fan
Gann fan, Gann angles (to place Gann fan you have to LOCK scale. Then put 45 degree angles. Angle 1-1 has to run by 45 degrees).
Gann boxes
Cyclical oscillators, CG Oscillators (Center of Gravity as Fisher, Ehler's CG)
How to draw Fibonacci Time extensions - traditonally, time cycles are measures from LOWEST LOW to LOWEST LOW. You find 2 lowest lows and drag Fibonacci time extension tool between them and then drag back the third line to the first low where you started. Then you have Fib time extensions from the second lowest low that you connected, into the future. Its important, it has to be absolute lowest low. If you do it on weekly, zoom to daily and place the end on absolute daily low.
Fibonacci Time zones. You place 1 on lowest low wig, 2 has to fall on the next candle. Best to do it on daily. 1 candle -1 time zone unit.

Moving up stop loss in a swing This is a beautiful example of how to move up your stop loss
You see an 12345 structure in this photo
I started this trade at the bottom of wave 2 and my stop loss was place below the bottom of wave one
when we started buy i waiting on the first correction and moved my stop loss at the bottom of wave 4
once price started running i started moving the stop little by little until we reach the top of the wave
at the top of the wave I would usually take any other profits besides the original
I would move the original position below wave 4 or below 38.2% fib
however i closed out of this position because I am expecting a bigger correction
this is just a nice example with perfect execution i know some that count the pips and thats how they move their stops but this is just an example you can use as your own or tweak to your liking

The Easy Way to Draw Very Powerful Support & Resistance LevelsThis method will save your time to determine where are the powerful S&R levels for any instrument. It can be used for the continuous chart or the monthly chart. It will also help you to entry, set the stop loss and profit target levels, even if you are using other methods such as Elliott Wave Theory, Harmonic Pattern, Market Geometry (the pitchfork), Demand & Supply and others.
Enjoy!

Catch Me If You Can: Breaking Down the Elusive Elliott WaveHere's an explanation why Elliott Waves don't work most of the time, and then sometimes work perfectly.
Lets take a closer look at a single impulse wave up and its correction (I'm using 61.8% retracement and wave 3 = 100% of wave 1). You simply can't trade based on that (red dots), here's why.
If you treat it as 123 up trend forming (green count), you can't confidently:
1. short at the end of 1 to catch wave 2 because it can go higher (have an extension from 100% to 127.2%, 161.8% and 261.8%)
2. long at the end of 2 to catch wave 3 because it can go lower
- from 23.6% to 38.2%, 50% and finally 61.8% and then go up for the up trend 123
- up to 88.6% of wave W in wave X and then go up in Y (if this is X not 2)
- and even lower after that, break the start of wave 1 to reverse the trend down
3. short at the end of wave B (red) after a bounce from wave 2 to catch wave C (red), because it can go higher
- it can go up from 23.6% to 38.2%, 50% and finally 61.8% of prev swing wave A (red) and then bounce down as zigzag or triangle
- it can retrace as wave B (red) in a flat up to 88.6% and then go down still
- or it can even be an expanded flat wave B/X and retrace up to 138.2% of wave A (38.2% above the end of wave 1, Sometimes even 61.8%! and only then drop down)
- or it will go up in wave 3/Y = 100% of wave 1/W
4. long on breakout of the end of wave 1 to catch wave 3 because it can pullback
- it can be wave a of Y or lower degree iii or 3 and immediately pullback in b/iv below wave 1
- it can be an expanded flat wave B/X and retrace from 105% up to 138.2% of wave A (38.2% above the end of wave 1, Sometimes even 61.8%! and then drop down)
- it can be a short Y = 61.8% of W in WXY and then go down
That's why you are only supposed to buy on a retest of wave 1 after the breakout
5. long at the end of wave C (next bounce from the end of B) (red) because it can go lower
- it can become a triangle ABCDE and break the other way
- it can still be wave B and go higher up a bit then down in zigzag/flat (same impulse-correction fractal of a lower degree, same options, see #3)
- it can break the end of wave 2 and continue down as wave C from 61.8% up to 1.618% of wave A, although we mostly have short C = 61.8% of A in Bitcoin
So, on the long side you are left only with 2 not-so-tradable options:
- buy above 138% of wave 1 to ride a very small ~10% (100% - wave B retracement - 38%) chunk of wave 3 = 100% of wave 1.
However, the expanded flat can still go to 161.8% and wave 3 can end early at 61.8% as wave C/Y.
And if not that, this trade probably has a bad R/R and you will pay in fees a lot more that you possibly can gain.
- buy on retest of wave 1/A/W in iv/x after the breakout to ride wave 3/C/Y (100% - wave 2/B/X retracement) up to 38.2% in case of an expanded flat or up to 100% of wave 1 in case of wave 3/C.
And you can only to the 2nd option on the short side, because usually C = 61.8% of A, not 100%, invalidating the first setup.
But guess what, that's called trading breakouts from a range/triangle, and you don't need Elliott Waves for that.
Conclusion:
I just showed you that in most cases Elliott Waves don't really work, they give you a number of possibilities for both bull/bear cases, not trend direction.
You can't trade based only on Elliott Waves and fibs, without using other TA methods.
The trend is basically just a sequence of 2 impulses and then comes a wave 4 which can become the 1st impulse down and reverse the trend or go up in wave 5. Waves 3 and 5 are not guaranteed. The only thing guaranteed is a 2nd impulse following the 1st. But in the current market with unclear 3/5 wave structure, low liquidity, hidden bottoms and traps you can't clearly spot even the 1st impulse, so there might not be a 2nd one.
Continued Below =>

The Golden Pocket Fibonacci like a BossBuying the pull back is always tricky.
As a trader we deal with probabilities and try our very best to find high probability trades. We do this by finding confluence and various reasons to add to our trade setup.
The Golden Pocket
It is my ideal favorite zone to enter a high probability retracement after an impulse wave upwards.
It is the 61.8% to 65% zone (highlighted in red).
How to trade it
i) Find a swing low and swing high points
Bullish
- Swing Low to Swing High
Bearish
- Swing High to Swing Low
ii) Draw fib extension line
iii) Find other confluence reasons to enter the trade besides this e.g. RSI levels, previous support levels.
iv) Wait for confirmation of some form of support before considering entering the trade as it can sometimes just tear thru

Bitcoin - Fibonacci Spirals .1Due to dynamic scaling, FIB spirals may not seem accurate. Please adjust the price scale simply by dragging it up or down so that spiral 1 crosses wick A and spiral 2 crosses wick B.
Fibonacci spirals provide the optimal link between price and time analysis and are the answer to a long search for a solution to forecasting both time and price. Each point on a spiral manifests an optimal combination of price and time. Corrections and trend changes occur at all those prominent points where the Fibonacci spiral is touched on its growth path through price and time.
You will be astonished to see that if the correct centre is chosen, Fibonacci spirals pinpoint turning points in the market with an accuracy seldom before seen. Investing based on spirals is neither a black-box approach nor an over-fitted computerised trading system. It is a simple universal geometrical law applied to different sorts of products such as futures, stock index futures, stocks or cash currencies.
Unlike several of the other Fibonacci studies, the exact methods for calculating Fibonacci spirals are kept as something of a secret. The basic idea behind the Fibonacci spiral is that a certain extreme point on a market chart is taken to be the centre of the spiral, and then a Fibonacci spiral based on the golden ratio is drawn emanating out from that centre. Certain points along the spiral are then considered to be strong indicators of market events.
The Advocates often tout the Fibonacci spiral as an extremely accurate method of predicting the behaviour of a market based on both critical times and critical price levels, rather than simply on price levels. Several pieces of software exist for calculating Fibonacci spirals on a computerised chart. The secret nature of the calculations, however, makes it difficult for a prospective Fibonacci trader to assess the actual efficacy of the device.
In general, Fibonacci spirals are generated by picking a starting point and then increasing the width of points along the spiral from the center by multiplying the width by a Fibonacci ratio for every quarter turn. In markets, this Fibonacci ratio would likely be determined by certain price levels within the market.
www.babypips.com

Harmonic Patterns - Gartley - Approach 01- AB has to touch the 0.618 of XA, but cannot touch to the 0.786 of XA
- BC has to touch the 0.618 of AB, but cannot go above the A
There are a few ways to look for D. In this approach, it is:
- Put a Fib Retracement from X to B.
- Put a Trend-Based Fib Retracement from A to B to A
- If the 0.718 and 1.272 are close to each other choose, 0.718
- Else, choose the 1.272
Targets
- the 0.382 or the 0.618 of Fib Retracement from A to D.
Stop
- X or 10 pips below

GOLD replay from 2014 using pitchfan as a projection tool.Nesta and I were throwing some projections on to gold, backtesting something we had looked at with the upward trend lines because I have noticed when I drop the trend lines on, the angles seem to follow some very fibonacci-esque ratios. So we decided to backtest with the pitchfan and see what we saw. Very interesting stuff.

Where to Start and End a Fibonacci?Fib traders look for the ''natural rhythm'' of a market.
But where exactly to place the ends can be subjective.
I make it more objective by wiggling until price tells me.
Sometimes the Highest High to Lowest Low is NOT best.
Sometimes there are long wicks so hard to place one end.
Sometimes momentum will take price further than it ''should''
While drawing the fib, drag one end up/down a bit.
Look at how the price reacted to the various fib levels.
Try to hit the most price turns with the most fib levels.

USDJPY, Fibonacci, and the Magical 110.025The wonders of Fibs
This is USDJPY on FXCM .
Left pane is Weekly chart going back to 2012.
Right panels are zoomed in views of the circled areas.
The Fib in left pane was drawn from the first impulse in first Quarter 2012.
Each of the fib extensions shown becomes relevant later.
Check the 4.0 Extension at 110.025. Not 110.000, not 100.000 but 110.025
That extension was touched once before (albeit cut though several times)
That extension was touched this month (upper right) to the pip , and twice .
Fascinating for several reasons:
1) The Ripples of a ''Protuberance'' that happened 6 years ago are still clearly in effect today.
2) This asset trades almost a $1 Trillion PER DAY by almost all banks around the globe.
3) Numerous conditions, people, and econs have changed a lot in the last six+ years.
YET, that tiny first wave six years later still directs Trillions of Dollars and perhaps Billions of People to decide that $ 110.025 is THE number of importance Right Now .
********************************************************************************************************************
I am not religious but if there IS a God, then he/she/it will be found in/by/for the Golden Ratio.
********************************************************************************************************************
-

BCH - Algorithmic Entry and Target hit beautifully!I realise it's easy to state after the fact, but BCH has produced a clear example of fibonacci entry and first target hit.
I just missed my entry as I noticed this a little late, highlighting the difference between trading and TA.
However, its impossible to miss the confluence with the entry, RSI moving above 30, divergence appearing on the EWO and the entry at the Golden Pocket.
Stops just outside the 65 needed to be careful as a cheeky wick could have caught them.
Its also satisfying to see my automatic algo, written using pine script, producing a fantastic trade set up in seconds.
Sam

Lucas Number sequence's a study on BTC Liquid IndexThe Lucas Number sequence from 0-123 is the main topic of this post as it accurately predicted tops and bottoms of 2017 bull run with a very high level of accuracy. Periods of consolidation can also be predicted with halfway points between levels and then beyond incorporating those halfway points.
Lucas Number sequence prime
N of Lucas Number prime
Lucas Number sequence
P.s What would be an interesting take on this would be using some sort of indicator to hone potential timings.

Fib extensions that could have made you a millionaire!Helloow fellow gamblers!
I was looking at Fibs at a deeper level. The more I learn about them, the more obsessed I get with them. Now Fibs r my #1 trading tool. Most of u r already using Fib retracements. This chart shows that Fib extensions can also be very useful. I created them from Nov 8 2017 drop. Fib lines that did not control key levels r removed.
This chart shows what happened in the past. Next 1 might show the future.
I don't know what u guys r interested 2 c . U can write me in the comments if u don't want me posting these kinda ideas. If u wanna c more, just press the like button.
1:peace:
/:D
- Zoom in by dragging the scales. Double click for auto scale
PS: There r some hidden stuff in this chart and only the very curious 1s of you will find it.
Fib sequence: 1 + 1 = 2 + 1 = 3 + 2 = 5 + 3 = 8 + 5 = 13 + 8 = 21 + 13 = 34 + 21 = 55 + 34 = 89 + 55 = 144 + 89 = 233 + ...
Fib extensions: 1.618, 2.618, 4.236 &1.272 & 2, 3, 4, 5, 6, ... & 4.618, 5.618, ..., and a lot more
For the nerds:
Fib extensions:
- A number divided by the previous number approximates 1.618 (21/13=1.6153, 233/144=1.6181)
- A number divided by the second previous number approximates 2.618
- A number divided by 3rd previous number approximates 4.236
- Square root of 1.618 = 1.272
- Square root of 1.272 = 1.127
- Multiples of the base: 2, 3, 4, 5, 6, ...
- I am also using natural numbers + golden ratio 4.618, 5.618, ...
Retracements:
- A number divided by the next number approximates the golden ratio .618 (13/21=.6190, 55/89=.6179)
- A number divided by second next number approximates .382 (13/34=.382, 21/55=.3818, 34/89=.3820, 55/=144=.3819).
-- Also, note that 1 - .618 = .618 *.618 = .382
- A number divided by another three places higher approximates .236 (13/55=.2363, 21/89=.2359, 34/144=.2361, 55/233=.2361)
- Square root of .618 = .786
- Square root of .786= .886
Ref: stockcharts.com
