Fibonacci

"Pulse" of an asset times Fibonacci: Bitcoin near 9.618 nowPart of my ongoing series to catalog waves within moves.
This specimen is from "Chapter 5" of my methodology.
The 9.618 extension is a very important landmark of any move.
Abrupt reversals are very common, in all assets and time frames.
"9" is an interesting number even though it is not a "Fib number".
.
Ordered Chaos
every Wave is born from Impulse, like a Pebble into Water.
every Pebble bears its own Ripples, gilded of Ratio Golden.
every Ripple behaves as its forerunner, setting the Pulse.
each line Gains its Gravity.
each line Tried and Tested.
each line Poised to Reflect.
Confluence of 2 is Dependable.
Congruence of 3 is Respectable.
Coincidence of 4 is Worshipable.
every Asset Class behaves this way.
every Time Frame displays its ripples.
every Brain Chord rings these rhythms.
He who Understands will be Humble.
He who Grasps will observe the Order.
He who Ignores will behold only Chaos.
Ordered Chaos
.
.
.
want to Learn a little More?
can you Spend a few Moments?
click the Links under Related.

Analisis tecnico y cientos de PipsPodemos ver como con el análisis técnico, con acción precio, se pueden agarran buenas y efectivas entradas, no es necesario algún indicador, sin embargo es ideal apoyarse en la herramienta de Fibonacci para tener mas seguridad de su operación.
Siguiendo los principio de Ralf Ellitot, podemos ver la estructura definiendo las 5 olas de ese ciclo del mercado, aprovechando así la tendencia, y que los pisos pasan a ser techos, para confirmar con velas de 4 horas bastante información para tomar la decisión de entrar en los trades y tomar buenas ganancias, siempre surfeando la tendencia, dejándose llevar por la ola del mercado.
Nota: En la imagen me confundi, se compra cuando techo sea piso. Claremente se ve como el techo pasa a ser piso. (No piso a techo, eso seria venta)

Strong support, what's next?Here is current bitcoin's bias on short term. we can see that the down trend channel is holding true and current price is moving just slightly above the lower line of the channel. Not just touching it, it has touched the strong psychological support which is around $8000 region. we might see a dead cat bounce from this area and challenging the previous broken support that is now become resistance around $8500 region.
On lower time frame, I haven't seen any sign of bullish pressure yet. the price keep moving sideway around $8050 - $8200 region which is not significant and not worth to enter long position for now. We must once again consider the higher time frame as a wider horoscope of potential direction of the price in the near future. The wide range of support could still be in play with a possible huge wick to the down side before it starts the bulls rally in short term. we must to be very reactive and very cautious at this levels, considering the wick fish is becoming the natural behavior a past movement.
I am still waiting for potential dead cat bounce, but I don't think that this is the right time to enter long position.

Is This a Coincidence?Bitcoin, if you still remember my yesterday's post about bitcoin, this is once again coming through and yesterday's candle has the alignment with our yesterday's analysis. The price is coming very close with the golden pocket zone around the $7000 region. And I really think the dead cat bounce will occur at this area when the price reach the current support level. But, the REAL key support will be around the 78.6 fib retracement levels which is becoming the last fibonacci levels of confluence.
Looking at the 78.6 fib level, which is becoming the key support, we must see and extend the price action that occur at this rate of support. we have known that the price is having confluence with the previous key and critical bounce in the market.
It has the confluence with the broken resistance on October 2017 and with the broken support at November 2018. Just like what we know, the first resistance is the first time the price start the up trend rally on 2017 and the second confluence, is the first time the levels confirm the down trend back at 2018.
Is that a coincidence? There is no way such as coincidence in the market. If we see this from the psychological factor, Current period will be a good period for bitcoin to show the world and the stakeholders that bitcoin is worth to be aligned with another safe haven instrument. Beside, the adoption that happen recently, this will be a good consolidation phase for bitcoin. I don't see current potential down trend as the "real" down trend, I see it more like a good consolidation during the huge up trend upcoming.
I don't care if the price may touch the $6000, $5000 or even $2000. As long as it has the adoption of the blockchain, I will keep doing the dollar cost averaging. Because Blockchain will become the future of all financial aspects in this world.

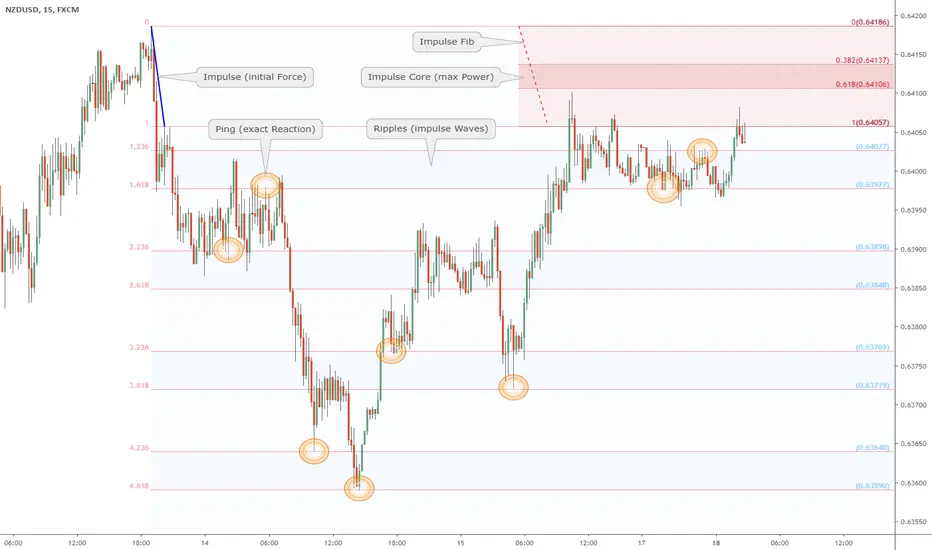
"Pulse" of an asset times Fibonacci: NZD.USD minor Impulse Redux"Impulse" is a surge that creates "Ripples", like a pebble into water.
"Impulse Redux" is returning of wave to the original source of energy.
"Impulse Core" is the zone of maximum energy, in the Golden Pocket.
Are the sellers still there? Enough to absorb the buying power?
Reaction at Impulse is worth observing closely to gauge energy.
Rejection is expected on at least first approach if not several.
This particular study is of NU after surprise RBNZ rate decision.
Initial spike up (just to the left) was faded by this Impulse Wave.
This Impulse Core will help determine whether buying will continue.
This is part my ongoing series to collect examples of my Methodology.
.
.
Ordered Chaos
every Wave is born from Impulse, like a Pebble into Water.
every Pebble bears its own Ripples, gilded of Ratio Golden.
every Ripple behaves as its forerunner, setting the Pulse.
each line Gains its Gravity .
each line Tried and Tested.
each line Poised to Reflect.
every Asset Class behaves this way.
every Time Frame displays its ripples.
every Brain Chord rings these rhythms.
He who Understands will be Humble.
He who Grasps will observe the Order.
He who Ignores will behold only Chaos.
Ordered Chaos
.
.
.
want to Learn a little More?
can you Spend a few Moments?
click the Links under Related.
Golden pocket and MACD golden crossover?Hello all, welcome back to the Sunday market update! Beside the sideways moves during the movement of last week, here it comes again the interesting in the crypto market. Patience is the key before you jump in the market for now. Let's do this technical analysis about bitcoin.
Like what I've shared on the previous analysis of the bitcoin, $8500 is moving align with the golden pocket zone and the $8000 is moving align with the .786 fib levels and both levels obviously are a major support that must be respected so far. The $8000 is a huge psychological zone for bitcoin, Huge price action activity has occured in this level which is great!
Knowing that current price is moving just near the golden pocket zone as a great support, we must realize that the moving average line on MACD is having a big probability to do a golden crossover on 4 hours chart. The RSI has shown us a bullish divergence with lower low on price action but higher low on RSI. This is a perfect set up for long opportunity.
I will open a long position if the price claims back the $8700 as the shadow support respected and of course when the golden crossover occur on the MACD dynamic line. Patience is the key, waiting will keep you on the track.

"Pulse" of an asset times Fibonacci: XTC sport of Golden GrowthThis Concept is part of my ongoing study of Fibonacci Ratios applied to Assets.
This Chart captures a spurt in XTZ.USD (Tezos) which grew with perfect Ratios.
This Case belongs in " Chapter 5: Golden Growth " of my " Pulse of an Asset " series.
This type of growth has been called "Exponential" or "Parabolic" by many analysts.
This occurrence is actually NOT very common in markets at a scale we can see.
This DOES occur at microscopic levels but is difficult to capture at those levels.
This is part my ongoing series to collect examples of my Methodology.
.
Ordered Chaos
every Wave is born from Impulse, like a Pebble into Water.
every Pebble bears its own Ripples, gilded of Ratio Golden.
every Ripple behaves as its forerunner, setting the Pulse.
each line Gains its Gravity .
each line Tried and Tested.
each line Poised to Reflect.
every Asset Class behaves this way.
every Time Frame displays its ripples.
every Brain Chord rings these rhythms.
He who Understands will be Humble.
He who Grasps will observe the Order.
He who Ignores will behold only Chaos.
Ordered Chaos
.
.
.
want to Learn a little More?
can you Spend a few Moments?
click the Links under Related.

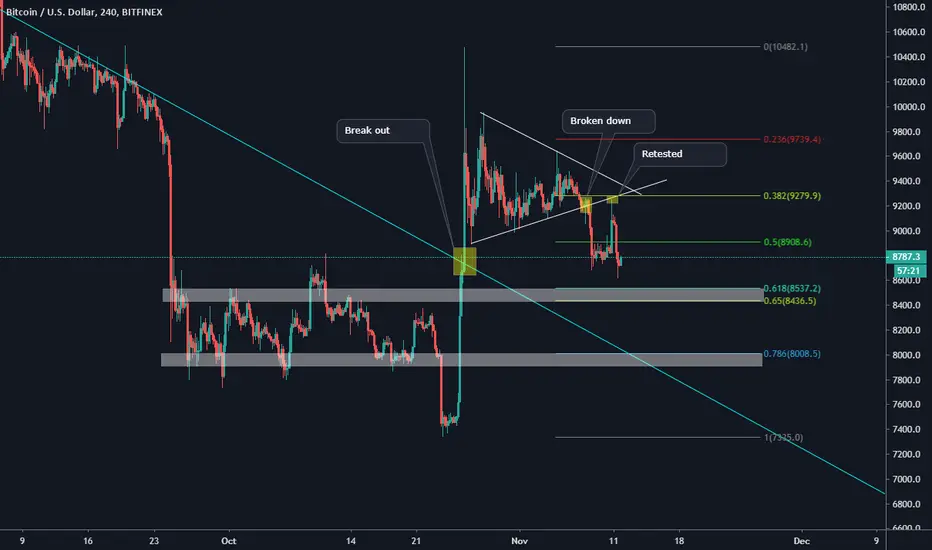
The Precision of Break Out StrategyHello All! Welcome back with me in this another bitcoin analysis. First of all, I want you to look at my previous analysis about shadow support on bitcoin in this article which is holding true. We have seen a spike to test the previous broken support that is now become resistance.
On this chart, we will cover the mid term view of the bitcoin's movement. First of all, I want to repeat again the knowledge of the break out strategy that I am using. So, here it is :
1. Initial Break Out : is the initial try of the price to surpass the support or resistance and on the higher time frame, we see it close just out of the current range.
2. Retesting the previous broken level : Just like the basic terminology, what ever that goes up, it will retrace to find another point of interest. In this case usually we see a pull back after the broken out of the previous support or resistance. Usually we saw a rejection toward this previous s/r and this will be our ideal entry for longing or shorting.
3. The real Break out : Price will start its rally after the phase 2 get a clear confirmation.
Therefore, I see in the mid term, there might be a potential reverse in price to the blue resistance trend line. because since the initial break out of this resistance trend line, we haven't seen any test toward this previous resistance that is now become support. And within this terminology, I personally very interested in looking for the fibonacci level to determine which will be the candidate for support level. I see these 2 levels, which has confluence zone with the resistance trend line. They are the golden pocket around $8500 and the 78.6 fib retracement around $8000. However, this 2 levels of support was previously become a price range since September 25th until October 20th.
Although there are a lot of bearish bias that occuring in the market, I am still hoping that the $8000 can hold the price from further drop. Drop from current level will cause the chance of the price hit the $6000 or lower will getting bigger.
THE CORRECT WAY TO DRAW FIBONACCIHello everybody,
I thought i would share after seeing countless tutorials on how to draw the fibonacci WRONG , when it comes to drawing the fibonacci on the impulse you do NOT draw it on the candlesticks.... The candlesticks and wicks lie! Old school way of trading is on the line chart, where the original traders won their trades. Blessings! Like or comment below! Thanks

2020 BULLISH GOLD??During the potential global market recession in the next 1 year, gold can be one of several options for investment to hold. we will see gold pushing high to the $1600 or even the $1750 region as well. Beside the fundamental stats that show us a heaven in gold, the elliot wave is looking impressive too.
Talking about elliot wave analysis, we can't separate is with psychological factor in the market. we have seen a frustating market consolidation since 1980 - 2004 and I will classify this phase as the 2nd wave which form a flat pattern of correction. And based on the elliot wave rules and guidelines, If the wave 2 forms a flat pattern that usually is more complicated, the wave 4 must be more simple than wave 2. Therefore, I assume this wave 4 as a simple zigzag.
The next assumption is about where will the correction ended. Looking at the previous wave 2 which retrace at the 78.6 fib retracement, therefor I will assume that wave 4 will retrace Not more than 78.6. and based on this rules and guideline, it moves align with confluence zone at golden pocket and 1.1 fib extention.
2020 will be bullish at the beginning of the year, but reaching the end of 2020, the great depreciation of gold will likely to happen.

USDZAR Educational PostHappy Wednesday! As we continue our study of this pair USD/ZAR we see price is at a very key point in the market. The market opened on Sunday with a gap. Price continued it's descent and pulled back to the 38% key fib level, which is also right at the market open gap point. Will price trade above Sunday market open, which will lead us to higher price, or will price continue down after the pullback (rhetorical question). For now it's a good watch or perhaps a scalp. This is a study for demonstration and educational purposes only. Thanks for studying. We should visit back and play forward to see how price reacted, which helps us to build knowledge for future trade ideas. Sometimes the best trade to make is no trade at all, while we study price action. Please note, the arrows are not pointing towards a particular take profit area, but I am showing that price COULD reach these points. How do we know for sure? WE DON'T. We must continue to study price action along the way to gain better insight. Price action and market structure is EVERYTHING when studying for trade ideas. Price doesn't have to reach particular points. We see what the market is doing and REACT accordingly. Protection of capital is key. Please study progression of my previous ideas below to aid in your study. Study is most important versus taking signals. You build knowledge to call your own trades, independent of others traders ideas which are all speculation as well. We can only speculate, not dictate the markets. Feel free to offer your comments as well as we study the markets.

BTC Short term viewHello fellas, welcome back with bitcoin update again and again. Coming to the consolidation zone, we can see a lot of frustation and a lot of uncertainty has came to this crypto space. The only good view is on the altcoin market which is holding its most of the bottom support. A coin like Omisego, Nano, and Stellar (beside the coin burn fundamental) has surged up from its bottom, this will once again become the indication of increasing attraction of free money to this altcoin market.
Coming back to the bitcoin insight which always phenomenal and being unpredictable, I want to analyze it in short term view and in lower time frame. Based on my technical analysis, we can easily see that the $9500 has been a very very huge resistance for bitcoin. In last few days, we have seen a very sideways market. But, slowly the price is forming a higher low structure since October the 26th, 2019. Therefore, it forms like an ascending type of the triangle. Although a lot of bearish pressure has intimidate the bulls for a long time, but the bulls still remain strong and consistent at least at lower time frame. I could change my bias from bearish to bullish short term as if the price can break the $9500 and we can see a push further toward $9700 or even the $10000 region. But, as long as the resistance is remain valid, I am still bearish short term.
Anything can happen in crypto market.

The Fibtory of a asset Bitcoin First, this is not to give you financial advice on when to buy or sell. It has proven a strong indicator for me over the history of bitcoin.
It is a lot of colors to some but, Fibonacci always has a way .
This is to discuss Bitcoin as its chart solely show. I am not bullish on any market like this but, I will trade on what I see within the charts

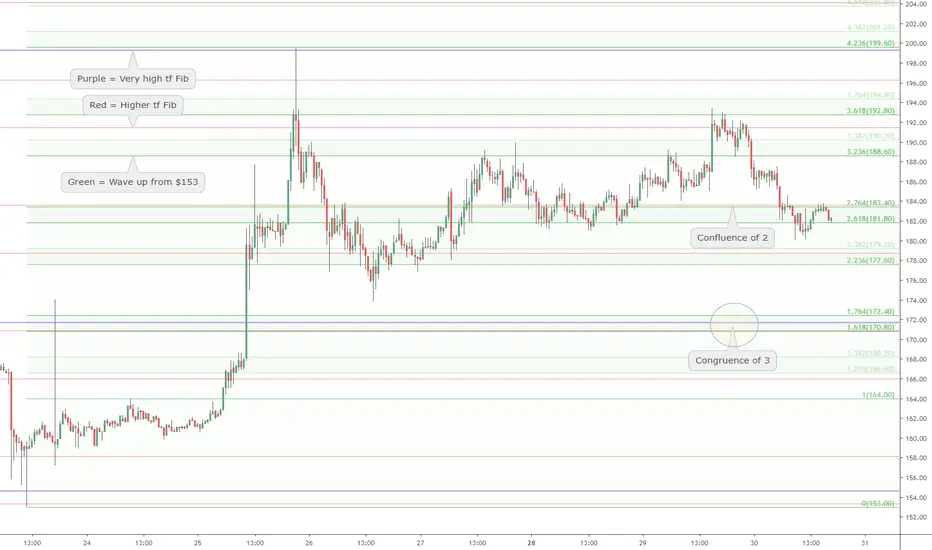
Ordered Chaos: "Confluence of 2": ETH Fib Map of Energy BandsEther is at an important resistance.
Either it breaks double fibs above,
Or it will reload at triple fibs below.
Green Fib is pushing upward.
Red Fib is pushing downward.
Purple is pushing downward.
Each Fib and its Ripples are noticed.
2 Fibs aligned increase the energy.
3 Fibs aligned amplify even more.
Part of my ongoing series to share my methods.
.
Ordered Chaos
every Wave is born from Impulse, like a Pebble into Water.
every Pebble bears its own Ripples, gilded of Ratio Golden.
every Ripple behaves as its forerunner, setting the Pulse.
each line Gains its Gravity.
each line Tried and Tested.
each line Poised to Reflect.
Confluence of 2 is Dependable.
Congruence of 3 is Respectable.
Coincidence of 4 is Worshipable.
every Asset Class behaves this way.
every Time Frame displays its ripples.
every Brain Chord rings these rhythms.
He who Understands will be Humble.
He who Grasps will observe the Order.
He who Ignores will behold only Chaos.
Ordered Chaos
.
.
.
want to Learn a little More?
can you Spend a few Moments?
click the Links under Related.
Potential Money inflow in most of altcoinsHello fellas, In this current post, I will discuss about the crypto total market capitalization especially in altcoin market. So, what is the definition of market capitalization? Market capitalization refers to the total dollar market value of a company's outstanding shares of stock (in this topic the "outstanding shares" refers to "circulating supply"). So, here we go fellas!
I am using the TOTAL2 which is the quote of crypto total market cap exclude the bitcoin. we can see on above chart that currently the value of altcoins is around $71 Billion. I do believe that this value will increase significantly until the end of the year. Based on technical side, it bounced from the 78.6 fibonacci retracement level. This area is known as the flavor of the year because most of the instrument has bounced when it touched this level back in 2018. This is simply the last support level before the previous swing low to make it double bottom pattern. If this bounce hold true, we will see the capitalization of the altcoins enter the $100 billion range again, refer to the golden pocket zone as well. Beside the $100 billions is the psychological number as well.
If we see the capitalization increases, this will become a good indication of altcoins. we will see a tremendous money inflow to the altcoins market which will affect the price of most of altcoins. I do believe most of altcoins will have a beautiful end of year movement and bullish month ahead is coming for altcoins.
This statement is having alignment with bitcoin dominance that shows a down trend pattern. I will assume the money inflow to altcoins is coming from money outflow from bitcoin's market.

"Pulse" of an asset times Fibonacci: Gold has Golden Rhythm Duh!Gorgeous example of the true structure of a wave.
Gold and namesake Golden Ratio in perfect harmony here.
This example is so perfect I felt it worthy of materialization.
Notice the very precise turning points, which I call "Pings".
Each Ping adds to validity (faith?) of ALL the other lines.
It will take a new Impulse to shake Gold free of this rhythm.
4.236 is 1.618 cubed, how perfect of a number is that?
5.236 is the fomo push, late comers jumping on train.
3.236 or 2.236 are the most common retracements.
This is part my ongoing series to collect examples of my Methodology.
.
Ordered Chaos
every Wave is born from Impulse, like a Pebble into Water.
every Pebble bears its own Ripples, gilded of Ratio Golden.
every Ripple behaves as its forerunner, setting the Pulse.
each line Gains its Gravity .
each line Tried and Tested.
each line Poised to Reflect.
every Asset Class behaves this way.
every Time Frame displays its ripples.
every Brain Chord rings these rhythms.
He who Understands will be Humble.
He who Grasps will observe the Order.
He who Ignores will behold only Chaos.
Ordered Chaos
.
.
.
want to Learn a little More?
can you Spend a few Moments?
click the Links under Related.

"Pulse" of an asset times Fibonacci: Bitcoin's 3rd Golden GrowthBitcoin has been expanding at the true Golden Ratio, 1.618 increases.
Bitcoin has had three such waves growing out of the 3.1k bottom in 2018.
Previously, every bottom to peak cycle has been of a similar type (1.618x).
This growth pattern is the only way Nature grows any object or life-form.
It is not as common in financial markets, except for in bubbles and Bitcoin :)
Common is a "Linear" growth (2.618, 3.618, 4.618, ..9.618) as are most of my fib plots.
Notice the relevance of each of these lines when approached from either side.
Like rips in the Time-Space, all matter/energy must pause, retract, reconsider.
The entire energy/money/emotion somehow reacts exactly at 9574 and 19 cents!
Thus the unseen Order behind the observed Chaos.
.
.
Ordered Chaos
every Wave is born from Impulse, like a Pebble into Water.
every Pebble bears its own Ripples, gilded of Ratio Golden.
every Ripple behaves as its forerunner, setting the Pulse.
each line Gains its Gravity .
each line Tried and Tested.
each line Poised to Reflect.
every Asset Class behaves this way.
every Time Frame displays its ripples.
every Brain Chord rings these rhythms.
He who Understands will be Humble.
He who Grasps will observe the Order.
He who Ignores will behold only Chaos.
Ordered Chaos
.
.
.
want to Learn a little More?
can you Spend a few Moments?
click the Links under Related.

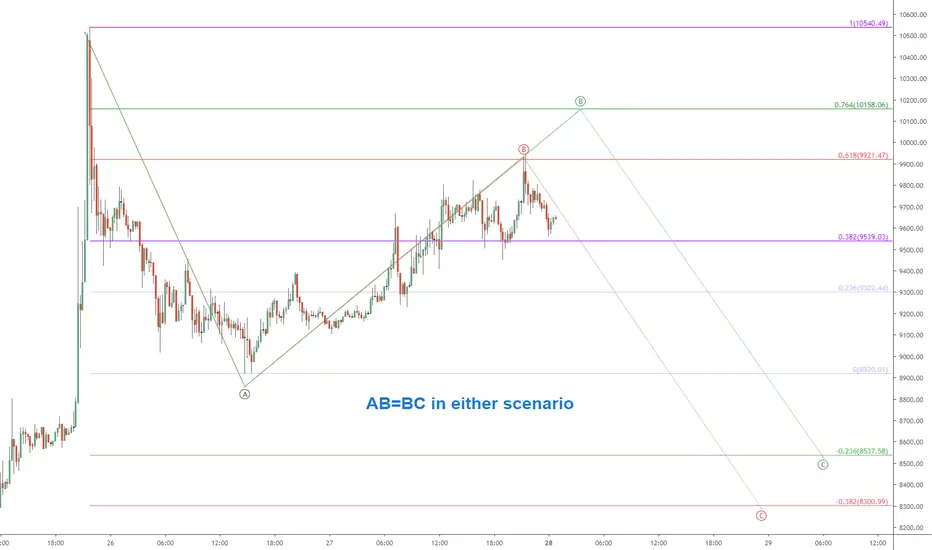
BTC.USD example of a quick use of "Fibonacci Retracment" tool Posting as example in real time of a quick and easy measure.
This plot shows two possible pathways of an "ABC Correction".
Both options map an AB=BC (equal legs) move that is common.
The above chart uses TV's "Fibonacci Retracement" tool.
After placing the fib, I go into its "Settings" and make changes:
- un-checked the "Background" option (thus no coloration)
- un-checked many of the levels (and added some of my own)
- Changed the color of some levels (to pair the red and green ones)
The Fibonacci Retracement tool can be used as a custom Ruler.
You can set ANY ratios/increments, say (.25/.50/.75) or (.1/.2/.../.9)
You can set "Retracement" (+) as well as "Extension" (-) levels as needed.
Normally I use multiple such Fibs to map the bigger picture.
But this simple example occurs in all assets in all time frames.
Also, which level it reaches says something of the strength of move.
BTC (Prj.Y19.P6.TEST).Video.Recording.TESTJust ignore.
I'm trying out the video recording and publishing function for the first time.

Manipulation, Death Cross and Xi Jinping's statementHello fellas, welcome back to our Saturday update about bitcoin. Let's get to the point
We have seen a 40% surge on bitcoin in 1 day of trading. However, even in crypto industry, this is still a tremendous moves so far and unfortunately, once again it indicates that the crypto market is showing its unstable circumstance which can easily manipulated. Just right before the 40% surge, the China president, Xi Jinping shared his view about bitcoin and announce a support on blockchain in China. However, this gives a tremendous effect on crypto market. Altcoin's market lose a lot of volume but on the other hand, money inflow in bitcoin is growing even faster.
I believe that it is only the manipulation that some parties made to wipe out the people who short the market. I do expect a little pullback to the upside but I never thought that it was this tremendous. I am a type of the people who don't believe in fundamental analysis, I am 100% technical believer. All the short term spike is just manipulative as always. Now, look at the higher time frame of daily chart.
After the 40% surge to the upside, today's candle produce the 12% wick of rejection and is still moving below the white resistance region. this white resistance region was the broken support that is now become resistance as well. And the white trend line is the resistance trend line that has held the price since june 26th, 2019. As long as the price is still moving below this trend line, I will still remain bearish as well.
Another view on another technical indicator, which is EMA 55 and MA 200, we can easily deduce the death cross has already occured. However, death cross is always be the most respected factor to look for most of swing traders. I am expecting a daily candle closure will be below the EMA 55 which is the blue dynamic line to confirm this continuation of down trend.

EURUSD LONG EURSD is a perfect example of market structure, as it has formed LL and LH before breaking the trendline and forming HH, now we wait for the price to come back to the FIBONACCI level which is also a HL before pulling the trigger

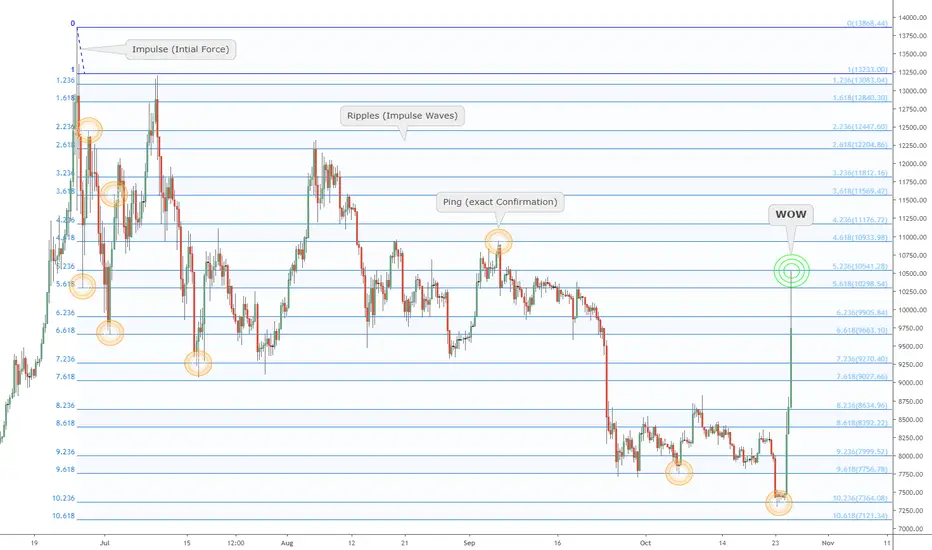
"Pulse" of an asset times Fibonacci: Bitcoin's Best "Ping" yetOctober 25th 2019 has been one of the most volatile days in a long time.
Yet, even during extreme stress and massive moves, the FIB still RULES.
This "Ping" of the 5.236 and huge reaction was FATED as of Jun 26th 2019.
This is part my ongoing series to collect examples of my Methodology.
.
Ordered Chaos
every Wave is born from Impulse, like a Pebble into Water.
every Pebble bears its own Ripples, gilded of Ratio Golden.
every Ripple behaves as its forerunner, setting the Pulse.
each line Gains its Gravity .
each line Tried and Tested.
each line Poised to Reflect.
every Asset Class behaves this way.
every Time Frame displays its ripples.
every Brain Chord rings these rhythms.
He who Understands will be Humble.
He who Grasps will observe the Order.
He who Ignores will behold only Chaos.
Ordered Chaos
.
.
.
want to Learn a little More?
can you Spend a few Moments?
click the Links under Related.