Where to target and what to do once there?I've been bad. I've been greedy with having "strong hands" when I had some 5 to 7R, really should have gotten out when it started retracing. How do I let it go from over 5R to -1? From March-April to September 2020 I got baited. There was oil, there were all the USD trends in summer, and they all went rather far. After this I wanted to keep running my winners, I was not sure exactly what I should do, I was busy with other things to look into it (finalize a strategy and add 2 new ones to my pool of 2 + 2 I don't use so really double my setups) I just went for hold but on top of that I forgot about my positions and let them run (reverse) forever without paying much attention.
I spent 2 years on just 1 strategy (+2 I do not use) from mid-late 2018 to mid-late 2020. Took me I'd say around 10,000 hours of backtesting, trial and error, and so on, to make it right. Added a new one in 6 months (all day every day), and then in early 2021 damn it's actually recent I casually added 2 in a few days no sweat. My first strategy has a fixed target, or had, actually I am not entirely sure what to do here. But more generally I spent 4 years not really know what to do once the price got to the target area, should I trail with a tight stop or wide or just get out? But now I know.
It is a long road. The basics however, they are instant. No work required, it only depends on the individual they either get it or they don't. It's like you start with an edge from day 1, at +1% and then you spend a whole lot of time to bring that to +20%. People at -100% the huge losers don't "just do the opposite" and end up at +100%. Don't think brokers checked? The big losers take 20 trades a day. They have 0 edge positive or negative. And winners mostly follow the trend, risk a little to make a lot, and hold. It's just that for optimal results they learn to not always hold. No, not "after having learned to hold", there is no unlearning. Those that don't hold from day 1, just bad, no hope. At least according to academics, regulators and brokers. People that don't hold winners from the start never make it. Simple stats.
Getting started with targets is really easy. Entry does not matter, target is easy, stop too. Everything doesn't matter or is easy with investing.
First, the observations (non exhaustive):
There are 2 approach:
1- The robot. Throw a ball, the dog sees it, gets excited, chases the ball. The market throws some bounces, the "day" or "swing" trader sees them, gets excited, and chases. No added value, no intelligence. The price bounces, but in a very wide area and the bounce amplitude is random. So they think they found a holy grail, because damn they're onto something clearly no one noticed the price bounced on supports, and they insist on awful "strategies", try to make it work with 3 to 1 risk to reward, very far away stop since it bounces randomly around support, and the target is terribad for obvious reasons. Wide stop tiny target.
2- Since the price will bounce from moderatly to a lot, use this area as a target, and when the price starts reversing we know it probably will retrace significantly so we jump off the ship. The second approach is also buying in a downtrend on these supports same as 1-, but after having sold. So the "edge" noobies think they see and absolutely want to "take advantage of" is exploited this way, it is literally the same buying at supp. But I don't know I guess everyone today is terrible at math and logic they can't even think of buying at support without it being a ridiculous countertrend 0.3 reward to risk gamble, doesn't even cross their mind. You actually get to buy at support.
What is funny is they see the price breakout, then go in a straight line to the next level, and they somehow get all excited "I'm going to buy". No one wants to sell? Brain not working properly. Makes no sense.
It is rly binary, you either get it or dont. It is a skill check (or is it attribute?) like in RPG games. Which is nice since you get to know very fast if you will make it or not, no need to waste 5 years. I saw (and regulators + brokers tell us) there are some degenerates that have been losing for 10 years and still continue. I saw someone on youtube that has a 20 years long "career" and all he has done is lose! For 20 years! He even describes his 20 years of failure in a video, his wife almost left him and he had many struggles. He sells robots now, trying to get some of what he lost back. He probably thinks he was "so unfortunate" it is ok to scam people. "The kid has heart", ye that's what you say about losers. Just means someone is dumb enough to insist when something is clearly not working for them.
There is not much more to it, the basics that is. Then from here getting good targets takes grinding, experience? Only way I know how to is with stats, even the "not stats people" look at the past and gain experience by "working out" like PTJ did to predict 1987 crash. He isn't a quant but still looked at the past. Even Warren Buffett learned from experience and made stats, I guess his targets are something like "how expensive" with variables "market emotions" and "interest rates" but he knows when expensive is too expensive based on statistics (that he read or experienced over the decades) not based on magical fairy dust.
What to do at target? Well this is a long story. So many possibilities and ifs and buts. I'm going to show 2 examples and call it a day.
There is a lot of stuff on the chart, it's not very clean, looks like a "technical analyst" or day trader chart, sorry. Obviously investing takes more than drawing 2 lines, there are going to be several conditions to enter, several conditions to where to enter, several things that go into the stop, the target, etc. A board hitting its head on a keyboard can't make money. The same way I doubt a robot mindlessly buying when a stock hits a P/E of 5 would make money, investors look at cash flow, management, past revenue, book value, competition, and many other things. Simple things, but several of them (not 1 million numbers either).
So once the trade is entered, and target is at 6R:
And yes it does not stop at every support, sometimes it fires past target:
And finally, of course:
Can be good places to add (after the bounce took place)!
Fibonacci

SINPER CONFLUENCE TRADING OANDA:GBPUSD
confluence trading is just multiple reasons stacking up in your favour to take the trade. you should always have some sort of validation to take a trade... my trading style consist of fibonacci levels, psychological levels, support resistance, trend line bounces and much more.
one thing to remember is the more confluences you have the more confident you should be in taking the trade. in this example ive shown how you could plot your confluences for you to find a perfect entry with minimal drawdown. take your time to backtest and practice. get your eyes used to seeing these set ups occurring.

We keep short in 6E - Weekly chatHello Traders
In the absence of today's close to analyze volume. the euro/dollar future is still short, at least that is the information that the volume indicator says.
The fast volume indicator just gave a short signal, also the slow volume indicator confirms the short trend.
If the price closes below the 38.2% fibo there is a good chance that it will go for the 50% fibo, exactly 1.15.
Keep it simple and mechanical
Have a good day!!

Fibonacci Extension Tool (How To Use)How To Use The Fibonacci Extension Tool: Bearish example (like Chart)
A) Highest Top Point
B) Reversal Bottom Point
C) 2nd Highest Top Point (Note) Can NOT be higher then A Point.
D) Will be 3 points or targets, 1st target at 50% extension, 2nd target at 100% extension & 3rd target at 150% extension.
The rules for take profit orders are very individual, but most traders use it as follows:
A 50, 61.8 or 78.6 retracement will often go to the 161 Fibonacci extension after breaking through the 0%-level. A 38.2 retracement will often come to a halt at the 138 Fibonacci extension. Fibonacci extensions to the price moves. As you can see, the extensions provided great places for take profit orders.
Conclusion: Fibonaccis are multi-functional
This demonstrated how to use Fibonaccis efficiently in trading. Don’t make the mistake of idealizing Fibonacci s and believing that they are superior over other tools and methods. Fibonacci is a great tool to have and can be used very effectively as another confirmation method. Whether you are a trend following or a support and resistance trader, or just looking for ideas how to place your take profit orders, Fibonaccis are a great addition to your arsenal.

Fib Retracement and Fib Extension Difference and UsesI am trying to learn and share what I have learned. Here is a tutorial on how to use Fib Retracement Tool and Fib Extension Tool.

The 50% to 0.618% Fib Retracement AreaIf you look on many daily charts you will see, that the 50% to 0.618% Fib Retracement Area is often a core support point for any swing on the daily chart.
This can be used as part of your strategy and/or edge

Entries live examplesHere is an update to my previous idea on entries. I kept rambling on and on so this was too big for an update. Since you can't possibly cover the entire subject even in an entire book, let's go with 2 examples live, not in hindsight. They might (probably maybe even) just fail. Maybe I'll start a new idea with more 3-4 new ones, so we can look at entry + getting stopped (-1R) + trailing + target etc.
Or maybe markets start trending a lot and I'm absorbed and can't be bothered posting. I don't know. Don't have a crystal ball.
I want to update this with 2 live examples, and see how they go (probably both lose)
1-
Here is an example where you only need a 15% winrate to make money.
Price sometimes consolidates, stays within a range, and then goes down, at least often enough to breakeven right?
Oh ye this goes beyond entry but basically before analysing much, the "pattern" or "price action" in itself should at least breakeven, it should have a chance to work.
The risk being limited is what matters, like George Soros with the bank of England, he entered where he was close to "being wrong" (without being greedy trying to enter 5 pips from stop), same with Buffett, he enters when things look bad and could be about to turnaround or it could just be "the end" so he enters close to "being wrong". I don't like the words being wrong because this is not what it is, call it instead "trade invalidated". If I say something happens 20% of the time and it happens 20% of them that does not make me wrong 80% of the time, but rather right 100% of the time.
This is something I did not mention before: as far as I, and everyone who isn't a troll, can tell: the price in sideways is random. So it does not matter where you enter in that area. How dense is it to try to catch the "magical perfect entry" in a RANDOM price action? You don't know where when why the price will go. If there was a magical entry then people could trade these sideways and make money, and to my knowledge the only people that do are retail day traders on the internet.
This is not the best setup, but no setup is ever the best anyway so...
Disclaimer: I am short NZDUSD. Net position will be short EURUSD actually XD
But the EURUSD price action was just bad ye I don't know where to enter so it matters. The NZD isn't looking that bad after all. The EURUSD I think goes down, but chart looks disgusting, no way I can tell where to enter. Random sideways in a small area versus random sideways in a giant area. The different is risk to reward.
Find the tool to express your ideas with the best RR. Now there are some added spreads but it's fine, not like I day trade with a stop 3 times the size of the spreads.
And I might rotate back to being short the NZD, I kind of adapt all the time. If I get stopped on EURNZD and I have no good opportunity to short EURUSD or my opinion of it going down diminishes (it's not binary by the way you have to think in probas), and NZDUSD continues down, well in that case I won't be short EURUSD anymore, and might even increase my NZDUSD size (but only when a pullback happens).
So ye that part is binary for me, and for Warren Buffett too by the way:
Me: No pullback I don't buy
WB: No discount, no PE below 10 (or something) = I don't buy. But I don't care about catching the very bottom or having an exact precise entry.
Since Warren Buffett does it that way, and made billions, I think it's safe to say it's ok to do it that way too, even if he traded "investing" markets and we are talking about "hedging" markets here.
2-
FOMC on the 22. Might have to wait until then, or Monday at least (market could move Monday in anticipation).
Here I think the entry matters :p The number might not (oh yes actually it does) but the date does (or more). Odds of it being a coincidence are really low.
Statistically this has absolutely NOT been a coincidence.
Here I'm supposed to emphasize the "been", and go "past performance does not bla bla bla" I mean... If I have to explain this in the first place... If an "individual investor" needs this explained to them, well this is the wrong job for them. This is so trivial.
Ye, the stupid pattern might repeat itself, I'm willing to risk 1 to make ??? 10? If it keeps going? Past bull markets lasted 1.5 - 4 years so statistically I could make 10 or more.
I don't have any clear stats on this pattern, how often do they repeat themselves, would be too simple, anyone with more than 2 fingers and the ability to spell their name and count to 10 would make money. Which is not everyone, USA universities have "special classes" for "high school graduates" that are illiterate and have a lower math level than ravens.
So... with everyone becoming suprisingly dumb, AND the "dumb money" getting interested in the market... my odds of winning and making money go up.
There is much more to take into account, like the FED manipulating markets.
But here the entry matters. Like when you have something that had 1/65 million odds of happening, you can't ignore it. You could say "hey maybe they created this on purpose to trick people"... That isn't a real thing. By experience it does not happen, again, statistically.
FOMC is the 21-22. FX & commodities should move too once "certainty" comes back. Inch'allah things get moving on the 20 (monday), but either way we should go allelujah on the 22. Praised be Yahweh for making some people smart and some people dumb. And Dionysus if things don't work out.

The Fibonacci Golden RatioThe Golden Ratio: After opening, few numbers in the Fibonacci series, the ratio that will appear after every greater number will equivalent to .618, whilst the lowest number will be 1.618. These two important numbers are known as the Golden ratio. Example divide Fib #: 34/55= 1.618
Fibonacci numbers were first introduced in European countries, which was still using Roman numerals with the decimal system or the Hindu-Arabic numerals as presently used. The Fibonacci sequence: 1,1,2,3,5,8,13,21,34 and so on to infinity, is made by adding the two previous numbers in the sequence, to come up with the next number. Golden ratio is connected to Fibonacci, as it was recorded that just after the first few numbers in Fibonacci sequence, ratio of any number to the next higher number is approximately .618, and the lower number is 1.618. These two numbers are known as the Golden ratio.
Trading golden ratio means that traders need to find previous high or previous low on the wished trading chart (daily high or low, weekly high or low, etc.), and then to analyze significant retracement price levels typically translated into percentages such as 23.6, 38.2%, 50%, and 61.8% on the chart. Golden ratio trading strategy represents a strategy where traders buy or sell assets using retracement and expansion levels for stop loss, entry price, and target price.
What Can Fibonacci Do For You?
1) Fibonacci shows us where to place stop-loss levels. Any trader can apply these numbers to make a stop loss level. For example, if at least three price levels of Fibonacci numbers appear with a different and tight spot, then a dealer can put a stop loss either under or above the spot to settle down things.
2) Fibonacci determines position size. Position size can be determined by the Fibonacci, which relies on the level of risk you take in your deal. For example, if the prices are exactly on a required level, then at that time, you would probably wish to have multiple positions that could move your price further.
3) Fibonacci defines targets. In Fibonacci numbers, when the pattern has finished in a price zone, you can take advantage of it to profit. This objective will assist the traders in being analytical in their strategy.

Fibonacci Expansion (How To Use)PLOTTING A FIBONACCI EXPANSION:
- Select the Fibonacci Expansion Tool
1) Start From The Top Of The Trend (In A Down Trend)
2) Set The Middle Point Where The Correction Started
3) Set The 3rd Point, Where The Correction Ended
Possible Target areas and/or zones are plotted below this 3rd point for you to utilize as per your risk management and trading style.
*For an uptrend set up you would just need to turn the above upside down, not hard but will help lessen your stress when trading FX.

How to use the Tick and Price Action Indicator for NQ 5 minuteHow to use the Tick and Price Action Indicator in concert with Value Area for NQ 5 minute
1) Identify the fibonacci extensions based on previous day value area
2) Activate developing VA for the current day
3) Apply the Tick and Price Action Indicator and follow the arrows and colours
4) Enter only if NQ is trading outside of the current day Value Area (see your developing VA for this as outlined in step 2)
5) Use the fibonaccis in step 1 for support/resistance

Fibonacci Extensions Part 5What Are Fibonacci Extensions?
Fibonacci extensions are a tool that traders can use to establish profit targets or estimate how far a price may travel after a pullback is finished. Extension levels are also possible areas where the price may reverse.
Key Takeaways:
Common Fibonacci extension levels are 61.8%, 100%, 161.8%, 200%, and 261.8%.
The Fibonacci extensions show how far the next price wave could move following a pullback.
Fibonacci ratios are common in everyday life, seen in galaxy formations, architecture, as well as how some plants grow. Therefore, some traders believe these common ratios may also have significance in the financial markets.
Extension levels signal possible areas of importance, but should not be relied on exclusively.
The Difference Between Fibonacci Extensions and Fibonacci Retracements
While extensions show where the price will go following a retracement, Fibonacci retracement levels indicate how deep a retracement could be. In other words, Fibonacci retracements measure the pullbacks within a trend, while Fibonacci extensions measure the impulse waves in the direction of the trend.

Fibonacci Retracement Definition Part 4Fibonacci Retracement Definition Is:
In finance, Fibonacci retracement is a method of technical analysis for determining support and resistance levels.
It is named after the Fibonacci sequence of numbers, whose ratios provide price levels to which markets tend to retrace a portion of a move, before a trend continues in the original direction.
A Fibonacci retracement forecast is created by taking two extreme points on a chart and dividing the vertical distance by important Fibonacci ratios.
0% is considered to be the start of the retracement, while 100% is a complete reversal to the original price before the move.
Horizontal lines are drawn in the chart for these price levels to provide support and resistance levels. Common levels are 23.6%, 38.2%, 50%, and 61.8%.
Yes, you can add or change any and/or all of these numbers to your trading style- they can be used to enter a trade, set stop loss and targets.
This retracement percentage lines are short term reversal areas to possible take new trades with the main trend of day, week or month.

Fibonacci Retracement Entries Part 3Fibonacci Retracement Tool can:
1) Give you Support lines or areas
2) Give you Resistance lines or areas
3) Where to enter a trade
4) Where to place your stop loss
5) Where to place your target profit (use the Fibonacci extension tool for profit targets)- where price action MIGHT go too.
Your trading will be easier if you use the Fibonacci Retracement tool (and Extension tool)- by making your trading strategy mechanical. Trading without emotions and with risk management will put you into the 10% of successful traders, this is where you want to be.
Buy low into an upwards trend and Sell low into a downtrend will great increase your profits and reduce your stress- Fibonacci Tool is the one for this.

What Fibonacci Retracements Are? Part 2Retracements:
Short term price corrections during an overall larger either upward trend or downward trend.
Retracements are price corrections and temporary price reversals that do not indicate a change in the direction of the larger trend.
These retracements can be used for short term trading ( scalping or day trading ... or longer time frames).
The main benefit of retracements are: you can enter a trade at a better price, just before the continuation of the original move.
Why retracements occur?
When more traders jump on a trade, some traders will take profit & close there trades causing a retracement to happen, or correction of major trend.
Retracement Rules:
1) Buy pullbacks in an uptrend
2) Sell pullbacks in an downtrend
*Example on 4 hour chart is a bearish trade with a retracement back into the golden zone of 38.2% to 61.50% which most reversals occur in, back into the major trend on that time frame. My advice is use Fibonacci indicator on 1 hour or higher to reduce the price action noise.

Introduction To Fibonacci Numbers (How They Work) Part 1Forex Fibonacci numbers (How Do They Work?)
In mathematics, the Fibonacci numbers are the numbers in the following integer sequence, called the Fibonacci sequence, and characterized by the fact that every number after the first two is the sum of the two preceding ones: 1, 1, 2, 3, 5, 8, 13, 21, 34, 55, 89, 144, continues for infinity.
Introduction To Fibonacci
We are interested in the essentials of the Fibonacci sequence and how they fit into the trading world. As you probably know the golden ratio could be found anywhere in the nature. Markets are not an exception.
Fibonacci numbers traders use on charts work for one reason or another. There are a lot of debates WHY exactly price reacts to these levels but it is more important that it DOES. Fibonacci levels are sort of self-fulfilling prophecies. Means the more people use them, more powerful these levels become.
IMPORTANT:
Behind the scenes of the Forex trading world, magic happens. Smart money or Big banks are trading according to these very same Fibonacci number levels. Remember – Fibonacci is not just in trading but in any aspect of life numbers related. *This information is priceless to us – the retail traders.
Some Important Fibonacci Levels: There are many Fibonacci numbers however traders use and rely on some levels more than the others. Most commonly used levels are: 23.6%, 38.2%, 50%, 61.8%, 100% and 161.8%. This is just a tool which needs other confirmation before making any trade.

Video - Relationships Between Corrective WavesEducational video on how to anticipate the end of corrective waves so you can rejoin the trend.

How to use Fibonacci to determine a trend change or a correctionFibonacci is a great tool that I have learned to use in different trading situations. One of the great features of the Fibonacci ratios is the ability to reveal market information.
In this video, I demonstrated how you can use the Fibonacci to confirm a trend change or a retracement.
Enjoy!

JUST FOR ME NOT FAthis area is supply area, maybe pair can visit the top point of chart but ı don't think so pair can't be stand there
second setup is fib line and demand area, if pair will bullish ı wanna get the train here

Pulse of an Asset via Fibonacci: AMP's perfect Golden Growth FibThis Chart is a an example of a "Golden" Fib series.
This Concept is from "Chapter 5" of my going "book".
This Religion is of the universality of the "Golden Ratio".
Marked on chart are "Pings", ricochets that one can almost HEAR.
"Not all Pings start a reversal, but Most reversals start with a Ping."
Top had a "Loud" ping, with subsequent waves also marked by Pings.
Every Ping is like a bug hitting a spider's Web.
The vibration alerts and emboldens other strands.
Thus we observe the behavior at each strand for clues.
.
I do not use "Fibs" in the "traditional" manner (retracements).
I use Fibs to plot "Ripples" (extensions) created by "Impulses".
Then look for "Confluences" to map the "interference Pattern".
My "Book" detailing my Methodology with Numerous Examples:
Chapter 1: Introduction and numerous Examples
Chapter 2: Detailed views and Wave Analysis
Chapter 3: The Dreaded 9.618: Murderer of Moves
Chapter 4: Impulse Redux: Return to Birth place
Chapter 5: Golden Growth: Parabolic Expansions
Chapter 6: Give me a ping Vasili: 'one' Ping only
Chapter 7: The Mighty 2.618: like a Rook in Chess
.

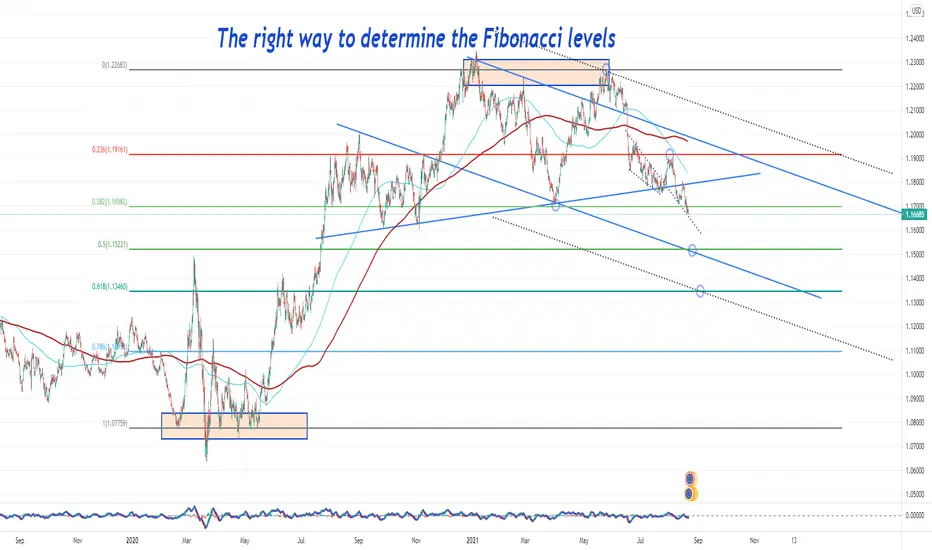
The right way to determine the Fibonacci levels.Not legal and financial advice;
Any information provided here is only the personal opinion of the author.
How To Trade Quality Pin BarsAfter the Pin Bar Formed At The EMA 10 EMA 20, Do The Following Actions
Draw Your Fibonacci Retracement Levels
Draw Horizontal Support Levels
Enter At Pin Bar Close Price
Exit At The Previous Swing Low Level
The attributes that made this a quality Pin Bar:
Pin Bar Close Price is in the Fibonacci Retracement 50% and 38.2% Range Area
Pin Bar Close Price is in the EMA 10 EMA 20 Range Area
Pin Bar at Lower High
Downtrend
Technical Chart Of How To Trade The Pin Bar. Before and After Charts. Click on Charts.

A Comprehensive Guide to Fibonacci RetracementsHello traders, in this post, we will be going over one of the most commonly used tools in the equities (stocks), forex (fx), and cryptocurrency markets - the "Fibonacci Retracement". For a better viewing experience, please view this on your desktop/PC, as the mobile and tablet versions of the charts are harder to read.
Although I have briefly touched on how to use the Fibonacci Retracement tool in my previous Elliott Waves series, we are now going to go over it in depth, and talk about how this tool can help you find entries and exits within an existing trend, which also helps identify whether you are in a bullish or bearish trend.
The Fibonacci Retracement tool, although widely used by many traders, is almost always not correctly used by new traders. Most traders will often connect the wrong points, indicating the wrong Fibonacci retracement levels. Here, I will be explaining the proper way to use the Fibonacci Retracement tool in a very simple translated friendly guide in one guide.
-------
What Is the Fibonacci Retracement?
Fibonacci Retracements (Fib(s) for short), are a set of 'ratios', defined by mathematically important Fibonacci sequence. This allows traders to identify key levels of support and resistances for price action. Unlike other indicators, Fibonacci retracements are FIXED, making them very easy to interpret. When combined with additional indicators, Fibs can be used to identify potential entry and exit points with high probability to trade on trending movements. Fibonacci retracements are used to indicate levels of support and resistance for a stock’s price. Although they are similar to moving averages in this respect, Fibonacci retracements are set by the extent of the previous bullish or bearish run and do not change each day in the current trend as moving averages do. Therefore, it can be significantly easier to identify and anticipate support and resistance levels from Fibonacci sequences.
How Is the Fibonacci Retracement Calculated? (You don't need to calculate it yourself - It's already done for you!)
Fibonacci retracements are based on what is known as the 'Fibonacci sequence', where each number in the sequence can be added to the previous number to produce the following number within the sequence. Now, you might be confused here, but don't! - I am just explaining the concept on how it's calculated. You do not need to personally calculate the actual sequence of the Fibonacci Retracement, as everything is already pre-determined and calculated within the tool itself on TradingView. To put it simply, dividing any number in the sequence by the following number yields 1.6180 – known as the "Golden Ratio" – while dividing any number by its predecessor yields 0.6180. Dividing any number in the sequence by two positions in advance yields 0.3820, while dividing any number by a number three positions in advance yields 0.2360. These ratios emanating from the Fibonacci sequence are found throughout nature, mathematics, and architecture - such as flowers, buildings, and so forth. Yes, if you search for Fibonacci sequence examples, you can find these within daily uses, not only in trading.
Now, let's get into the meat and potatoes. Retracement levels for a stock/cryptocurrency are drawn based on the prior bearish or bullish movement. Don't forget this - you need to know whether you are in a bullish or bearish trend. Is the stock or coin going up? or down? To plot the retracements, draw a trendline from the low to the high (also known as the swing low to the swing high) within a continuous price movement trend – Fibonacci retracement lines should be placed at 61.80%, 38.20%, and 23.60% of the height of the line. Again, these numbers are already calculated for you within the tool itself. In a bullish trend, the retracement lines start from the top of the movement (i.e. the 23.60% line is closest to the top of the movement), whereas in a bearish movement the retracements are calculated from the bottom of the movement (i.e. the 23.60% line is closest to the bottom of the movement).
How to Trade Using the Fibonacci Retracement
Once you have drawn a set of Fibonacci retracements on a chart of your liking, it is possible to anticipate potential reversal points where support or resistance will be encountered. If the retracements are based on a bullish trend, the retracements should indicate potential support levels where a downtrend will reverse bullishly. So to put it simply, the pre-determined Fibonacci levels, should in theory and practicality, act as resistance. If not, there is almost 100% certainty, even if the support/resistance is not held, there will always be some form of price reaction at each Fibonacci level just based on the Market Psychology movements. If the retracements are based on a bearish movement, the retracements should indicate potential resistance levels where a rebound will be reversed bearishly, which is the vice-versa situation for the bullish movement trend.
The most common reversals based on Fibonacci retracements occur at the 38.20%, 50%, and 61.80% levels (50% comes not from the Fibonacci sequence, but from the theory that on average stocks retrace half of their prior movements). Although retracements do occur at the 23.60% line, these are less frequent and require close attention since they occur relatively quickly after the start of a reversal. In general, retracement lines can be considered stronger support and resistance levels when they coincide with the overall trend, meaning, that if you know that you are in an established bullish or bearish trend, you will most certainly get some form of reaction at the most common reversal levels within the Fibonacci level, which is shown in the image below.
Whenever applying Fibonacci retracements, keep in mind that retracement lines represent only potential support and resistance levels, they are NOT 100% set in stone – they represent price levels at which to be alert, rather than hard buy and sell signals; however, they have HIGH PROBABILITY. It is important to use additional indicators, in particular MACD, to identify when support or resistance is actually being encountered and a reversal is likely. The more that additional indicators are pointing towards a reversal, the more likely one is to occur. Also note that failed reversals, especially at the 38.20% and 50% retracement levels, are common.

IMPROVE YOUR TRADING | 4 TYPES OF TRADE CONFIRMATION ✅👌
"Look for a confirmation!"
"Wait for a confirmation!"
When I was learning how to trade and when I was watching and reading different trading educators, these words naturally pissed me off. What the hell are you talking about? What confirmation?
It was a full-blown mystery...🤯
Then, once I started to mature in trading and trade full-time, I became an author on TradingView.
Posting my forecasts and trading setups, I frequently mentioned the confirmation.
And now the newbies that are reading me and learning from me are pissed off...🤬
That is so funny I guess.
But the truth is that the confirmation must become a fundamental part of your trading strategy. It is your key to successful trading.
What exactly is the confirmation?
It depends on many many different things, in this article I will discuss with you the 4 main types of confirmation and give you detailed examples.
1️⃣ - PRICE ACTION CONFIRMATION
That is actually what I prefer.
Analyzing different markets and searching for decent trading opportunities often times we find some peculiar instruments to watch.
Identifying the market trend and key levels we find the potential spots to trade from.
But do we just open the trade once the "ZONE" is spotted?
I wish it could be that simple...
Trading just the zone, without additional clues brings very negative figures. We definitely need something else.
Price action & candlestick patterns can be those clues.
Accurate reflection of the current local market sentiment makes the patterns a very reliable confirmation.
Dodji's, pin bars, double tops/bottoms ...
Proven by history, the skill of identification & reading the patterns will pay off quickly.
Being in some sense the language of the market, the patterns are the fundamental part of my trading strategy.
2️⃣ - FIBONACCI LEVELS
Fibonacci levels are a very popular technical tool. Being applied properly it helps the trader to confirm or, alternatively, disqualify the identified "ZONE".
With multiple different methods like confluence trading, fibs are applied in hedge funds and various banking institutions.
The main problem with the fibs, however, is complexity and a high degree of subjectivity. Meeting different traders and watching different posts on TradingView I noticed that all traders tend to have their own vision. There is no universal system to apply here, a proper fib.confirmation technique can be built only with long-lasting backtesting and practicing.
3️⃣ - FUNDAMENTAL NEWS
The figures in the economic calendar, news, tweets. Actual fundamental news can become your best confirmation tool.
However, the main obstacle right here is the promptness, validity and reliability of the data that you get.
The information shouldn't be delayed and it must be objectively true.
The search for such a source is by itself is a very time-consuming and labor-intensive business not even mentioning its potential costs.
And that is not all. Knowing how to make sense of that data, its proper perception, and understanding requires a solid economical and financial background and experience.
At the end of the day, becoming an expert in fundamental analysis, the trader can easily sort the trading zones and trade only the ones that are confirmed by a decent fundamental trigger.
4️⃣ - TECHNICAL INDICATORS
I believe all the traders apply some indicators. From a simple moving average to some complex composite algorithms, indicators play a very important role in trading.
Being 100% objective and providing up-to-date real numbers and figures, they are our allies in a battle against subjectivity.
For many traders, the various signals from indicators are considered to be accurate and reliable confirmations.
Many algotrading solutions are operating simply relying on such signals and being able to bring consistent profits proves the power of technical indicators.
What confirmation type should you rely on?🧐
I guess the main rule right here is that the confirmation must MAKE SENSE to you. You should feel the logic behind that. It must make you confident in your action, even in case of the occasional losses, it must keep you calm and humble.
Let me know in a comment section what confirmation do you prefer!
💝Please, support my work with like and comment!
Thank you for reading.
