BNB doesn't deserve this levelHello fellas, welcome back to our podcast. This will be a very interesting podcast during this week! BNB is having my attention here. a lot of concern and update will be covered here. Let's do it.
Looking at the white trend line, it has been holding the price since August 2017 which means a 2 years trend line! And specifically, the price is coming very close to this trend line right now. Whenever I see the price moves like this and coming close to this trend line, I firmly believe that the price MUST respect this kind of trend line with a bounce.
My above statement is coming align with current pattern that I found on the market, we can easily deduce during the drop recently that the price is forming a bullish falling wedge which will always end up bullish. In my opinion, the APEX of the wedge is near and I believe that we will get the confirmation very soon to enter the long position.
Keep watching boy!
Fibonacci

EOS : Sunday's analysis leak from premiumLooking back at the EOS here. And if you remember my previous theory about 3 phases of break out strategy, you will realize that current support action for EOS is at the 2nd phases of break out strategy which is retesting the previous resistance that is now become a support. For now, I will looking for a possible long opportunity which will produce a really nice risk to reward ratio on this potential positions.
Once we see a clear rejection of this support trend line, I will open a long position for it and use the fibonacci levels as target areas.
For more details analysis, watch the video on our youtube One Point Trading


[AU] Mnemosyne v04 Mnemosyne v04
Fibonacci oscillator with Lead-Follower-Base design and optional dynamic Caution Zones.
Adjustable lengths and new defaults for Lead, Follower 1/2, Base
12 Smoothing options available: "SMA", "HMA (Hull)", "EHMA (Exponential Hull)", "EMA", "RMA", "WMA", "DWMA (Double Weighted MA)", "Ahrens MA", "ZLEMA (Zero-Lag Exponential MA)", "LSMA (Least Squares MA)", "JMA (Jurik MA)", "T3 (Tilson MA)"
Shown here from top to bottom: Mnemosyne with SMA, Hull, JMA, LSMA. Each line has an adjustable length and configurable smoothing options available.

4 hours chart perspective.Hello fellas, It has been a slow day lately. But, I am hoping that you are doing great! come and take a look at our bitcoin's update on this saturday.
Currently the price is moving in a consolidation phase after a drop. I really expect the price to break out of the white resistance trend line and test the 38.2 fib retracement level. My hypothesis is the price will forms an inverse head and shoulder first before confirming breaking out to test the previous major support that is now become resistance as well.
At this kind of condition, I really think that there will be a very difficult time for bitcoin to drop more. Because the golden pocket is moving align with the exact previous support that is now become a resistance. watch for the confirmation and let's buy the dip ONLY when the price has shown a broken out structure.

Short term : Should it be a bounce?Hello Fellas, Let's come to the update of bitcoin.
I want to give a highlight on the green trend line. this is the previous trend line that has already broken up and right now the price is trying to test it again to confirm as support. And if we see a correlation between this trend line and the fibonacci extention 1.1 level, it almost moving align with it. And the cross point between to highlighted region is slightly below the 200 MA which make things more interesting.
If we are talking about the breaking down of the 200 MA, Current daily candle hasn't closed yet. That's why today and tomorrow will be very crucial for the next possible move for bitcoin. However, in lower time frame, I haven't seen any confirmation of bounce just yet, making me to stay idle and just enjoying my yesterday's profit on SKY and LSK.

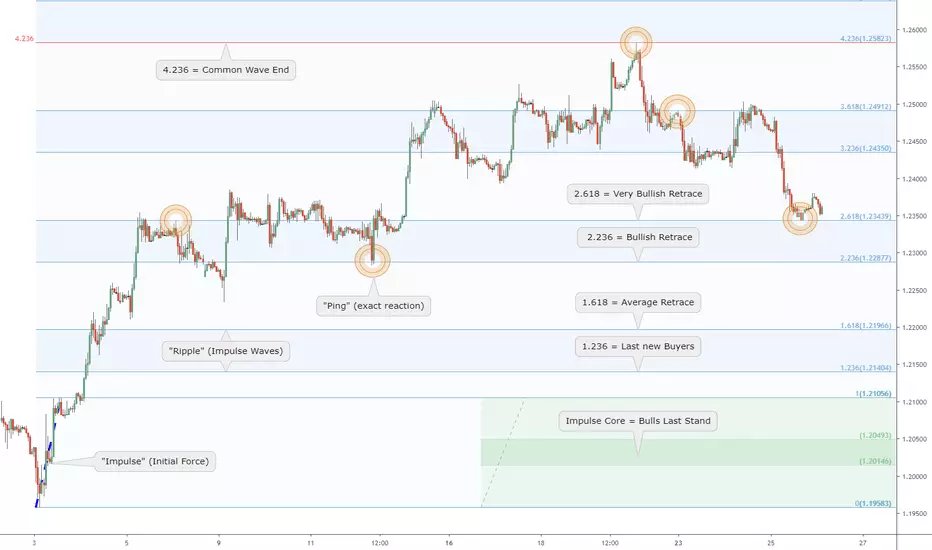
"Pulse" of an asset times Fibonacci: GU Picture Perfect Fib WaveOrdered Chaos
every Wave is born from Impulse, like a Pebble into Water.
every Pebble bears its own Ripples, gilded of Ratio Golden.
every Ripple behaves as its forerunner, setting the Pulse.
each line Gains its Gravity.
each line Tried and Tested.
each line Poised to Reflect.
every Asset Class behaves this way.
every Time Frame displays its ripples.
every Brain Chord rings these rhythms.
He who Understands will be Humble.
He who Grasps will observe the Order.
He who Ignores will behold only Chaos.
Ordered Chaos
.
.
want to Learn a little More?
can you Spend a few Moments?
click the Links under Related.
How to Draw Important BTC Price Action Levels I like to draw important price action levels on charts to look for reactions. These include:
Yearly Open
Monthly Open
Weekly Open
Weekly High Low Confluence
Major Fibonacci Retracements
BTC CME Gaps (use BTC1! daily chart)
Support Resistance zones
Keep in mind that I'm more concerned with the area than the specific price. I tend to wait to see a reaction before trading a level. I put more value on yearly and monthly over weekly and more value on fibs over weekly levels. Recent price action has more value if we get a reaction. This may or may not apply to you depending on your style.
You may find this useful even if you don't trade price action as it can still be a good area to take long term trades.
Good luck everyone!

Faaalling Bitcoin? Cup and Handle + Volume AnalysisThis is a daily chart for BTCUSD on Bitstamp.
The most obvious thing I want to highlight is the battle at the 0.382 Fib level.
It is very very common for an asset to have a few checks and tests off of 0.382.
And BTC is no exception.
For the past few months, we've witnessed a battle between Bulls V Bears at 0.382.
Now, bull and bear volume has been declining. Who will take over?
It seems like the technical bearish pattern Cup and Handle has surfaced.
The Cup and Handle target is projected downward,
equal to the distance between the neckline and the highest point of the Cup and Handle.
This projection takes us right around the 0.618 and 0.786 levels.
These levels are very common to show reversals .
And around this level, the price is around $6K.
Funny, this is around double the last bottom ($3.1K).
Why am I bringing this up? Remember, if you consider Bitcoin
as a commodity, then you must remember that a commodity's price will gravitate to its cost of production over time .
With difficulty increasing, we know that CoP will increase over time, and that BTC will have higher bottoms , at least for the short to medium term.
So, it makes sense for BTC to follow this Cup and Handle projection.
But remember, the market can do any damn thing it wants; we'll just have to wait and see ;)

Next Stop $9300?Hello Fellas, finally we come here with an update on the number one largest cryptocurrency in this universe which is BITCOIN! If you've seen my video analysis breakdown on youtube about btc, you will realize that finally btc has got a confirmation of breaking down the yellow area. what's next after this?
Like what I've always said, there are a lot of arguments to draw a support and resistance trend line for bitcoin, that's why a lot of bias has occured lately. I can't blame and judge the people who has made an analysis and serve it with exact long or short. Right or wrong, the bias in this market is always be subjective, there won't be 100% right or wrong. But, with this break down of yellow level, I believe most of good traders will agree that the bearish pressure is getting higher at this rate.
I see a minor support level which is the 78.6 fib level region. This area also known as the flavor of the year region because in this 2019, a lot of instrument has bounced right after the price hitting this level. Currently, the price of bitcoin is trending slightly above this support level and once we see a break down confirmation of this minor support, I believe the short entry to target the white region as a huge support is likely to happen.

What does it need to confirm altcoin season?"What seems good is not necessarily good" Maybe this statement is the right quote to represent current condition of the market in cryptocurrency universe, especially in altcoins!
A lot of arguments about the next altcoins season has occured lately. not just because the height of the bitcoin dominance, but also most of the altcoins has reached an extremely bottom right now. If you've read about the logical thinking about money circulation in this current industry, you will understand very well about the correlation between bitcoin dominance and crypto market capitalization.
Let me explain it to you about this logical thinking again. If the bitcoin dominance has reached the top and we see a possible drop on this dominance in the future, this will mean a shifting capital from whales which switch their investment from bitcoin to altcoins. And if this happens, it means that the money outflow from bitcoin will become the money inflow in altcoins because a lot of investors has switched their capital to altcoins. And if this happens, this will automatically increase the market capitalization on altcoins.
In this podcast, I will be focusing on the technical analysis on this altcoin market capitalization. Based on the chart, we can see there is a possibility of this market cap to forms a head and shoulders pattern which will end up with the drop on this market cap. I still believe that altcoin season will happen in near future, but there must be a mitigation if our analysis comes wrong and the price moves against our will. Personally, i will put a huge amount of money on altcoins when the market cap of this altcoins breaks out of the blue region. otherwise, I will be very cautious and try to play conservatively on scalping.
Just as you know the correlation of these important factors :
- Bitcoin dominance goes up, altcoin market cap goes down, altcoin price goes down and vice versa.
Thank you

Ordered Chaos: "like a Pebble into Water": BTC Impulse ReduxPicture perfect Impulse, its Ripples, and the Redux (return).
"Impulse" is a surge that creates "Ripples", like a pebble into water.
"Impulse Redux" is returning of wave to the original source of energy.
"Impulse Core" is the zone of maximum energy, in the Golden Pocket.
Are the sellers still there? Enough to absorb the buying power?
Reaction at Impulse is worth observing closely to gauge energy.
Rejection is expected on at least first approach if not several.
.
Part my ongoing series to collect examples of my Methodology (Religion?).
.
Ordered Chaos
every Wave is born from Impulse, like a Pebble into Water.
every Pebble bears its own Ripples, gilded of Ratio Golden.
every Ripple behaves as its forerunner, setting the Pulse.
each line Gains its Gravity .
each line Tried and Tested.
each line Poised to Reflect.
every Asset Class behaves this way.
every Time Frame displays its ripples.
every Brain Chord rings these rhythms.
He who Understands will be Humble.
He who Grasps will observe the Order.
He who Ignores will behold only Chaos.
Ordered Chaos
.
.
want to Learn a little More?
can you Spend a few Moments?
click the Links under Related.

Ordered Chaos: "every TimeFrame displays its ripples". USDCAD 6h"Textbook" example of an "Impulse", its "Ripples", and the "Core".
This Fib series has been the guiding light for over 3 months now.
Once an Impulse is identified, its Ripples become the road map.
.
.
Ordered Chaos
every Wave is born from Impulse, like a Pebble into Water.
every Pebble bears its own Ripples, gilded of Ratio Golden.
every Ripple behaves as its forerunner, setting the Pulse.
each line Gains its Gravity.
each line Tried and Tested.
each line Poised to Reflect.
Confluence of 2 is Dependable.
Congruence of 3 is Respectable.
Coincidence of 4 is Worshipable.
every Asset Class behaves this way.
every Time Frame displays its ripples.
every Brain Chord rings these rhythms.
He who Understands will be Humble.
He who Grasps will observe the Order.
He who Ignores will behold only Chaos.
Ordered Chaos
.
.
want to Learn a little More?
can you Spend a few Moments?
click the Links under Related.

Bitcoin - There's Levels to This! Fibonacci & Cluster AnalysisThis is a 1-hour chart of BTCUSD on Bitstamp.
From the high this past July to the current price, it is clear that price is pivoting back and forth between key levels.
Those key levels are:
- 0.382
- 0.5 (not a Fib level but still a useful level of support/resistance)
- 0.618
- 0.786
- 0.886
From the Fib off of the high around $13.9K to the low around $9K, we see clustering around the following levels:
- 0.382
- 0.618
From the Fib off of the low around $9K to the high around $12K, we see clustering around the following levels:
- 0.786
- 0.886
From the Fib off of the high around $12K to the low around $9.3K, we see clustering around the following levels:
- 0.5
- 0.382
I think it's paramount to study and trade off of levels.
Use levels along with price action, market structure, volume, and location.
Otherwise, if you just rely on indicators, you are simply guessing where price could go. Indicators tell you about the PAST.
It's time to get smarter with our trades.

Gnosis (GNOUSD): Coiling Volume.This is a daily chart of GNOUSD on Kraken.
Looks like volume is coiling between an uptrend (green) line and a downtrend (red) line.
Don't be surprised if you see a BIG move at the end of this coiling.
Looking at price, based off of the Fib drawn from the high around $26 and the low around $13,
we see some clear resistance at 0.382, a common area of resistance.
If price can clearly break this resistance along with bullish market structure (i.e double bottom w. breakout),
and volume looks bullish, it's a good call to buy some.
Until then, pay attention.

Ethereum (ETHUSD) Resistance - Expect at $240This is a daily chart, of ETHUSD on Kraken.
We see a relatively bullish uptrend as of late, but I expect resistance to be hit around the $240 level.
Why? A few reasons.
Firstly, we can see a cluster of historical resistance and support around those levels.
Makes sense for price to be tested there again.
Secondly, the $240 level is right around the 0.382 retracement, if we draw a Fib from the high pivot around $364 to the low pivot around $165.
0.382 is a frequent area of resistance.
Do you have different potential areas of resistance, based off of different analysis, i.e Gann, etc?
Anyway, let's keep our eyes peeled.

The "Pulse" of an asset times Fibonacci: LINK at Impulse ReduxChainLink and most other Alts got a nice boost.
Now it has returned to the last Impulse Zone.
Clues gained here can be applied to all Alts.
"Impulse" is a surge that creates "Ripples", like a pebble into water.
"Impulse Redux" is returning of wave to the original source of energy.
"Impulse Core" is the zone of maximum energy, in the Golden Pocket.
Are the sellers still there? Enough to absorb the buying power?
Reaction at Impulse is worth observing closely to gauge energy.
Rejection is expected on at least first approach if not several.
This is part my ongoing series to collect examples of my Methodology.
.
.
Ordered Chaos
every Wave is born from Impulse, like a Pebble into Water.
every Pebble bears its own Ripples, gilded of Ratio Golden.
every Ripple behaves as its forerunner, setting the Pulse.
each line Gains its Gravity .
each line Tried and Tested.
each line Poised to Reflect.
every Asset Class behaves this way.
every Time Frame displays its ripples.
every Brain Chord rings these rhythms.
He who Understands will be Humble.
He who Grasps will observe the Order.
He who Ignores will behold only Chaos.
Ordered Chaos
.
.
.
want to Learn a little More?
can you Spend a few Moments?
click the Links under Related.

The Key Fib Levels of 0.618 and 0.786 + Volume ProfileHere's a chart that nicely illustrates how the 0.618 and 0.786 levels are frequently used as reversal points by the market.
Price is ping-ponging back and forth between these key levels, and we can also see an almost full Volume Profile (parabolic in shape).
The shape of this VP tells us that all the prices within this given range have been discovered, with the middle areas being the places where the most buying and selling has occurred.
This is a sign of a normal and healthy range.
So, we have the Fib levels working in unison with Volume Profile to paint a picture of a ranging market.

No Longer Random: Here's Why I Believe in Fib Ratios & HarmonicsI am going through a book on Harmonics and Fibonacci ratios (The Harmonic Trader by Scott Carney), and I'm seeing for myself how these ratios can be used as key areas of reversal.
I used to believe that day-to-day price action was random, but after looking at several charts for myself, I now reject my old belief and concede that price action is greatly tied to key Fibonacci levels and conforms decently to harmonic patterns.
The key levels I highlight here are
- 0.382
- 1.618
In the first leg, we draw our Fib off of the pivot around the $51 level to the pivot high around the $70 level. Here, we can see a reversal off the 0.382 level almost 100% cleanly.
In the second leg, we draw our Fib off that same pivot high around the $70 level to the pivot low around the $63 level. Here, we see a reversal off of the 1.618 extension level, another key reversal level.
In the third leg, we draw our Fib off that same pivot low around the $63 level to the pivot high around the $76 level. Here, we see a test of the 0.382 level, again.
But wait, there's more.
We can also draw an AB=CD harmonic using the following levels.
- A: Pivot low around $56
- B: Pivot high around $70
- C: Pivot low around $63
- D: Pivot high around $76
The AB leg is roughly the same length as the CD leg.
As you can see, AB=CD reversal also happens to be in that same 1.618 area.
All of this works together in unison.
Amidst all of these reversals off these levels, here's my Golden Rule : Use market structure as confirmation of these reversals. Look for 'M's (double tops) and 'W's (double bottoms), as well as bullish/bearish candles when appropriate, to confirm the direction of the reversal. Don't blindly trade solely off of levels.
I didn't cover them here, but I also love seeing reversals off of 0.618 and/or 0.786 levels. Those occur very frequently, too. Just gotta train your eyes.

Roles of confluence zonesIt has been a very interesting move from bitcoin, after a drop to touched the $10095 region, the price was immediately moves back to claim again the support around $10300 region to produce a long shadow on daily candle. This action could be a good representation of the bulls making their best effort to defend the $10000 region as a huge psychological support.
And looking at the chart that I've shared, the green dotted line is the resistance trend line if I want to exclude the bull trap region on previous action (body to body connecting method). And the second thing is the white region, those 2 white regions are the confluence zone between the fibonacci retracement and the fibonacci extention which I believe will act as a huge resistance for swingers. The first resistance zone is around the $10750 - $10800 region which is moving align with the green dotted line as resistance trend line. The second resistance zone is the confluence zone between golden ratio and the 1.1 fib extention.
My bias here is remain the same as before with a push to the down side for the big picture. but, I see a possible push to the first resistance zone with a bull trap region producing until the 2nd resistance zone if the $10300 region can defend the current price from further drop.

Ethereum : Equilibrium on market and dominance on bitcoinHello fellas, Finally we get some moves on BTC and once again our analysis has met the precision here with a drop. I've warned you about the bull trap region and possible drop. At the time I made this post, the bitcoin dominance is standing at around 69.4% which is extremely high and not ideal for me. So, I believe in the near future, the dominance will throw over from current level and we will see a drop on bitcoin too. The biggest question is, what could happen on altcoin market? will it follow the bitcoin's drop? or will it moves against bitcoin?
Personally, I really think that current price of altcoin is pretty low and most of them has already touched the historical low. I really can't imagine if the price of that altcoin will drop from current level, it will be such a hell. I use only the logical think to represent my view on current market. Just imagine if the dominance of bitcoin decrease, this will mean there will be a money outflow from bitcoin to keep the equilibrium play in this major market and if there is a huge outflow from bitcoin investment, I do believe the money from big investors which is known as whales in crypto industry will fill in the altcoins space to help bitcoin decrease its dominance. This phenomenon will cause a negative correlation between bitcoin and the altcoin.
I choose to pick ETH as my weapon on this possible bullish scenario on alts because Ethereum is the 2nd largest crypto in this universe just under bitcoin in its rank based on market volume. I do believe in its project too.
And from the technical side, it is moving align too with my above statement. currently the price is playing in the break out cycle both on diagonal and horizontal levels and based on the RSI and MACD, I see the price is gaining strength with its bullish divergence on daily based. I need to see 1 more drop toward the white region and if this level can hold on the price, I will open a long position from there.
This will be a beautiful trade if I have all the confirmation is being met and you will feel how satisfied is with this profit.

Bitcoin : key levels and significant resistance trend line.Hello fellas, Happy monday and have a good weeks ahead. a new week, new passion and I hope a new extra profit for us! let's talk about the key levels for bitcoin which will cover the support , resistance and the correlation with the fibonacci levels.
As you can see, that the weekly candle is about to close in less than 2 hours when I made this post and the newest weekly candle close isn't significant at all for me. currently the weekly candle is forming an unknown pattern making it very random and neutral. That's why, I am not trying to explain my bias in this post. I just want to share about the analysis of price action and key levels that I've found interesting
If you see my chart, I've shared 2 colored region which the grey region represent the key support and the blue region represent the key resistances. Each of this key levels here is moving align with the fibonacci levels. and I want you to highlight the period after November 5th, 2018.
First action is at May 13th, 2019 the price has already broken up of the resistance zone and on June 3th 2019 the resistance zone retested and produced a bounce before another break out.
Second significant action is at June 24th, 2019 candle. A really nasty wick has occured after the price tried to breaks the 50% fibonacci retracement and ended up getting rejected. After that the price was trying to break out of this 50% fibonacci levels again and always got a rejection toward the upside and it formed a shooting star candle. and for me, this action is very significant and has proven this region as a heavy region.
Another highlighted thing that I want to share is the green line. after a break out at April 2019 (yellow sign) I haven't seen any retest toward this previous resistance that is now become support as well (remember my 3 phase break out strategy). Ideally, before the end of the year, I really wish that bitcoin will test this green line again as support.
Thank you.

Bull Trap : Characteristics when the price is close to the APEXHello there my fellas, welcome back to my Sunday update about bitcoin!
Well well, it has been a very interesting play for bitcoin for now. The condition is this, The price is moving very close to the upper line of the huge descending triangle (green line) and of course if we look at lower time frame, it looks like the price is going to break this resistance trend line. I am thinking of it more like a possible bull trap moves if it breaks the green resistance trend line on lower time frame and I believe it will only produces a long wick to the upside.
Yes, maybe it is a very random statement for most of you because we have seen a strong volume and strong dynamic support that has defended the price really good. But, let's think like we are the whales who want to open a short entry because we see a huge descending triangle in play and the price in higher time frame view is losing a lot of strength! As a whales, I will definitely try to 'kill' the shorter in lower period of trading window. Why? because I want to get a short entry at higher rate so my risk to reward ratio will be better.
The second reason is because the price is moving very close to the APEX of huge descending triangle, I am very sure there will be a lot of faking out moves to represent the war between the bulls and the bears!
I believe the price will touch again the $10500 region as it is the golden pocket region or we can considering the area between the $10650 - $10700 as the last region for the long wick to the upside because it locates right at the 78.6 fib level and the previous swing high.
Thank you and the daily view will be shared on update section.
