BTCUSD Buy (to 20k) and exaclty how we enter tradesThis tutorial explains how we take trade entries, its as simple as this!
We use a complete trading system that governs every aspect of our trading, from entry to exit. We put high emphasis on position sizing and we only use the Fibonacci retracement to enter trades
Fibonacci

Simple Trend Trading Strategy! Trade the intraday trends with ease! Stack the confluences to a high probability trade and execute!
Pull back to between Fib zone 0.382 - 0.618, small counter trend line within overall trend, entry on a momentum breakout candle.
Bobs your uncle!!

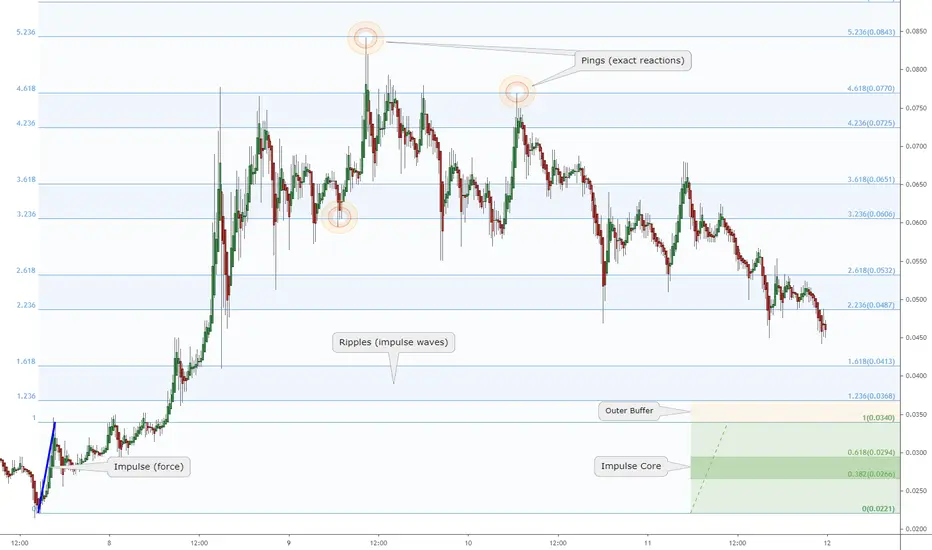
Pulse of an Asset via Fibonacci: Ether at minor Impulse Redux"Impulse" is a surge that creates "Ripples", like a pebble into water.
"Impulse Redux" is returning of wave to the original source of energy.
"Impulse Core" is the zone of maximum energy, in the Golden Pocket.
Are the sellers still there? Enough to absorb the buying power?
Reaction at Impulse is worth observing closely to gauge energy.
Rejection is expected on at least first approach if not several.
Part of my ongoing series to collect examples of my Methodology : (click links below)
Chapter 1: Introduction and numerous Examples
Chapter 2: Detailed views and Wave Analysis
Chapter 3: The Dreaded 9.618: Murderer of Moves
Chapter 4: Impulse Redux: Return to Birth place <= Current Example
Chapter 5: Golden Growth: Parabolic Expansions
Chapter 6: Give me a ping Vasili: one Ping only
.
.
Ordered Chaos
every Wave is born from Impulse,
like a Pebble into Water.
every Pebble bears its own Ripples,
gilded of Ratio Golden.
every Ripple behaves as its forerunner,
setting the Pulse.
each line Gains its Gravity .
each line Tried and Tested.
each line Poised to Reflect.
every Asset Class behaves this way.
every Time Frame displays its ripples.
every Brain Chord rings these rhythms.
He who Understands will be Humble.
He who Grasps will observe the Order.
He who Ignores will behold only Chaos.
Ordered Chaos
.
.
.
want to Learn a little More?
can you Spend a few Moments?
click the Links under Related.

How to Objectively place Fibonacci RetracementsI've seen people place retracements in interesting ways and just want to show an objective way to place your retracements.
You need a top, a bottom, and a corrective wave or reversal that you are analyzing.
Now, fibs are everywhere and you can place them however works best for you and there is no ONE way,
but this is for people who want to approach learning fib in the most objective way possible.
I believe it is smart to have strict rules in your trading system and rules that align with what most pros are used to following.
Good luck,
HOOP

Pulse of an Asset via Fibonacci: DNT nearing an Impulse Redux"Impulse" is a surge that creates "Ripples", like a pebble into water.
"Impulse Redux" is returning of wave to the original source of energy.
"Impulse Core" is the zone of maximum energy, in the Golden Pocket.
Are the sellers still there? Enough to absorb the buying power?
Reaction at Impulse is worth observing closely to gauge energy.
Rejection is expected on at least first approach if not several.
Part of my ongoing series to collect examples of my Methodology : (click links below)
Chapter 1: Introduction and numerous Examples
Chapter 2: Detailed views and Wave Analysis
Chapter 3: The Dreaded 9.618: Murderer of Moves
Chapter 4: Impulse Redux: Return to Birth place <= Current Example
Chapter 5: Golden Growth: Parabolic Expansions
Chapter 6: Give me a ping Vasili: one Ping only
.
.
Ordered Chaos
every Wave is born from Impulse,
like a Pebble into Water.
every Pebble bears its own Ripples,
gilded of Ratio Golden.
every Ripple behaves as its forerunner,
setting the Pulse.
each line Gains its Gravity .
each line Tried and Tested.
each line Poised to Reflect.
every Asset Class behaves this way.
every Time Frame displays its ripples.
every Brain Chord rings these rhythms.
He who Understands will be Humble.
He who Grasps will observe the Order.
He who Ignores will behold only Chaos.
Ordered Chaos
.
.
.
want to Learn a little More?
can you Spend a few Moments?
click the Links under Related.
Using the Fibs as Overbought and OversoldI used the latest swing high and swing low. My bias was short so I looked for a premium price to sell from. From the 50% and above are premium prices, next I looked for the candle responsible for an impulsive move down. Marked that candle. Also on the M5 I noticed a clean high, and I used the entry method of A STOP RAID as an entry. And the M1 gave me a bearish divergence solidifying the sell. Aimed for old lows to take profit or used the levels on the Fibonacci to take profit.

Fibonacci lesson Explained September 2020Hello Dear Traders, here is the full Fibonacci Tool ( explained) Lesson
Please Press Like and follow!!
Conditions -
1.Wait for confirmation Before Entry ( @ 61.8 or 38.2) ** Whichever is lined better with Structure**.
2.Use Market Environment + Market Structure for entry.
3. Trade always using correct risk management!
If your not sure?
comment below and ill be happy to help you all For FREE
Use a demo account to back-test This lesson!
A like and a comment will create more Free Analysis & Forex Education.
Your Support is Appreciated!
See You in the next Educational Video / Analysis
Global Fx Education

Methods 2: Retracement Levels 1This is the first installment in my second section on Methods I use for finding Support and Resistance. I use a live trade example on FOREXCOM:EURAUD to show how the simple 50% Fibonacci level was all that was needed to find where the price would inflect. While I am aware and have studied the Fibonacci levels I find that just drawing 50% levels is all I need to find good trade entries and targets. Hope all can learn from my small mistake and look forward to sharing more!
The script I wrote for to quickly identify these 50% levels are in the Link below.

Fibonacci Retrace EducationI've had a few of you guys asking me about how I determine my corrective/reversal points per fib, and since I had a great trader teach me the ropes on how fib moves, I thought I would do the same.
Follow each colored arrow to its respective fib. These are typical fib patterns to see on retraces.
The same happens in bear markets.
Also, you will need to apply these rules to the respective range.
None of this is guaranteed to happen also.
Studying fib will quickly teach you that there's fibs within fibs, so that's why you really have to measure each level and measure all ranges.
This becomes easier through time and as you apply it to your trading. Best practice is to just study retraces.
Fib IMO works best with an oscillator of choice, and an advanced level of understanding volume within price action.
Lastly, understand -- not even fib is perfect and I did not list every typical scenario that fib retraces show.
These are most of them though.
If you understand the power of the 618 and the 382 (618 inverse), then you're well on your way.
*not an indication to buy or sell*
*use at your own risk*
Educational Purposes Only.
Goodluck.

Measuring that Pullback Against Main Trend during the DayQuick tutorial video explaining how I measure the pullbacks during the day to understand normal behaviour of a trend when daytrading. This example was NQ Nasdaq on the 3 minute timeframe
Using Stochastic and Fibonacci Retracement to understand these pullbacks.
The Support and Resistance zones I mention are drawn on the 60minute timeframe. You can learn how I produce these sticky zones by watching the recording of my recent livestreaming education event here on TradingView >>RIGHT HERE<<

Trading is a never ending war for price territoryHello there, fellow traders!
Quick educational post today, with potentially useful insight for your trading practice.
You probably have noticed already: trading is never ending war for price territory.
And you probably have learned also about fibonacci levels. Standard ones, like 0.382, 0.5, 0.618 etc.
Still, there are a few other levels which, used in tandem, are capable to provide a clear picture of the battlefield , if you will.
So, here is a map you may want to keep for your reference. Traders will work inside this structure as long as there is an overall indecision regarding what is fair price.
Eventually, one side will "speak louder", and come out victorious, breaking the structure, and moving price to a new range. Then, new trenches and fight zones will be defined, and the process will start over.
Of course, there is more to price analysis than this, but it is for sure a useful way to look at it.
Hope you like it and that it helps you on your trading journey.
Cheers
PHInkTrade

Pulse of an asset ala Fibonacci: UMA nearing Impulse Redux"Impulse" is a surge that creates "Ripples", like a pebble into water.
"Impulse Redux" is returning of wave to the original source of energy.
"Impulse Core" is the zone of maximum energy, in the Golden Pocket.
Are the buyers still there? Enough to absorb the selling power?
Reaction at Impulse is worth observing closely to gauge energy.
Rejection is expected on at least first approach if not several.
Just above the Impulse is a common "Accumulation Zone".
Of interest would be consolidation between the 1.0 and 1.236.
If accumulation seen, then a break and retest of 1.236 is the entry.
Part of my ongoing series to collect examples of my Methodology : (click links below)
Chapter 1: Introduction and numerous Examples
Chapter 2: Detailed views and Wave Analysis
Chapter 3: The Dreaded 9.618: Murderer of Moves
Chapter 4: Impulse Redux: Return to Birth place <= Current Example
Chapter 5: Golden Growth: Parabolic Expansions
Chapter 6: Give me a ping Vasili: one Ping only
.
.
Ordered Chaos
every Wave is born from Impulse,
like a Pebble into Water.
every Pebble bears its own Ripples,
gilded of Ratio Golden.
every Ripple behaves as its forerunner,
setting the Pulse.
each line Gains its Gravity .
each line Tried and Tested.
each line Poised to Reflect.
every Asset Class behaves this way.
every Time Frame displays its ripples.
every Brain Chord rings these rhythms.
He who Understands will be Humble.
He who Grasps will observe the Order.
He who Ignores will behold only Chaos.
Ordered Chaos
.

Short-time downtrend and long-term uptrend is still working Confirming last analysis we are in a very nice retracment pattern in Gold.
As we expected down trend worked and price came towards its last big support of 1861usd.If you are intraday trader note carefully that downtrend is still working and and high is just a retracment.
As you can see in my daily chart we have a nice unbroken demand zone 1790to1816 and a strong support zone inside that.
I personally will be waiting to open long position there.
If you areusing 4h timeframe or less, you can sell for short-time but be careful about long term trend. It is heavily uptrend.

gbpjpy time to decide hello everyOne
i am back with another analysis about GBP
as I thought Gbp is back in the business
now its time to decide
if Price went up and passed lower high ( that mentioned in the chart ) we are facing with bullish market
actually MA <200 confirms that we are facing with bullish market
if price went down and breaked trend line then MA will be confirm that as well
notice that this is last available bullish channel that Already exists
so if we saw a break out in trend lines Its time to go short with 80% probability
if you had any question comment in bellow
I think its time to decide which side you want to be
sellers Or buyers !
targets are placed in the chart as well
and I will attach some more reasons in comments so Follow me and Be Aware
☺ ♥ This is enjoyable Trading with Mky ♥ ☺

The Trend is Your Friend: Basic Elliott Waves ExplainedIn this post, I'll be providing an in-depth explanation on Elliott Waves, specifically Impulse Waves and Corrective Waves.
I personally use Elliott Waves a lot, and as it seems like the majority of my followers are beginner traders unfamiliar with the concept of waves, I decided to do an educational post on it.
The concept of Elliott Wave Counts are extremely technical and advanced, so in this post, I'll only be going over the two most common waves: The Impulse and Corrective Waves
Elliott Waves Background Information
The Elliott Wave Theory was named after Ralph Nelson Elliott, who concluded that the movement of assets could be predicted by observing and identifying a repetitive pattern of waves. He was able to identify specific characteristics of wave patterns, making detailed predictions based on the patterns.
Very simply put, the direction of a trend unfolds in 5 waves (impulse waves) and any correction against the trend takes place in 3 waves (corrective waves). The 5 impulse waves are labelled ‘12345’, and the corrective waves are labelled ‘abc’.
*A bear market would show a downward trend, indicating that we’d see five waves down, and three waves up.
Smaller patterns can be identified within bigger patterns. As demonstrated in the diagram above, we can see that the impulse and corrective waves in green, are combined to form a larger wave in black, which is also part of a larger wave in red.
In technical terms, this is the classification of wave degrees. On Tradingview, the smallest to largest, the degree goes as follows: Miniscule, Submicro, Micro, Subminuette, Minuette, Minute, Minor, Intermediate, Primary, Cycle, Supercycle, Grand Supercycle, Submillennium, Millennium, Supermillennium.
The idea of using smaller patterns fit into bigger patterns, can be coupled with the Fibonacci relationship of the waves, offering insight on optimal levels of trade opportunities, and calculations of risk reward ratios (RRR).
What are Fibonacci levels?
Simply put, Fibonacci levels are a series of numbers discovered by Leonardo Fibonacci, in which a golden ratio (1.681) is derived by dividing a Fibonacci number with another previous Fibonacci number.
The Golden Ratio derived through the Fibonacci can be found in predictable patterns in nature from atoms to huge stars in the sky, as nature uses this ratio to maintain balance. Such ratios are very commonly found in the financial markets as well.
Elliott Impulse Waves (12345)
The Elliott Impulse Wave, which unfolds in 5 waves, has a few guidelines in terms of the rules that must be kept, and references to the Fibonacci ratio.
- An Impulse Wave can be subdivided into 5 waves (For instance, the black wave in the diagram is subdivided into smaller green waves)
- Wave 1, 3, and 5 are impulsive.
- Wave 2 cannot retrace more than the beginning of wave 1
- Wave 3 cannot be the shortest wave of the three impulse waves
- Wave 4 cannot retrace below the peak of wave 1
- Wave 5 needs to end with a momentum divergence
- In terms of Fibonacci ratios, there is not set answer, but there are some references we need to keep in mind:
- Wave 2 is 0.5, 0.618, 0.764, 0.854 of Wave 1
- Wave 3 is 1.618, 2, 2.618, or 3.236 of Wave 1-2
- Wave 4 is 0.146, 0.236, or 0.382 of Wave 3, but no more than 0.5
- Wave 5 can be the inverse 1.23611.618 retracement of wave 4, or 0.618 of wave 1-3, or equal to wave 1.
Elliott Corrective Waves (ABC)
When referring to corrective waves, this can include the use of other wave counts. In this post, we’ll be specifically looking at a corrective count also known as the Zigzag.
- A Zigzag is a corrective 3 waves structure that is counted as ABC
- Subdivision of Wave A and C comes in 5 waves
- A Zigzag is a 5-3-5 structure (In the diagram above, we can see the black Zigzag waves, which consist of a 5-3-5 wave count in green)
- Wave B is 0.5, 0.618. 0.764, or 0.854 of wave A
- Wave C is 0.618, 1, or 1.236 of wave A
- If wave C is 1.618 of wave A, it can either be a 3 or 5 waves count.
Application
We can take a look at Bitcoin’s weekly chart as an example of how Elliott Waves work. While I haven’t included the specific counts for simplicity sake, it provides a good idea of how the market moves.
Overall, we can clearly see that the trend is bullish. However, prices don’t always shoot straight up without stopping. It breaks out, corrects slightly, and breaks out again. The repetition of impulse waves, and smaller corrective waves, is what completes the uptrend.
This is why ‘buying the dip’ is a smart move during a bull market. Corrections are inevitable even in the most bullish market, and taking into consideration the fact that the trend is your friend, such corrections would merely be a buying opportunity.
Almost all assets take one step back for two steps forward. This is how the market works according to the Elliott Wave Theory.
Limitations
Elliott Waves have a critical weakness: it’s extremely subjective. Even while looking at the same chart, traders can count different waves, as it’s difficult to pinpoint the beginning or end of a wave. As with many other tools in predicting the market, it seems that the most common case is that traders are almost 100% accurate, or completely wrong.
As such, I personally like to use this tool merely as a reference in weighing out probable scenarios, rather than solely relying on my rather subjective wave count.
Final Remarks
I tried to dissect the basics of the Elliott Wave theory in this post. The concept itself is extremely advanced, and the explanation I provided above is merely the tip of the iceberg. Understanding Elliott Waves, while it’s not a silver bullet in trading, can help traders understand the overall trend, identify probable scenarios, and calculate optimal risk reward ratios based on wave targets.
If you like this analysis, please make sure to like the post, and follow for more quality content!
I would also appreciate it if you could leave a comment below with some original insight.

USDCADBeing a retail trader isn't so bad as long as we can utilise all of the tools in our belt correctly.
(Trendlines)

Pulse of an asset ala Fibonacci: LRC two spurts of Golden GrowthThis Chart is a an example of a "Golden" Fib series.
This Concept is from "Chapter 5" of my going "book".
This Religion is of the universality of the "Golden Ratio".
.
My "Book" detailing my Methodology with Numerous Examples:
Chapter 1: Introduction and numerous Examples
Chapter 2: Detailed views and Wave Analysis
Chapter 3: The Dreaded 9.618: Murderer of Moves
Chapter 4: Impulse Redux: Return to Birth place
Chapter 5: Golden Growth: Parabolic Expansions
Chapter 6: Give me a ping Vasili: one Ping only
.


GBPUSD DEMAND LEVEL + FIBONACCIGBPUSD DEMAND LEVEL + FIBONACCI. Excellent week ahead. Looking for a buy in the demand zone!

GBPJPY DEMAND LEVEL + FIBONACCIGBPJPY DEMAND LEVEL + FIBONACCI. Look how the price is reacting to this powerful zone! What a week ahead!!!

Backtesting GUClear rejection in the 61.8 to 78.6 % fibnocci thereby forming the inverted H&S.
+130 pip in profit with no drawback.

Pulse of an asset ala Fibonacci: BTC Golden Fib and some signsThis Chart is a an example of a "Golden" Fib series.
This Concept is from "Chapter 5" of my going "book".
This Religion about the universality of the "Golden Ratio".
Marked on chart are "Pings", ricochets that one can almost HEAR.
"Not all Pings start a reversal, but Most reversals start with a Ping."
Top had a "Loud" ping, with possible bottom of several loud pings.
Every Ping is like a bug hitting a spider's Web.
The vibration alerts and emboldens other strands.
Thus we observe the behavior at each strand for clues.
.
My "Book" detailing my Methodology with Numerous Examples:
Chapter 1: Introduction and numerous Examples
Chapter 2: Detailed views and Wave Analysis
Chapter 3: The Dreaded 9.618: Murderer of Moves
Chapter 4: Impulse Redux: Return to Birth place
Chapter 5: Golden Growth: Parabolic Expansions
Chapter 6: Give me a ping Vasili: one Ping only
.
