Fibonacci Retracement and Extensions Imagine a Box that's being fired everytime market makes a swing.
Multiples of boxes of bear/bull. That is what fib is 0 to 1.
Many people say "So its going to go up or So its going to go down?" well answer to that is BOTH.
They are always fighting and more often than naught one will break and other one will move on to its multiplier.
Pretty simple and powerful stuff.
Fibonacci

Shield walls & battle plans when using pivot points.I always recommend when it comes to bull markets, "nibble on dips, and enjoy the rips." No need for profit taking, but when capital needs to be invested the best modus operandi is to wait till price falls and confirms a bounce off the pivot points to the right.
I want to put in your minds eye, your third eye an image. A warzone between warring Viking clans. I do not care if you are short or long (although it is ill-advised to short a bull market) but use these pivot points for planning all your entries and exits. Imagine you are on the battlefield and you have the warring Viking shield wall running right at you, and you are in the middle of the field on your lonesome - I would say unless you have the buying power of a market maker it will not end well and typically you enter your position immediately in a loss. Now, let's say instead you watch on the sidelines and see the enemies charge the shield wall and clash into the pivot point. I recommend joining your shield wall at that point as you will have an army of buyers putting up a fight with you. Or if the wall breaks with confirmation, and we are in a bear market you have a target for your short and you will know where to take profits and bow out for the next conflict.
I do not know if that imagery is of any aid to anyone, but literally this how I view trading and it makes it a heck of a lot more entertaining to watch it play out. We are blessed to not be in a day & age of having actual shield walls, but let's still trade strategically with a battle plan as the capital and resources are exactly what many of those conflicts were all about.
Good luck trading guys!

Fibonacci Trading strategy revealed Hi Fellowers,
In this chart i reveal on of my most basic but very powerfull trading strategy's
It is one of the most simple methods I use within trend trading analysis.
I use fibonacci extensions and fibonacci retracements, and elliot wave theory.
Now, elliot wave theory is pretty complex to understand so I do not cover this in this subject.
In this subject I just reveal how i trade my major trending pairs in crypto, with a high succes rate.
We draw fibonacci retracements, in an explosive trend, we enter the trade on the 50% retracement, in a longer term medior trend, we try to enter on the 61.8% retracements.
We use our 78.6% as stop los ( As 76.4 is an important fib ratio) we keep the price just below it ;)
Then we do the reverse retracements and add our 127.2 and 161.8% levels in the extensions, those are our exit points. We trade level to level , which means that we draw each extensions on each wave. And we target each level after each trade has been placed.
Happy trading folks.

Simple But Effective Stochastic Trading StrategyUsing the False Breakout Stochastic indicator and the Fibonacci Retracement tool, I discuss a very simple trading strategy. Identifying trend direction, direction change, measured pullbacks, trading opportunities and when to get in and out of trades are all discussed din this quick video. Keep it simple and this will help you to start to understand the behaviour of any instrument

How to use Fibo levels in trading?Hi guys, as I promised, this post is about Fibonacci Levels for YOU!🧡
Many newbies on the market, and I'm sure this post can be helpful, so must be repeated 💪
Leonardo Fibonacci is a great mathematician who lived in the XI century. The scientist deduced a number of natural numbers, which later began to bear his name.
Each number in the series was the sum of the two previous numbers: 1 + 1 = 2; 1 + 2 = 3; 2 + 3 = 5 etc.
The result is a series of numbers: 1, 2, 3, 5, 8, 13, 21, 34, 55, 89, 144, etc.
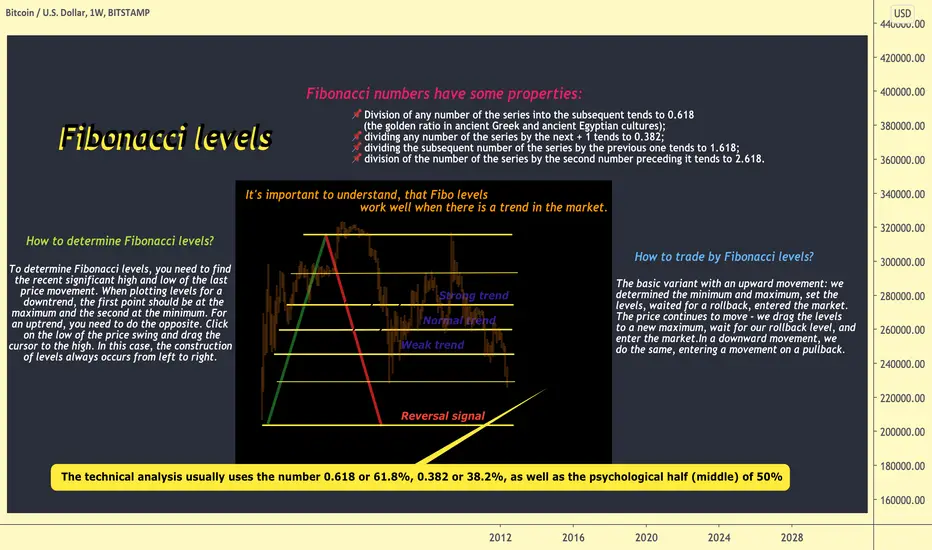
Fibonacci numbers have some properties:
📌Division of any number of the series into the subsequent tends to 0.618 (the golden ratio in ancient Greek and ancient Egyptian cultures);
📌dividing any number of the series by the next + 1 tends to 0.382;
📌dividing the subsequent number of the series by the previous one tends to 1.618;
📌division of the number of the series by the second number preceding it tends to 2.618.
Fibonacci numbers are often used not only in technical analysis , but also in physics, astronomy and other disciplines.💪🏻
Fibonacci levels are a tool that sets horizontal support and resistance levels on the price chart based on price movement.
It's important to understand, that Fibo levels work well when there is a trend in the market.
How to determine Fibonacci levels?
To determine Fibonacci levels, you need to find the recent significant high and low of the last price movement. When plotting levels for a downtrend, the first point should be at the maximum and the second at the minimum. For an uptrend, you need to do the opposite. Click on the low of the price swing and drag the cursor to the high. In this case, the construction of levels always occurs from left to right.
How to trade by Fibonacci levels?
The basic variant with an upward movement: we determined the minimum and maximum, set the levels, waited for a rollback, entered the market. The price continues to move - we drag the levels to a new maximum, wait for our rollback level, and enter the market.
In a downward movement, we do the same, entering a movement on a pullback.
The technical analysis usually uses the number 0.618 or 61.8%, 0.382 or 38.2%, as well as the psychological half (middle) of 50%.
✔ Very often, based on these coefficients in the technical analysis of the market, Fibonacci lines, Fibonacci levels and Fibonacci periods are built.
Fibonacci lines are built relative to significant highs / lows and represent support or resistance lines, from which they make a purchase or sale.
Fibonacci numbers - the magic of numbers that works in trading and in everyday life .
💥You can simply draw arbitrary horizontal lines on the chart, and ... oh that's mystic... they will also be worked out both in the past and in the future.💥
We can make some conclusions:
🔵Fibonacci tool draws support and resistance lines on the chart based on price movement;
🔵the Fibonacci tool is always applied on the price chart from left to right, both in the case of long positions in an uptrend, and in the case of short positions in a downtrend;
🔵the levels marked between the beginning and the end of the price movement are correction levels, they show which levels the price is likely to return to;
🔵the most common Fibonacci retracement levels are 38.2%, 50% and 61.8%, they are often used to enter the market;
🔵there are two ways to use correction levels to enter the market: aggressive (entry at each of the levels) and passive (waiting for the price to correct in the originally observed direction);
🔵It's important to note that Fibonacci levels are not a trading system, they are an additional tool that only suggests possible correction levels; it should be used only in combination with a trading system or as part of a trading system.
I hope everything was clear for You, and You found this post as helpful🙏🏻
I really wanna be useful to you, guys!
I make every post with love and it brings me extraordinary pleasure!🙏🏻
Thank you for staying with me💋
Always sincere with You🧡
Your Rocket Bomb🚀💣
Dead Cat Bounce ScenarioHello, dear subscribers!
Today we are going to examine a very interesting chart pattern which can help you to find the hidden danger in the market.
The dead cat bounce is the reverse bearish pattern, hence the market should be in the uptrend before it's formation.
After the swing high point is reached the sharp price drop usually follows. When we are able to identify the swing low we shoud measure the first bounce height. For this purpose we can use the Fibonacci retracement levels from the swing high to the swing low.
For the traditional markets it is typically used the 0.5 Fibonacci level, but on the cryptomarkets the 0.61 level can be used too due to high volatility.
If the price was unable to close above this Fibonacci level during the first bounce, there is a high probability of dead cat bounce scenario, when the price continue to fall and the global downtrend changes the uptrend.
We use the current Bitcoin price action to illustrate this pattern. There is a big danger now to execute exactly this scenario. Please, be careful!
DISCLAMER: Information is provided only for educational purposes. Do your own study before taking any actions or decisions.

EUR/AUD Buy Trade Education ReviewHere I'd just like to go over a great buy position on EUR/AUD.
We know the pair is in a long term downtrend. This doesn't mean we can't take intraday buys on the pair providing we target sensible levels.
Here we are highlighting how a trendline can be utilised as dynamic resistance. The fibonacci level drawn from our 1hr swing low to high shows that our 0.764 level coincides with our descending trendline and adds confluence to the buy position. Never trade off fibonacci levels alone, but as confluence and to help you manage trades they are absolutely fine.
We can see our sensible target is the previous 1hr swing high.

AUD/JPY - Counter Trend StrategyThis was a beautiful trade from earlier on during the week
that I unfortunately missed haha.
As you can see the
confluences are stacked and the entry is always when
the momentum enters the market.

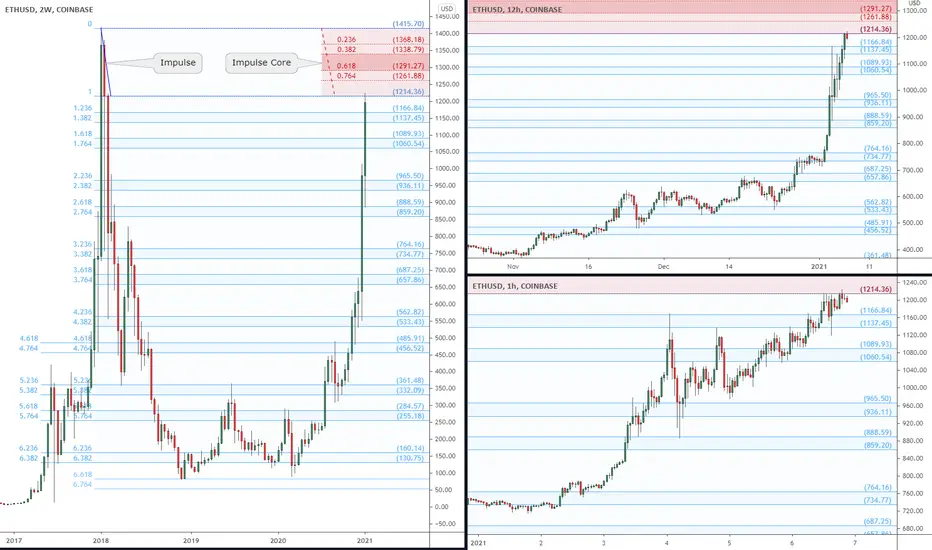
Pulse of an Asset via Fibonacci: ETH at EPOCH Impulse Redux"Impulse" is a surge that creates "Ripples", like a pebble into water.
"Impulse Redux" is returning of wave to the original source of energy.
"Impulse Core" is the zone of maximum energy, in the Golden Pocket.
Plotted above is the Impulse from All Time High in 2017.
That first push down set off a series "Ripples" flowing down.
This fib defined most of the turns since, and now we are back.
Are the sellers still there? Enough to absorb the buying power?
Reaction at Impulse is worth observing closely to gauge energy.
Rejection is expected on at least first approach if not several.
Part of my ongoing series to collect examples of my Methodology : (click links below)
Chapter 1: Introduction and numerous Examples
Chapter 2: Detailed views and Wave Analysis
Chapter 3: The Dreaded 9.618: Murderer of Moves
Chapter 4: Impulse Redux: Return to Birth place <= Current Example
Chapter 5: Golden Growth: Parabolic Expansions
Chapter 6: Give me a ping Vasili: one Ping only
.
.
Ordered Chaos
every Wave is born from Impulse,
like a Pebble into Water.
every Pebble bears its own Ripples,
gilded of Ratio Golden.
every Ripple behaves as its forerunner,
setting the Pulse.
each line Gains its Gravity .
each line Tried and Tested.
each line Poised to Reflect.
every Asset Class behaves this way.
every Time Frame displays its ripples.
every Brain Chord rings these rhythms.
He who Understands will be Humble.
He who Grasps will observe the Order.
He who Ignores will behold only Chaos.
Ordered Chaos
.
.
.
want to Learn a little More?
can you Spend a few Moments?
click the Links under Related.
EDUCATION: Logarithm Growth Curve Hello, dear subscribers!
Today we are going to examine very simple and intersting instrument which is applicable for the global price movement analysis.
The logarithm growth curve is based on Fibonacchi retracement levels. As it is known the Fib retracement based on swing high and low levels. But in case of growth curve we use the logarithm scale to take in account the periods of the fast growth (to the moon periods).
The price usually faces with difficulties to break through the Fibonacci levels. We can notice massive pullbacks near these levels or the price growth in cases of breakouts.
Let's consider the current situation on the Bitcoin market. There is a rejection of 50% Fibonacci level. Now we should observe if the price break through this level or the drop began now. If the first scenario occurs we can see a massive growth to 61% or 100% Fibonacci levels.
DISCLAMER: Information is provided only for the educational purposes and should not be used to take action in the markets.

How to Properly Use the Fibonacci Retracement ToolI've recently come across a lot of posts where the fibonacci retracement tool was erroneously used, and this gave me a good idea for an educational post.
Introduction: The Fibonacci Sequence
- Before talking about fibonacci retracements, it's important to understand what fibonacci sequences are.
- Fibonacci sequences are numbers that are equal to the sum of the preceding two numbers, starting with 0 and 1.
- So a fibonacci sequence would look like this: 0, 1, 1, 2, 3, 5, 8, 13, 21, and so on.
- The fibonacci sequence is also known as nature's code, as these numbers are commonly found among nature as well. The number of petals of flowers is a prime example.
The Fibonacci Ratio
- The fibonacci ratio is derived by dividing the numbers within the fibonacci sequence
- The 0.618 (61.8%) for instance, is approximately the value when we divide 21 by 34, and 55 by 89
- The 0.382 (38.2%) ratio is calculated by dividing a number by another number located two spots to the right.
- The 0.236 (23.6%) is calculated by dividing a number by another one three spots to the right.
- Just like the fibonacci sequence, fibonacci ratios are commonly found in nature as well, through flowers, galaxy formations, and spirals on shells
Fibonacci Retracement
- The fibonacci retracement is a tool in which horizontal lines are drawn to help traders identify support and resistance
- These horizontal lines are based on the fibonacci ratios
- Interestingly enough, just as the fibonacci ratios are commonly found in nature, they are also found in the market, reflected by charts
- A fibonacci retracement can be identified by connecting the swing high to the swing low of a downtrend, and the swing low to swing high of an uptrend
- The connection between the high and low points are where most traders get confused.
Application
- On the left hand chart, we can see that the swing high has been connected with the swing low
- As a result, we could identify possible resistance levels for Bitcoin's bullrun in 2019.
- Prices touched the 0.618 fib resistance level , and eventually attempted to break the 0.5 fib, but failed
- We can also see that the 0.382 and 0.786 levels played a key role as support and resistance
- On the right hand chart, we can see the swing low connected to the swing high
- Based on the fib levels of this retracement, we could identify strong support at the 0.786 level, around $4k.
Conclusion
The fibonacci retracement tool can be a very effective way to identify areas of support and resistance , but they need to be applied correctly. Don't forget to connect the swing highs and lows based on the trend!
If you like this educational post, please make sure to like, and follow for more quality content!
If you have any questions or comments, feel free to comment below! :)

Elliott wave : corrective wave How to use fibonacci retracement and extension
this entire trend was started at 1857 and ends at 1900 with wxy zigzag corrective wave.
wave x is subdivide into abc flat correction which retraced upto 0.382 of wave X at 1870
wave y made 1.382 projection of wave w at 1900.
the entire wxy trend made 50% retracement at 1878.
(retracement after wave y overlap wave x high which made clear that these are corrective wave not the impulsive wave )
how to trade ?
buy at 0.383 retracement of wave X and exit at 1.382 projection
sell at 1.382 projection at 1900 and exit at 0.50 retracement

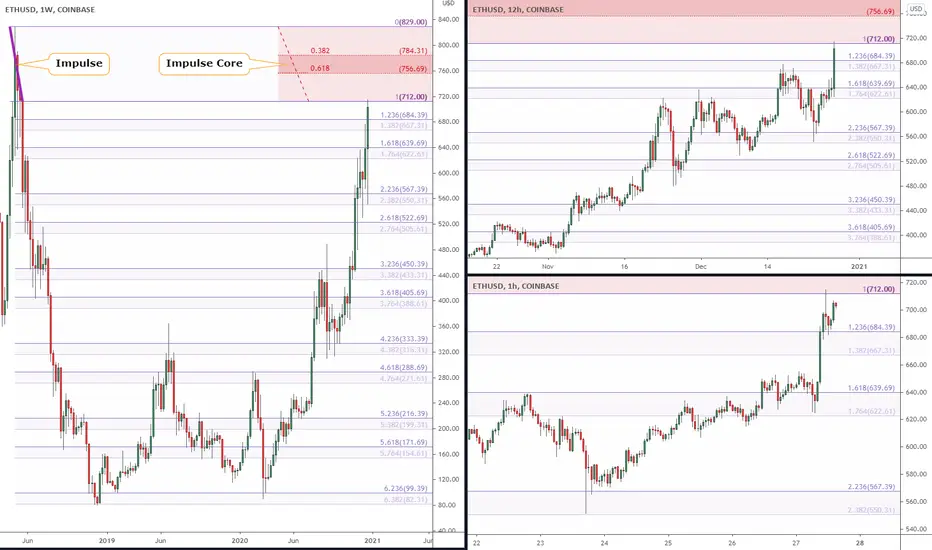
Pulse of an Asset via Fibonacci: Ether at GRAND Impulse Redux"Impulse" is a surge that creates "Ripples", like a pebble into water.
"Impulse Redux" is returning of wave to the original source of energy.
"Impulse Core" is the zone of maximum energy, in the Golden Pocket.
Are the sellers still there? Enough to absorb the buying power?
Reaction at Impulse is worth observing closely to gauge energy.
Rejection is expected on at least first approach if not several.
This particular Impulse was born in May 2018 from the $829 top.
The Ripples of that Impulse have caught EVERY turn since then.
What happens here will have PERMANENT ramifications for ETH.
.
Part of my ongoing series to collect examples of my Methodology : (click links below)
Chapter 1: Introduction and numerous Examples
Chapter 2: Detailed views and Wave Analysis
Chapter 3: The Dreaded 9.618: Murderer of Moves
Chapter 4: Impulse Redux: Return to Birth place <= Current Example
Chapter 5: Golden Growth: Parabolic Expansions
Chapter 6: Give me a ping Vasili: one Ping only
.
.
Ordered Chaos
every Wave is born from Impulse,
like a Pebble into Water.
every Pebble bears its own Ripples,
gilded of Ratio Golden.
every Ripple behaves as its forerunner,
setting the Pulse.
each line Gains its Gravity .
each line Tried and Tested.
each line Poised to Reflect.
every Asset Class behaves this way.
every Time Frame displays its ripples.
every Brain Chord rings these rhythms.
He who Understands will be Humble.
He who Grasps will observe the Order.
He who Ignores will behold only Chaos.
Ordered Chaos
.
.
.
want to Learn a little More?
can you Spend a few Moments?
click the Links under Related.
EDUCATION: Fibonacci Extensions Hello, dear subscribers!
The topic of this article is Fibonacci Extensions.
What is Fibonacci Extensions?
This indicator demonstrates the hidden potential resistance levels for the uptrend and support levels for the downtrend. Here is as example of the uptrend Fib Extensions.
Let's make a reservation right away that the Fibonacci Extensions is not the same as Fibonacci Retracement. The second one is usually used for the pullback levels definition after a huge dump, but not for the potential targets of the uptrend.
How to define the Fibonacci Extensions?
For the levels definition we should find the lowest (point A) and highest (point B) points of the last global swing. After that we should define the lowest point of current swing and the beginnig of the uptrend (point C). The extensions are defined with the Fibonacci numbers and the corresponding levels are 23%, 38%, 50%, 61%, 78%, 100% and 161%. This levels are calculated automatically in the TradingView.
How to use Fibonacci levels?
As you can see on the chart these levels are usually associated with the difficulties for the price to break it through. These are resistance levels and if some of these levels is broken by the price it is likely to see the next Fib level. For example, now the BTC price is testing the 161% Fib level and if it break this level confidently the next price target could corresponds to the next Fib extensions level.

Fibonacci Levels - Rocket Bomb's EDU post 🔥Hi guys, as I promised, this post is about Fibonacci Levels for YOU!🧡
Leonardo Fibonacci is a great mathematician who lived in the XI century. The scientist deduced a number of natural numbers, which later began to bear his name.
Each number in the series was the sum of the two previous numbers: 1 + 1 = 2; 1 + 2 = 3; 2 + 3 = 5 etc.
The result is a series of numbers: 1, 2, 3, 5, 8, 13, 21, 34, 55, 89, 144, etc.
Fibonacci numbers have some properties:
📌Division of any number of the series into the subsequent tends to 0.618 (the golden ratio in ancient Greek and ancient Egyptian cultures);
📌dividing any number of the series by the next + 1 tends to 0.382;
📌dividing the subsequent number of the series by the previous one tends to 1.618;
📌division of the number of the series by the second number preceding it tends to 2.618.
Fibonacci numbers are often used not only in technical analysis , but also in physics, astronomy and other disciplines.💪🏻
Fibonacci levels are a tool that sets horizontal support and resistance levels on the price chart based on price movement.
It's important to understand, that Fibo levels work well when there is a trend in the market.
How to determine Fibonacci levels?
To determine Fibonacci levels, you need to find the recent significant high and low of the last price movement. When plotting levels for a downtrend, the first point should be at the maximum and the second at the minimum. For an uptrend, you need to do the opposite. Click on the low of the price swing and drag the cursor to the high. In this case, the construction of levels always occurs from left to right.
How to trade by Fibonacci levels?
The basic variant with an upward movement: we determined the minimum and maximum, set the levels, waited for a rollback, entered the market. The price continues to move - we drag the levels to a new maximum, wait for our rollback level, and enter the market.
In a downward movement, we do the same, entering a movement on a pullback.
The technical analysis usually uses the number 0.618 or 61.8%, 0.382 or 38.2%, as well as the psychological half (middle) of 50%.
✔ Very often, based on these coefficients in the technical analysis of the market, Fibonacci lines, Fibonacci levels and Fibonacci periods are built.
Fibonacci lines are built relative to significant highs / lows and represent support or resistance lines, from which they make a purchase or sale.
Fibonacci numbers - the magic of numbers that works in trading and in everyday life .
💥You can simply draw arbitrary horizontal lines on the chart, and ... oh that's mystic... they will also be worked out both in the past and in the future.💥
We can make some conclusions:
🔵Fibonacci tool draws support and resistance lines on the chart based on price movement;
🔵the Fibonacci tool is always applied on the price chart from left to right, both in the case of long positions in an uptrend, and in the case of short positions in a downtrend;
🔵the levels marked between the beginning and the end of the price movement are correction levels, they show which levels the price is likely to return to;
🔵the most common Fibonacci retracement levels are 38.2%, 50% and 61.8%, they are often used to enter the market;
🔵there are two ways to use correction levels to enter the market: aggressive (entry at each of the levels) and passive (waiting for the price to correct in the originally observed direction);
🔵It's important to note that Fibonacci levels are not a trading system, they are an additional tool that only suggests possible correction levels; it should be used only in combination with a trading system or as part of a trading system.
I hope everything was clear for You, and You found this post as helpful🙏🏻
I really wanna be useful to you, guys!
I make every post with love and it brings me extraordinary pleasure!🙏🏻
Thank you for staying with me💋
Always sincere with You🧡
Your Rocket Bomb🚀💣

My FIB Method (Part 4) Entries and Exits If you have seen my previous 3 FIB Method posts you would know that I use fibs to define trend, identify key areas of resistance and support as well as predict price movement. In this post I have tried to detail how I use fibs to trigger entries and define risk. Most of method in this section is based around the 618 FIB (golden ratio). In the simplest terms... if you enter long/ short at the 618 in a retracement you are given an automatic 1.6 risk to reward setup if your stop is place below the 1.0 point and your 1st target is at the 0 point of the fib measurement. (See inset diagram on the left). Knowing this a trader can pinpoint areas on a chart that offer excellent entry points with controlled risk. The PENN chart shows three different entries all based on FIBs using common chart patterns. Although the patterns are easy to find and recognize newer traders will quickly discover that choosing an entry and planning stops can be extremely difficult. The FIBs help me make consistent entries and exits based on specific criteria. It allows me to stick to a process that is repeatable and consistently profitable over a series of trades. I outlined the three PENN trades drawn on the chart below.
1. Base break out/Bottom reversal Trade
For reversals I look to enter a long trade after the downward trend line is broken. The entry would be the 618 pull back into the trendline. T1 would be the top pivot. Stop would be below the lower pivot.
2. Flag pullback/Trend Continuation Trade.
In an up trend I would look for an entry on a pull back. I would wait for tight consolidation then a break of the upper trendline higher. I would then enter on a pull back to the breakout point at the 618. T1 would be the Pivot high and the stop would be the lower pivot.
3. ATH breakout from Consolidation.
PENN made a new all time high and has entered an period of consolidation. I draw a FIB from the top to the bottom of the consolidation and define the area between the ATH and 236fib or 382fib.(this case the 236fib) with a box. One entry would be a break of the all time. T1 for the ATH breakout would be a 1.27 extension. The stop would be a close below the 236 box. An alternative entry would be a pull back trade from the ATH within the 236 box. I measure the from the most recent high to the most recent low pivot and enter at the 618. T1 would be the ATH. The stop would be below the most recent pivot low.
Study the chart as it may be easier to understand than my written description. Please note this is a daily chart so the setups would be swings as they would take a few days to play out. All these patterns can be played exactly the same way on the the lower time frames. I personally focus on the 15M and 30M charts for intraday trades. If you follow my trades you will notice that I am trying to provide more detail on entries and exits on multiple time frames.
This is just one more piece of the the entire process I use to trade. It is not meant to be a stand alone system. I have rules regarding the types of instruments I trade and when and this does not include any information on position sizing. Every trader must develop their own specific trading plan that suites their risk profile and trading style.
Feel free to comment or DM me with any questions. I love to talk charts.
PS.. My next post will go further into how I trade lower time frame reversals and breakouts in zones that I have identified on high time frames.

Simple and effective use of Fibonacci correction levels Hello, Traders!
Today I will explain how to use a trading strategy based on correctional Fibonacci levels as simple and rational as possible.
Using the ZIL example, we will highlight the period from November 4 to 25, where the price has entered an uptrend.
Our task is to stretch the Fib retracement from the beginning of $0.01666 until the end of the uptrend of $0.03681.
We place 4 buy orders at correctional Fibonacci levels :
0.382 (0.02911) - 10% of the transaction amount
0.50 (0.02674) - 20% of the transaction amount
0.618 (0.2436) - 30% of the transaction amount
0.786 (0.2097) - 40% of the transaction amount
SL should be placed under the level 0.786. In our case, it is 0.01921 $.
The average price of entering the transaction, in this case, will be $ 0.2396. Thus, the stronger the price is corrected, the less the drop will be relative to the average entry price.
The correction levels of Fibonacci from 0.618 to 0.0 of upward movement will be the targets.
As a rule, after the correction, the price bounces from the levels and we will have an opportunity to close a deal at least without losses, and at best make a good profit.
This is a very simple and effective strategy that has proven itself not only on a daily timeframe, it can also be used on shorter price movements. It can also be used on other price movements like H4 or H1 timeframes.
Leave your feedback below and good luck!

Using Fibonacci Speed/Resistance Fan to Manage Trending Trades Quick Video Tutorial teaching a very simple way to use the TradingView Fibonacci Speed Resistance Fan to manage trades that are trending..
When we run out of Linear Support & Resistance zones as an instrument is making new highs, we need to rely on "Non Linear" Support & Resistance to help us manage trades that just keep going.
And the Fibonacci Speed Resistance Fan is the perfect tool........

Trading parallel channel like Proin parallel channel there are two trend lines parallel to each other.
You buy/sell at trend line.
near the yellow arrow sign. you multiple resistance
trend line
fib retracement
previous support now turned into resistance
trade always have two part Entry and exit
you have multiple resistance to sell and you exit at 100% projection of wave at lower trend line of channel
this is perfect example : How you can trade using trend lines, fib retracement and extension, support and resistance.
(market doesn't give you this type trade everyday. so you have to wait which strategy is giving you signal to trade. if you wait you always spot this type of trade easily ).

first test run: psychological effect range theory applied to fibMost things are written on the chart. I have hidden the reference fib itself as it is specifically edited for a certain purpose, but I base it on the psychological effect range theory (should be easy to figure out my methodology just knowing that) as well as the silver ratio for highs rather than the somewhat misused golden ratio (it's not really that prevalent in things, but... the silver ratio is). If it pans out I will show it perhaps
If you are not familiar with the silver ratio it is 1+sqrt(2), or 2.4142~. It is an irrational number. It is an infinitely descending series of 2 + 1 over itself. i.imgur.com image so it makes more sense
First we need to know why fib is naturally flawed (a fib haha!) as a tool. phi (yawn trdvw wont let me post the greek letter), phi = 1 + sqrt(5) / 2. Now, this seems to be too complex needlessly to me. Nature is simplistic in its foundation, but simple in its own way. It is highly irrational when it begins to contend with shapes that are not squares. A circle by definition is irrational, since it is made of an infinite number of angles, and this concept is best described as an o.
But regardless of how people talk about it it's not proven in any measure to be truthful, BUT can be used it certain ways to frame one's set of planning, better than no planning and all.
so what makes more sense for a deterministic chart
1+sqrt(5)/2 or 1+sqrt(2)?
trick question, neither does.
However, I am using it as my upper range in regards to the fib retracement tool. It is the 'end goal'- of the bull run. this happens to be 25k, if you don't zoom around the chart. the first target, however, is the sqrt(2), 1.4142. that's at 20,400, and completely reasonable to blow past should the psychological barrier of 20k (which is 2/3rd of the way from the line below sqrt(2) and the previous line, btw).
There is the math behind the levels being picked, but really, the concept underlies effect range theory, in that most people tend to over or underreact to situations, and if in a median approach, tend to end up in another one before too long.
The trend sections on my (not shown, but published privately yesterday for honesty's sake) chart show the channels of interest mostly lining up with profit/loss; if a range is being overused, it won't want to stay in that range, otherwise what's the point? you're trading the same amounts for the same amounts.
I am rather new to financial markets but not new to analysis so I welcome anyone who can lead me to those that already decided/figured some of these out. I am still studying and trying to learn.

My FIB Method (Part 3) Movement between Fib levelsThe current price consolidation of the ES offers a good example of how price moves between the FIB levels. I use these levels to identify zones for potential reversals and targets.
In this example I would treat the FIB levels as resistance until they are broken. Once they are broken I treat them as support and look for price to move to the next FIB level. As the time zones increase
the significance and strength of the levels increase as well. Although I primarily use FIBs in my trading it should be noted that there is often confluence with the key moving averages
that I use as well. The 9em, 21ema and the 55sma. The movement of the market is difficult if not impossible to predict. This it is one way to focus on high probability areas to make trades, place stops and take profits.

Trend Trading Techniques and Strategy!!! In a strong trending market, it is important to find entries at the high probability zones i.e. Fib Retracements. Ideally within the .382 - .618 zones. It may be tempting to enter the market during a period of strong momentum, but itmust be known that every strong trend contains correction phases, this is where you capitalise on the trend momentum. Entering the market mid-impulse can work occasionally and can be misleading to the beginner trader, over a long period of time this just wont work(All profitablilty and success of a trader comes from a long period of trades/ time trading, one trade does not determine success). Once price has corrected to the ideal Fib zone, you can now look for an entry setup to capitalise on the potential momentum shift and continuation of impulse.

